
The Conversation (0)
Sep. 14, 2017 04:45PM PST
The US dollar index is oversold on a weekly basis, and for now the line of least resistance is upwardly biased, says Terry Yaremchuk in this article.
In my January 2017 analysis of the DX titled “The Buck Stops Here,” I wrote about the negative divergence forming between the US dollar index price and moving average convergence divergence (MACD) on a weekly basis, and the negative implications for the DX relative to its peers. This was a contrarian call, as the vast majority of pundits at the time had been calling for a continuation of the US dollar bull market, with predictions of higher highs for the dollar on the heels of the Trump election.
Hindsight has since proven that level to be the high-water mark for the DX, and the fall has been swift and deep. A significant support level been tested and subsequently broken, resulting in an extreme oversold condition for the US dollar index on a weekly basis, as indicated by relative strength index (RSI) and MACD.
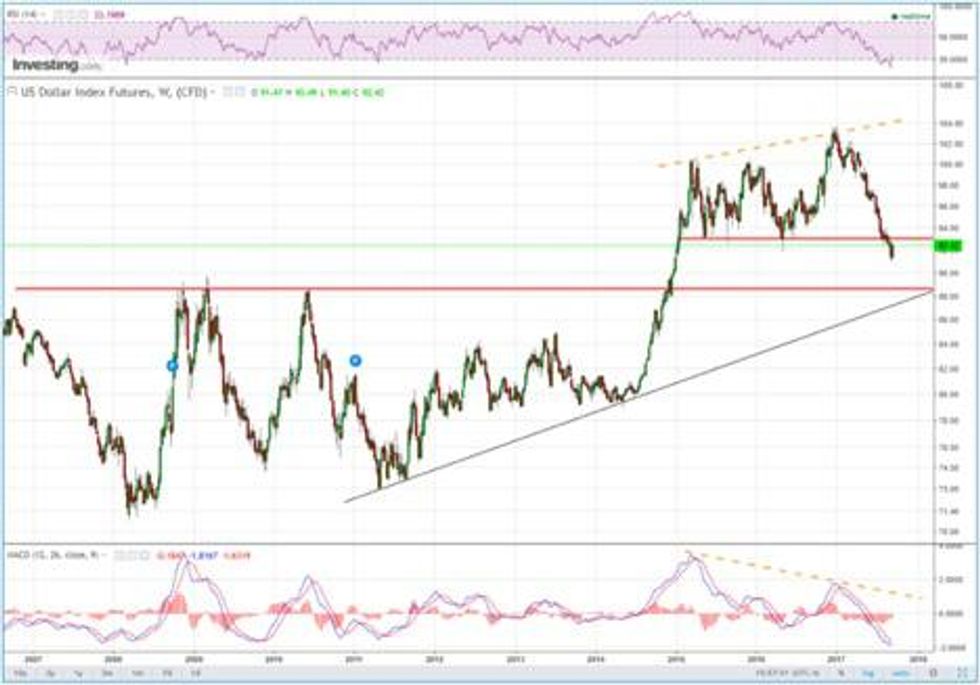
Source: Investing.com, September 13 ,2017
Negative divergence, as indicated by the orange dashed lines, occurred when the price hit higher highs coincident with lower highs of MACD. On a weekly basis, this is a very significant event that more often than not is indicative of negative follow through. RSI is a comparative measure, and levels above 70 and below 30 are indications of overbought and oversold conditions.
This week’s action has seen a relief in selling pressure with an upward reversal in price. Accompanying this action has been a strengthening RSI and a flattening in the downward sloping MACD. Could this imply that we are at an interim bottom? Possibly, but sideways action can also relieve overbought and oversold conditions prior to the continuation of a trend or a reversal. Below is what I consider a likely scenario over the coming months.
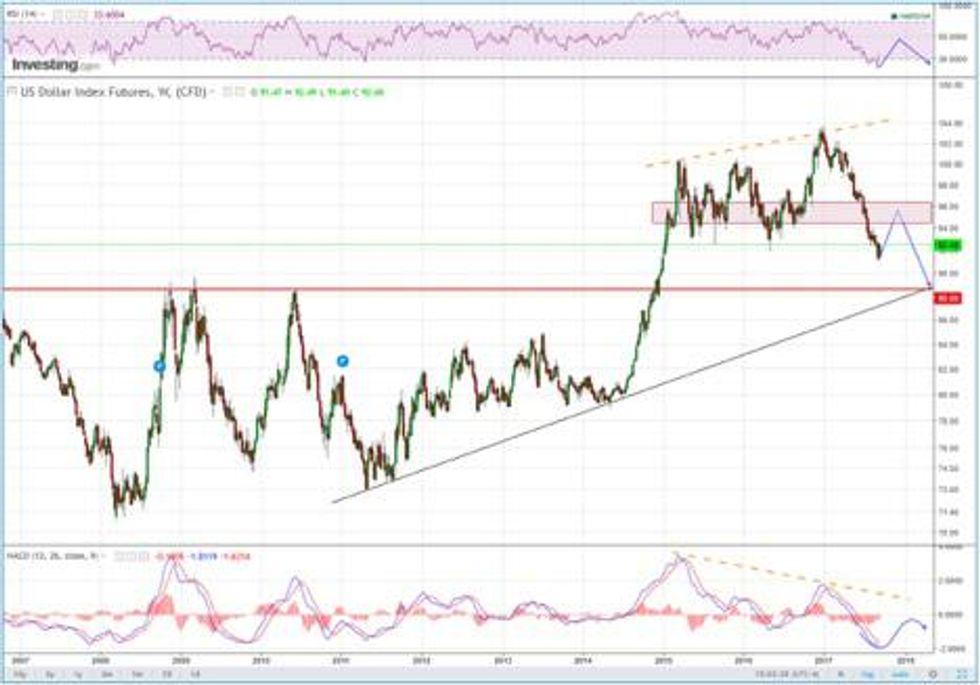
Source: Investing.com, September 13, 2017
The pink box is what is considered a congestion zone, and any rallies into this zone should be met with selling pressure. If this level of resistance can be overcome, it would then be highly probable for the US dollar index to test the previous highs and possibly reach even higher highs, but at this point that is a dubious expectation. A more plausible expectation in my opinion would be for the DX to test support at or near the convergence of the multi-year horizontal (red) and diagonal (black) trendlines. A break of support at this juncture would be VERY significant and would have VERY negative implications for the US dollar. It would be presumptuous to look that far ahead, but the implications should not be discounted.
Conclusion
The US dollar index is oversold on a weekly basis, and the line of least resistance for the time being is upwardly biased. Over the coming months, once the oversold condition is worked through, a test of long-term support would be a logical expectation. Stay tuned for an analysis of the major commodities and their relationship with the US dollar.
Terry Yaremchuk is an Investment Advisor and Futures Trading representative with the Chippingham Financial Group. Terry offers wealth management and commodities trading services. Specific questions regarding a document can be directed to Terry Yaremchuk. Terry can be reached at tyaremchuk@chippingham.com.
This article is not a recommendation or financial advice and is meant for information purposes only. There is inherit risk with all investing and individuals should speak with their financial advisor to determine if any investment is within their own investment objectives and risk tolerance.
All of the information provided is believed to be accurate and reliable; however, the author and Chippingham assumes no responsibility for any error or responsibility for the use of the information provided. The inclusion of links from this site does not imply endorsement.