Intuitively the US dollar should be strong, shouldn’t it? Safe-haven status, an improving economy relative to its peers, petrodollar status … yet the technicals paint a much different picture.
In previous updates I have alluded to the idea that the bull market in the US dollar may be getting long in the tooth, and now it is at a significant inflection point that may validate that premise.
Intuitively the US dollar should be strong, shouldn’t it? Safe-haven status, an improving economy relative to its peers, petrodollar status … yet the technicals paint a much different picture.
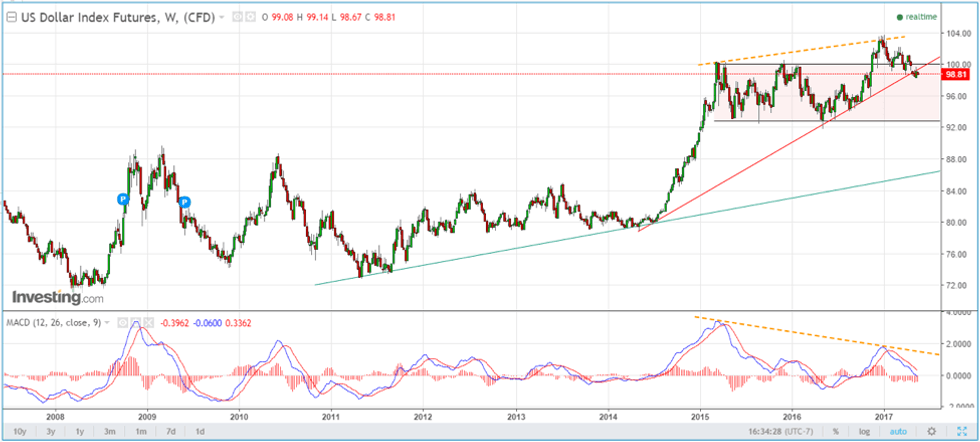
US Dollar Index weekly
Source: Investing.com, May 15, 2017
The most significant indicator that I follow is the relationship between MACD (moving average convergence divergence) and price. The orange dashed lines in the chart above indicate a higher high on price that is coincident with a lower high relative to MACD. This is known as negative divergence and is indicative of trend change. On a weekly chart this is a particularly strong indicator.
The current bull market in the DX (as the US dollar index is colloquially known in the industry) dates back to early 2014, and in the span of less than a year increased in value more than 20 percent relative to its basket of peers, decimating commodities in the process. As most commodities are priced in US dollars, a rise in the DX has had an inverse effect on commodities such as oil, gold, silver and so forth.
In the last two years, the DX has consolidated those gains and has for the most part traded in a sideways channel until the recent US presidential election. Coincident with the election, the DX appeared ready to break out of this sideways pattern and continue on to new heights. It is typical to see consolidation at the mid-point of a bull market with an equally strong second leg to the upside.
This, however, does not appear to be the case. Negative divergence between MACD and price is accompanied by price breaking down through a three-year trend line and is nearly a fait accompli. Even this is still not enough to declare the end of the US dollar bull, but the writing is certainly on the wall. Failure to hold support at the lower end of the channel at 92.5 will most certainly bring the lower trend line into play at sub 90.
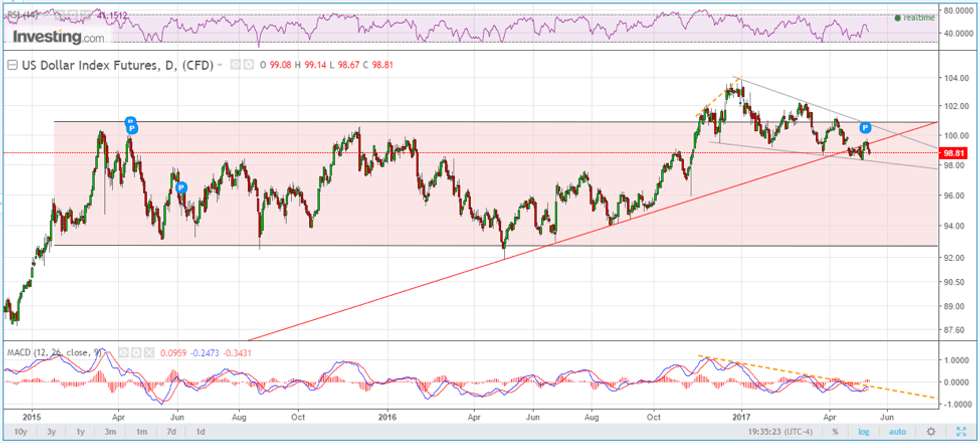
US Dollar Index daily
Source: Investing.com, May 15, 2017
The daily chart paints a similar picture as the weekly with more negative divergence. The break down through the red trend line is much easier to see on the daily as well. The one pattern that still gives me pause, however, is the triangular “flag” that has formed since the election. Should price break out to the upside of this consolidation pattern it will be game on again for the DX. A break down will strengthen the argument that there is further downside for the US dollar, with interim support at 92.5 and major long-term support in the mid to high 80s.
Conclusion
Barring a surprise reversal that sees price appreciate to the upside out of the flag pattern, all indications are that the current US dollar bull has run its course and it’s a sell-the-rallies market going forward. With many commodities maintaining an inverse relationship with the US dollar, it may be time to look for opportunities to take advantage.
Terry Yaremchuk is an Investment Advisor and Futures Trading representative with the Chippingham Financial Group. Terry offers wealth management and commodities trading services. Specific questions regarding a document can be directed to Terry Yaremchuk. Terry can be reached at tyaremchuk@chippingham.com.
This article is not a recommendation or financial advice and is meant for information purposes only. There is inherit risk with all investing and individuals should speak with their financial advisor to determine if any investment is within their own investment objectives and risk tolerance.
All of the information provided is believed to be accurate and reliable; however, the author and Chippingham assumes no responsibility for any error or responsibility for the use of the information provided. The inclusion of links from this site does not imply endorsement.

