
The Conversation (0)
Jan. 25, 2018 01:55PM PST
The weekly and daily US dollar index charts both show the DX to be at an inflection point, suggesting an interim low is at hand.
In January of last year, my analysis of the US dollar index “The Buck Stops Here” drew attention to the negative divergence forming between the DX price and moving average convergence divergence (MACD) on a weekly basis, and the negative implications for the dollar relative to its peers. Since that time, the DX has corrected nearly 15 percent, and is converging on a significant inflection point that is arguably signalling an interim low.
Much like the conditions that coincided with last January’s high-water mark, the current lows on the weekly chart are coincident with oversold relative strength index (RSI) and MACD readings. What is particularly interesting is the similarity brewing now compared to the 2008 low in the US dollar. I am not suggesting that we are about to experience another financial crisis, but simply pointing out the similarities from an oversold perspective as indicated by the pink circles in the following chart.
The oversold readings indicated by RSI and MACD are accompanied by price action that is converging on two support metrics. The pink shaded box is a congestion area of multiple highs and lows for the better part of the last decade, coincident with the burgundy diagonal support line dating back to 2011. Failure to hold support in the 87.5 to 88 range would bring the 80-cent target into play, but given the current oversold nature on a weekly basis, I see this as low probability near term and expect the DX to be rangebound between 88 and 94 for the foreseeable future.
Weekly
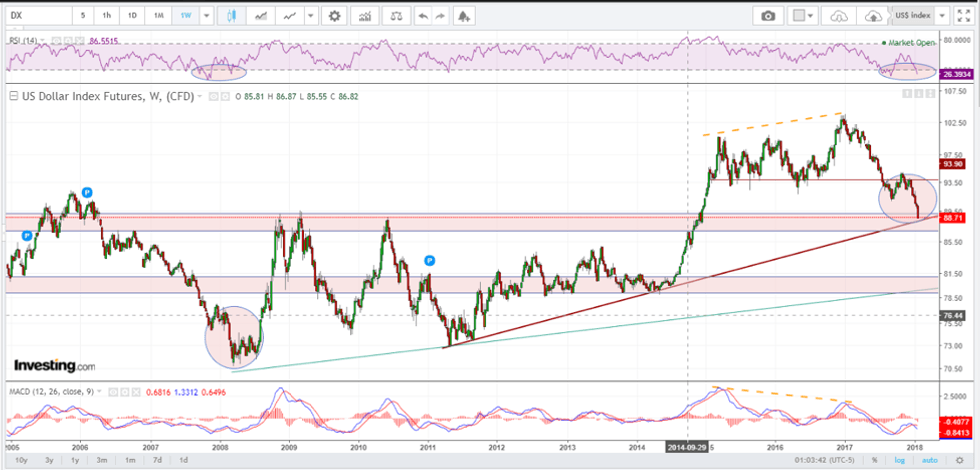
Source: Investing.com, September 24, 2018
The DX looks even more oversold when looked at on a daily basis with emphasis on the extreme oversold RSI reading.
Daily
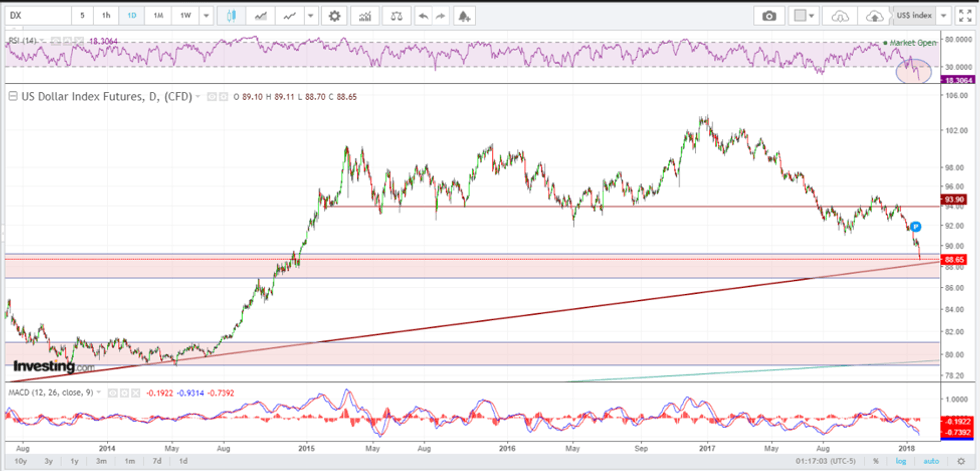
Source: Investing.com, September 24, 2018
Conclusion
The weekly and daily US dollar index charts both show the DX to be at an inflection point, suggesting an interim low is at hand. Barring the unexpected, a rally should be in the cards with a likely ceiling in the vicinity of 94. Given the inverse relationship between the dollar and commodities, this would put the brakes on the recent strength of oil, copper and precious metals for the near term as will be explained in my next series of updates.
Terry Yaremchuk is an Investment Advisor and Futures Trading representative with the Chippingham Financial Group. Terry offers wealth management and commodities trading services. Specific questions regarding a document can be directed to Terry Yaremchuk. Terry can be reached at tyaremchuk@chippingham.com.
This article is not a recommendation or financial advice and is meant for information purposes only. There is inherit risk with all investing and individuals should speak with their financial advisor to determine if any investment is within their own investment objectives and risk tolerance.
All of the information provided is believed to be accurate and reliable; however, the author and Chippingham assumes no responsibility for any error or responsibility for the use of the information provided. The inclusion of links from this site does not imply endorsement.