The Conversation (0)
Oil has been in overbought territory for awhile, and both daily and weekly charts indicate a correction is overdue, says Terry Yaremchuk in this article.
On September 21, 2017 I wrote “Oil Following a Familiar Pattern,” the conclusion of which stated that on all time scales the outlook for oil was bearish. I’ve been pretty accurate in my calls since starting to publish on the Investing News Network, but this one was a slap in the face. Since that time, all the stars came into line for oil: a plunging US dollar, geopolitics, surprise drawdowns and OPEC quotas have all contributed to multi-year highs for oil.
The beauty of technical analysis is the ability to not be married to a fundamental concept on “what should be,” but the ability to adjust to “what is.” There are smarter, deeper pockets out there with better access to information than you and I, so I rely on technicals to show me what the smart money is doing and then “follow the money.”
So what can we expect going forward? The first thing I always look at from a macro perspective is the US dollar. Since most common commodities trade in US dollars, there is generally an inverse relationship between the dollar and commodities prices. Referring back to an article I wrote last week on the US dollar index, I expect we should see some relief in the near term for the dollar, which should have a negative influence on oil prices. What then is the chart indicating?
In the weekly chart, the upper band shows the relative strength index (RSI) to be in overbought territory, highlighted by the shaded circle. This coincides with an oversold reading for the US dollar, which suggests a correction may be overdue. The current price of oil in the mid-$60s is also nearing an area of congestion that should offer upside resistance by virtue of potential hedging.
In the lower band, moving average convergence divergence (MACD) is starting to curl over, which would also be indicative of near-term resistance and a probable pullback. The first area of support is at the psychological $60 area, which coincides with previous upside resistance and congestion, and then the mid-$50s, which looks much more supportive. The $55 level also coincides with the red uptrend line dating back to last summer’s low.
Weekly
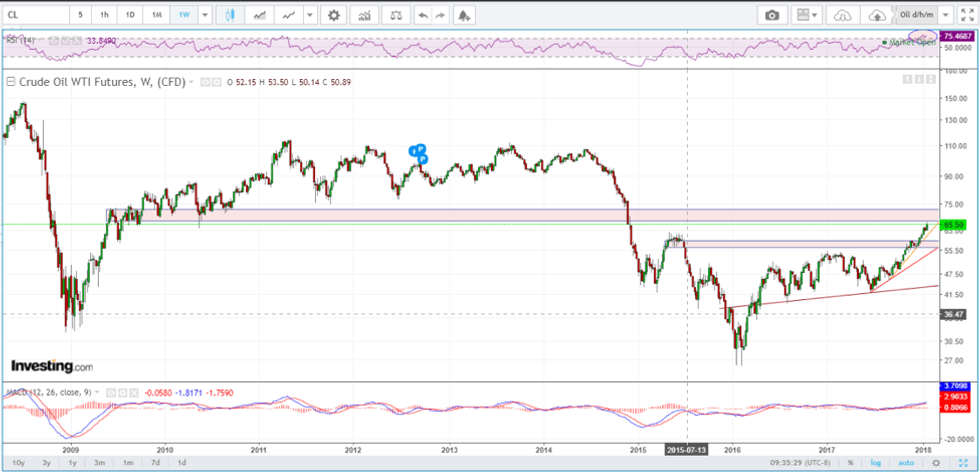
Source: Investing.com, January 29, 2018
The daily chart lines up with what the weekly chart is suggesting. RSI is retreating from overbought territory and looks to head lower, and MACD has already turned over and has put in a little mini negative divergence between it and price.
Daily
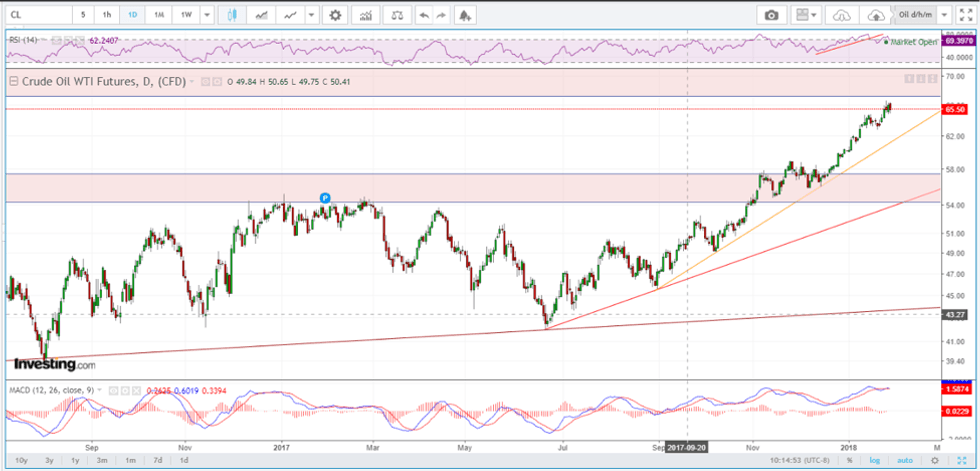
Source: Investing.com, January 29, 2018
Conclusion
Oil has been in overbought territory for awhile, and both the daily and weekly charts indicate a correction is not only overdue, but based on RSI and MACD indicators is already turning negative. In conjunction with a relief rally in the US dollar, it is reasonable to expect oil prices to come under pressure in the near term. The first area of support for oil looks to be in the $58 to $60 range, followed by much stronger support in the mid-$50s.
Terry Yaremchuk is an Investment Advisor and Futures Trading representative with the Chippingham Financial Group. Terry offers wealth management and commodities trading services. Specific questions regarding a document can be directed to Terry Yaremchuk. Terry can be reached at tyaremchuk@chippingham.com.
This article is not a recommendation or financial advice and is meant for information purposes only. There is inherit risk with all investing and individuals should speak with their financial advisor to determine if any investment is within their own investment objectives and risk tolerance.