The Conversation (0)
Hamza / Adobe Stock
Precious metals experienced another wild week of price action, including a notable rally.
The US-Iran war and US President Donald Trump’s rhetoric remain the driving forces behind price action for gold, silver, platinum and palladium. The precious metals continue to move inversely to oil prices and the US dollar.
However, their positive fundamentals have not been lost in the fog of war. Investors may be buying the dips and taking profits on the upside, but the reality of a strong long-term precious metals outlook remains firmly in place. Surprisingly, while all of them posted gains, this week palladium was the best-performing of the asset class.
Let’s take a look at what’s got the precious metals moving over the past week.
Gold price
The gold price has gained more than 6.4 percent over the past week, but remains down more than 16 percent from the record of US$5,589.38 per ounce that it reached on January 28.
The price of gold experienced a "V-shaped" recovery this week as the market shifted from a liquidation-driven selloff to a rally fueled by geopolitical de-escalation. However, the four day rally quickly reversed on Thursday (April 2) following Trump’s televised address on Wednesday (April 1) night in which he vowed to strike Iran "extremely hard" over the coming weeks. Any expectations of a quick de-escalation evaporated overnight and gold reversed course.
“(T)ensions in the Middle East play a dual role in influencing gold. On one hand, continued military escalation supports safe-haven demand and pushes prices higher. On the other hand, any signs of de-escalation or limited political agreements could trigger downward corrections,” Simon Massabni, head of business development at XS.com, explained in market commentary shared with the Investing News Network (INN).
“This suggests that gold may experience short-term upward waves driven by media sentiment, but any sustained move above current resistance levels would likely require concrete developments confirming ongoing geopolitical risks,” he added. “I believe investors need to closely monitor news flow and avoid relying solely on isolated statements, as these may be temporary and primarily fuel speculative trading without altering the broader market trend.”
On March 26, gold reached an intraday high of US$4,477.55 in morning trade before losing nearly US$100 to close at US$4,378.18. In response to a stronger dollar, traders sold their gold positions to cover margin calls.
However, gold gained ground the next day, with the price overtaking the US$4,500 level to hit a high of US$4,551.49 in morning session; it later closed at US$4,493.79. Commerzbank (ETR:CBK,OTCPL:CRZBF) has upped its 2026 gold forecast from US$4,900 to US$5,000 and is projecting a price of US$5,200 for next year.
On Monday (March 30), gold started the week strong with a fresh rally, posting a high of US$4,578.51 in early morning trade. Although it sank to a low of US$4,493.32 midday, it managed a close above the key US$4,500 level at US$4,511.24. Declining US treasury yields made non-yielding gold more attractive, prompting institutional dip buying.
Gold gained serious ground the following day, surging to a high of US$4,685.58 in midday trade before closing just a bit below at US$4,667.48. The momentum was driven by rumors of a shifting stance from the White House on the timeline for exiting the war in Iran, easing the longer-term inflation outlook brought about by elevated oil prices.
By Wednesday, Trump’s Tuesday (March 31) night declaration that the war would end in two to three weeks lit a fire in the gold market, with the price rising to US$4,792.85 in morning trade before closing at US$4,758.76.
However, the mercurial Trump lived up to his reputation, and on Wednesday night had reverted back to a more aggressive stance on Iran despite reiterating that the war would soon come to an end.
Gold reacted by dropping as low as US$4,583.02 in the early morning trade on Thursday.
By 10:00 a.m. PST on Thursday, gold was back up to US$4,659.50.
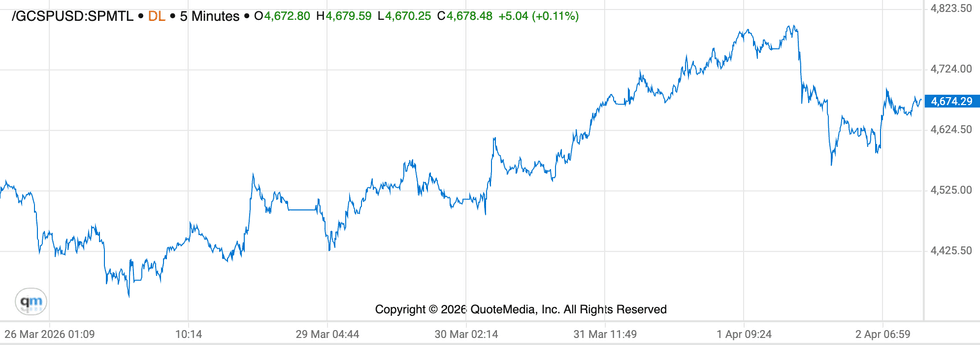
Gold price chart, March 26 to April 2, 2026.
Chart via the Investing News Network.
Here are the primary drivers for gold this past week:
- Trump’s pivot toward a quicker exit from the Iran war eased the pressure of higher-for-longer oil prices, and in turn higher interest rates. However, his reversal in tone the next day led the market back in the other direction. The region-wide conflict in the Middle East has blocked transport through the Strait of Hormuz, an important route for global oil markets.
- Both the dollar and 10 year treasury yields have declined slightly, easing the opportunity cost for holding non-yielding assets like gold and supporting the metal's four day rally.
- Analysts initially grew more confident in the potential for the US Federal Reserve to cut interest rates in the second half of this year and into next year, contributing to upside in the gold price. But that confidence faded once again on Thursday with Trump’s reversal.
For more insight into what’s moving the gold market, check out INN's recent interviews:
- David Nicholas: Gold, Silver — Use This Entry Point as Prices Slide
- Steve Barton: Gold, Silver, Uranium, Oil — Price Targets, Key Levels
In other gold market news, the World Gold Council released its Central Bank Gold Statistics Report for February, showing that central banks bought a net 19 metric tons of gold in February.
Poland was the biggest buyer at 20 metric tons, while Uzbekistan marked its fifth consecutive month of net buying with the purchase of 8 metric tons of the metal.
Silver price
The silver price has gained nearly 6.5 percent over the past week, but is down more than 40 percent from its all-time high of US$121.62 per ounce, which it set on January 29. The precious metal has found solid support from the same factors moving its sister gold, as well as from tighter supply in the face of strong industrial demand.
Silver hit an intraday high of US$69.68 the morning of March 26, then went on to slide as low as US$66.88 later in the session. The white metal managed to close the day at US$67.97.
Like gold, silver lost ground as traders sold positions in the paper market to cover margin calls. The white metal rebounded on March 27 to a high of US$70.35 before sliding to close at US$68.88 as the market stabilized.
On Monday, silver made further gains, reaching an intraday high of US$71.72 in early morning trade before settling to close at US$70.12 as retreating US treasury yields increased the appeal of non-yielding assets.
The following day, silver rallied as the dollar softened on the potential for a near-term ceasefire in the Iran war. The metal hit a high of US$75.35 in the afternoon session before ending the day at US$75.12.
Wednesday saw silver climb to a high of US$76.13 midday and close just slightly above the US$75 level at US$75.09. The same day, China’s 9 percent VAT rebate on solar exports came to an end.
Silver slid to a low of US$69.58 early on Thursday before rebounding to US$72.38 by 10:00 a.m. PST.
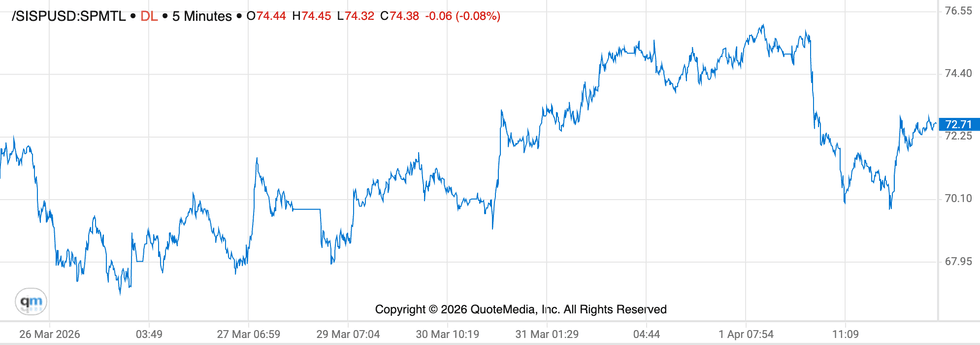
Silver price chart, March 26 to April 2, 2026.
Chart via the Investing News Network.
The structural supply deficit in silver amid strong industrial demand is still a source of firm price support for the metal. Silver is essential in thousands of applications, making it the second most-used commodity after oil.
In silver-mining news, Santacruz Silver Mining (TSXV:SCZ,NASDAQ:SCZM) reported revenues of US$326.4 million, up 15 percent year-on-year, driven by a 36 percent rise in the average realized price of silver.
Platinum price
Platinum continues to outperform gold and silver, with the price up nearly 7.8 percent this past week.
The price of platinum was trading at a low of US$1,817 per ounce midday on March 26, before recovering to US$1,845.50 by closing. On March 27, the precious metal's price was at an intraday low of US$1,807.50 in early morning trade, but rose to a high of US$189.40 before closing lower at US$1,855.
Platinum rose on buy-the-dip trading early on Monday, hitting a high of US$1,937.30 in the session. However, the metal retreated quickly to a low of US$1,978.10 in the afternoon before closing up at US$1,892.90.
The following day, platinum rallied with the other precious metals, starting the day at US$1,906.80, surging to US$1,974 in the afternoon and closing out the day at US$1,966.10. Platinum rose on expectations that a de-escalation in the Middle East would lower energy costs, eventually benefiting the automotive manufacturing sector.
On Wednesday, platinum rose to its highest weekly price of US$1,993.90 in the morning, but sank back down to close at US$1,965.50. The precious metal lost more ground the next day in morning trade, falling to US$1,903.90 before climbing back up to US$1,991.02 by 10:00 a.m. PST.
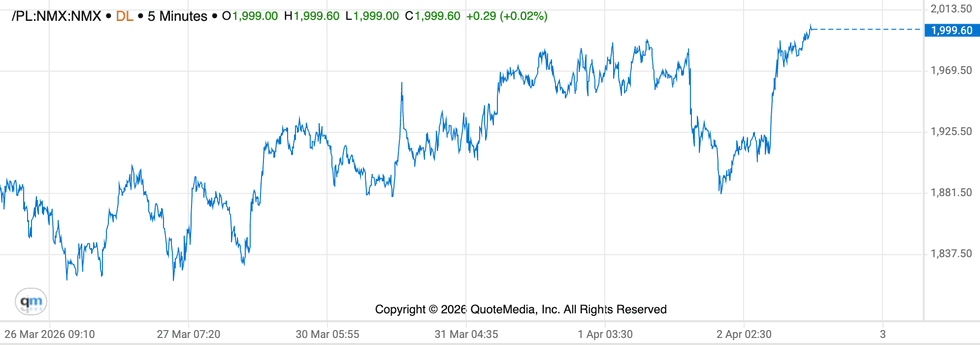
Platinum price chart, March 26 to April 2, 2026.
Chart via the Investing News Network.
Like silver, platinum is responding to market forces as both a precious and an industrial metal.
Tight mine output persists out of South Africa, which accounts for more than 70 percent of global supply. The World Platinum Investment Council is forecasting a fourth consecutive annual deficit for 2026 at a projected 240,000 ounces.
On the demand side, automakers still prefer to use platinum in catalytic converters, anchoring long-term industrial demand. As for investment demand, investors are increasingly viewing platinum as a cheaper alternative to gold, sparking a rotation into platinum exchange-traded funds and physical bullion products.
For more on the supply and demand fundamentals shaping the platinum market, check out: Edward Sterck: Platinum Records Biggest Deficit Ever in 2025, What's Next?
Palladium price
Palladium put up the best price performance of the precious metals this week, gaining 8.9 percent.
On March 26, the palladium price was trading at US$1,385 per ounce in the early morning before falling to US$1,347.50 and rising back up to US$1,388. By midday, it was back down to US$1,348 before closing at US$1,380.
The volatility continued on March 27, with palladium trading at US$1,385 in the early morning before rising to US$1,414. The price of palladium closed back down at a five month low of US$1,376.50.
Palladium had a much better day on Monday, rising off of five month lows to US$1,449 in the morning session, but closed down at US$1,411.50. On Tuesday, palladium really picked up the pace of its gains, starting the day at US$1,451.50. By the afternoon, the price of palladium was trading as high as US$1,497.50; it went on to close down slightly lower at US$1,492. The market has begun to price in the possibility of anti-dumping duties on Russian palladium, set to be resolved by mid-2026. The decision could have an effect on the US supply/demand balance.
The following day, palladium rose to an intraday high of US$1,519 before closing at US$1,481.50 later in the trading session. However, the metal mustered up another close of US$1,439.
The price of palladium was trading as low as US$1,446 early on Thursday morning before retracing upward to US$1,503.10 as of 10:00 a.m. PST.
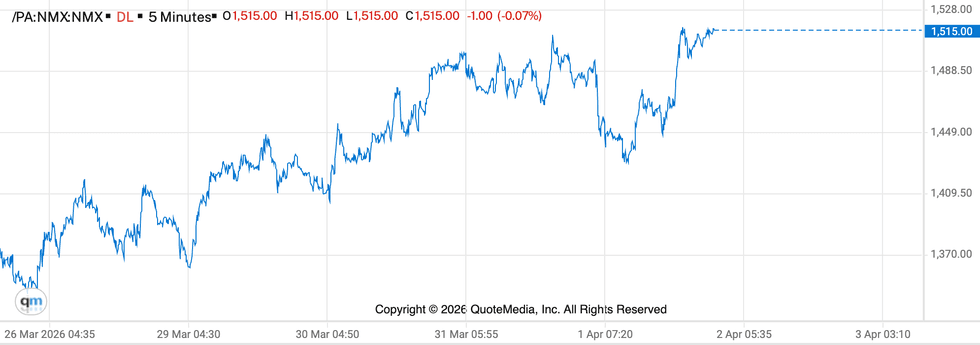
Palladium price chart, March 26 to April 2, 2026.
Chart via the Investing News Network.
On top of the factors driving the precious metals, palladium also found further support from high industrial demand.
“Russia’s Nornickel, the world’s largest palladium producer, highlighted rising industrial demand beyond the automotive sector,” reports Trading Economics. “The company is investing US$100 million to cultivate new palladium markets and aims to generate approximately 1.7 million troy ounces of annual demand by 2030, including near-term applications in electrochemistry for anodes and water treatment.”
Don't forget to follow us @INN_Resource for real-time updates!
Securities Disclosure: I, Melissa Pistilli, hold no direct investment interest in any company mentioned in this article.
Editorial Disclosure: The Investing News Network does not guarantee the accuracy or thoroughness of the information reported in the interviews it conducts. The opinions expressed in these interviews do not reflect the opinions of the Investing News Network and do not constitute investment advice. All readers are encouraged to perform their own due diligence.
From Your Site Articles
- Gold’s Next Test: WGC Lists 3 Potential Price Scenarios in 2026 Outlook ›
- Gold Price Forecast: Top Trends for Gold in 2026 ›
- Gold Price 2025 Year-End Review ›
- Silver Price Forecast: Top Trends for Silver in 2026 ›
- Silver Price 2025 Year-End Review ›
Related Articles Around the Web
- 2026 Gold Outlook: Analysing the Macro Forces Driving the Path to $6,000 ›
- Gold Outlook 2026: Push ahead or pull back | World Gold Council ›
- Every major analyst's gold price forecast for 2026 - Yahoo Finance ›
- Gold price predictions from J.P. Morgan Global Research ›
- Why Gold's Rally Is Likely to Go On - Morgan Stanley ›
https://twitter.com/INN_Resource
https://www.linkedin.com/in/melissa-pistilli-865271a9/
mpistilli@investingnews.com