The Conversation (0)

vldkont / Shutterstock
Copper has had a volatile few years; however, amid various ups and downs, prices for the red metal hit an all-time high on May 20, 2024, trading at US$5.20 per pound on the COMEX.
Interestingly, by looking backwards it’s easy to see that this spike was an expected feature of the long-term picture for copper prices. The red metal has rebounded after a downtrend from about 2011 to 2015, and over the last few decades prices have increased even more dramatically.
Case in point — at the time of its new high in May 2024, the copper price has increased over 500 percent since January 2000. Although this impressive major increase doesn't account for inflation, it's still a sizeable gain. Let's take a deeper dive into copper prices going back even further.
In this article
What factors have impacted copper prices historically?
So what’s the best way to view historical copper prices? According to Stefan Ioannou of Cormark Securities, it’s most pragmatic to look at historical copper prices since the 1970s or 1980s.
That’s because of the rise of modern heap-leach technology. Leaching has long been used in mining operations, but the method in its modern form didn’t start gaining popularity until around 1980.
“That fundamentally changed the way we mine copper,” Ioannou explained. “Up until then, a lot of copper mining was for the most part focused on sulfide mineralization producing a copper concentrate that you’d send to a smelter. With heap-leach technology, all of a sudden the giant porphyries (and) the oxidized caps associated with large porphyries down in South America became viable.”
That sounds like good news for increasing copper supply, but as Ioannou noted, large-scale deposits are often low grade, meaning that they’re more costly to mine despite relatively cheap heap-leaching methods.
While Ioannou said supply and demand dynamics are the main driver for prices, grade and production costs are factors as well. Demand for copper keeps growing, and he suggested that since “the low-hanging fruit has been mined,” miners must increasingly go after more difficult, large, low-grade and costly deposits.
“The price of copper dictates how low you can go on the grade,” he said. “Back pre-1970s, I’m guessing a lot of copper was coming from a lot higher-grade mines … as we’ve been mining more and more of these large-scale deposits that are low grade, the cost on a per-pound basis has gone up.”
What else has driven historical copper prices?
Interestingly, some take another view on the historical performance of the copper price.
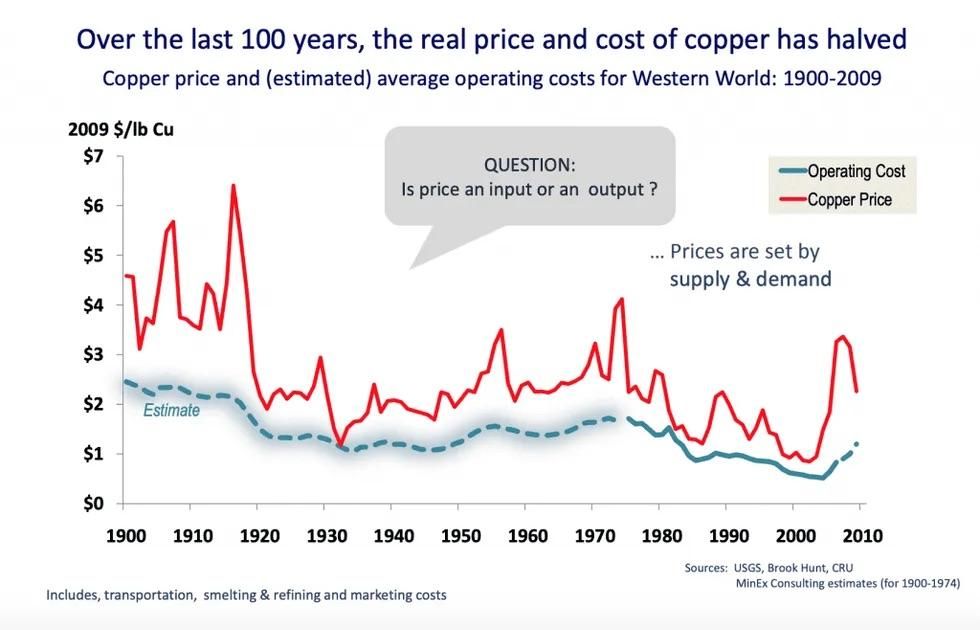
Richard Schodde, managing director at MinEx Consulting, gave a presentation on the subject back in 2010 that looks at a longer timeframe — 110 years, to be exact.
On that scale, historical copper prices have dropped significantly since the 1910s. In 2015, Schodde told the Investing News Network by email that real copper prices had dropped about 50 percent since 1910, and that production costs have also fallen due to economies of scale and advances in mining and processing technologies.
That might not sound like good news for copper, but Schodde viewed the drop as good overall. He thinks the industry will continue to innovate in order to exploit lower-grade deposits and meet growing global demand.
Plus, it’s worth considering where you get in. Looking at the graph below from Schodde, it wouldn’t be ideal if you invested in copper back in the 1910s. It all comes down to strategy, timing and, frankly, a bit of luck.
How does supply and demand shape copper prices?
Many supply and demand factors have contributed to the movement of historical copper prices over the years. For example, a report from the US Geological Survey notes that the Vietnam War meant strong demand in the mid-1960s and early 1970s, leading to price controls to limit domestic copper prices.
Much later, in July 1998, prices “had fallen to their lowest level since the Great Depression,” while an earlier production boom in the 1980s led prices to fall on the back of resulting oversupply.
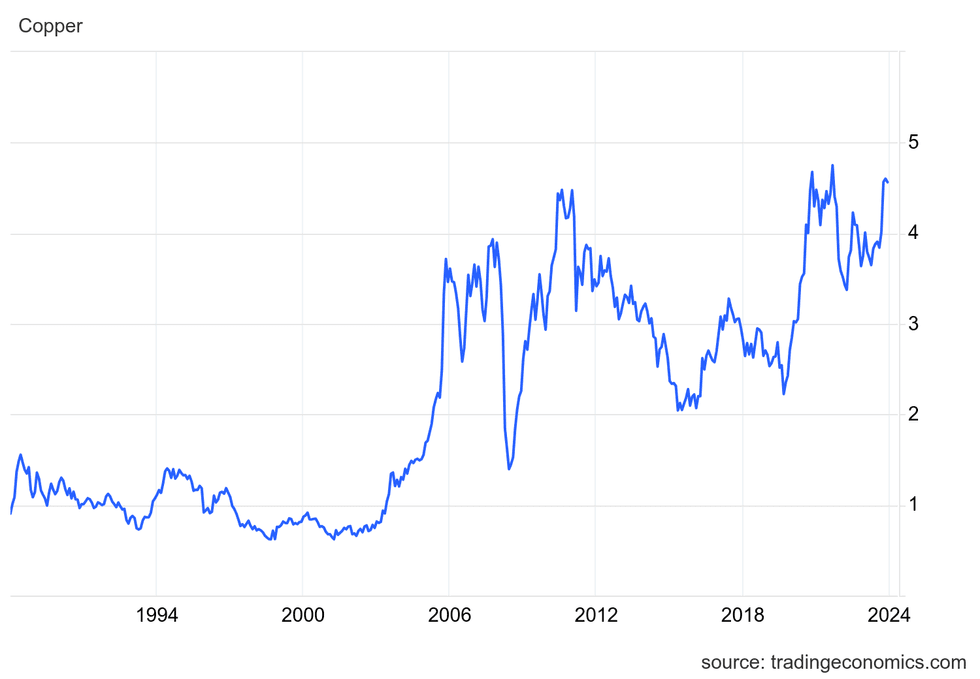
Historical copper prices from July 1988 to June 2024.
Global demand for copper is currently dominated by China, and those following the resource market will no doubt remember a large spike in Chinese demand that sent prices for copper and other commodities soaring in recent years. China is still a strong copper demand driver, with the most recent data showing that it was the largest consumer of refined copper at an estimated 6.75 million metric tons in 2023.
Macroeconomic volatility has impacted the Asian nation’s copper demand, and it’s tough to say what’s going to happen moving forward. Analysts have noted that the country’s infrastructure and property sectors, both of which require large amounts of copper and other commodities, are also showing signs of weakness.
On the supply side, a report from the World Bureau of Metal Statistics showed that as of April 2024, the global refined copper supply shortage came in at 120,900 MT, due in large part to declining copper mine production from Anglo American (LSE:AAL,OTCQX:AAUKF). The closure of First Quantum Minerals' (TSX:FM,OTC Pink:FQVLF) Cobre Panama mine and declining production at Chile’s Chuquicamata mine are also impacting copper mine supply at present.
What’s next for copper?
In the short term, copper price volatility is still in the cards due to market uncertainties, including prolonged supply chain challenges, sticky inflation and the threat of recession in the global economy.
However, some analysts are quite optimistic looking longer term. Goldman Sachs (NYSE:GS) has expressed confidence that copper’s long-term fundamentals remain strong with a clear structural bull story. The firm sees copper prices reaching US$15,000 per metric ton (or US$6.80 per pound) by 2025.
This is an updated version of an article originally published by the Investing News Network in 2015.
Don’t forget to follow us @INN_Resource for more updates!
Securities Disclosure: I, Melissa Pistilli, hold no direct investment interest in any company mentioned in this article.
Editorial Disclosure: The Investing News Network does not guarantee the accuracy or thoroughness of the information reported in the interviews it conducts. The opinions expressed in these interviews do not reflect the opinions of the Investing News Network and do not constitute investment advice. All readers are encouraged to perform their own due diligence.
From Your Site Articles
- LME Copper vs. COMEX Copper ›
- Copper Price Update: Q2 2025 in Review ›
- What Factors Affect Copper Supply and Demand? (Updated 2024) ›
- What Was the Highest Price for Copper? ›
- Is the World Running Out of Copper? ›
Related Articles Around the Web
https://twitter.com/INN_Resource
https://www.linkedin.com/in/melissa-pistilli-865271a9/
mpistilli@investingnews.com