The Conversation (0)
Nov. 30, 2017 04:35PM PST
A look back at the main copper trends of 2017, from supply and demand dynamics to price performance over each quarter of the year.
Copper prices have surged more than 22 percent in 2017 on the back of a strong demand outlook, supply disruptions and speculation from investors.
In fact, the red metal broke the $7,000 per-tonne-mark in October and has been trading near that level since then.
As the year comes to a close, the Investing News Network is looking back at key copper trends this year, from mine disruptions to surging stockpiles.
Read on to learn what happened in the copper market in 2017, from the main supply and demand dynamics to how analysts thought the metal performed in each quarter of the year.
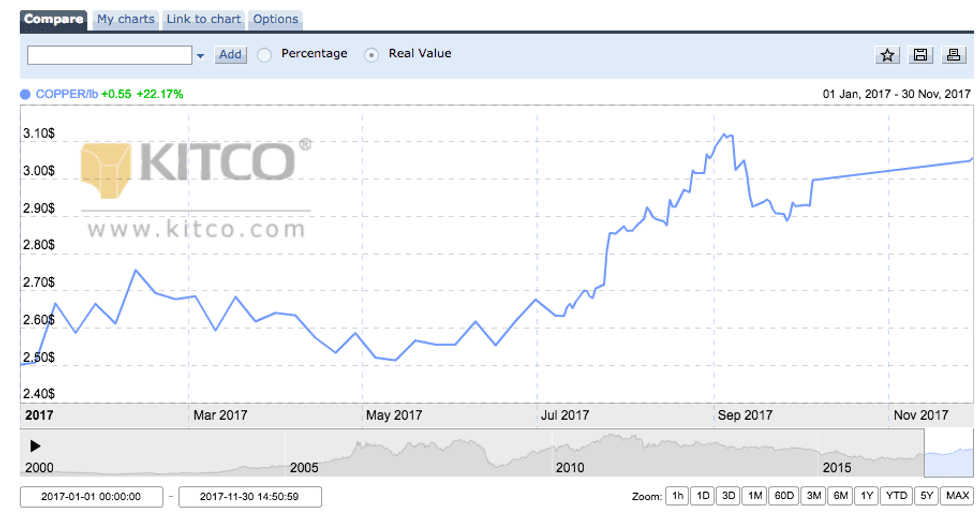
Copper’s price performance from January 1, 2017 to November 30, 2017. Chart via Kitco.
Copper trends Q1: Mine disruptions and labor negotiations
Copper prices saw a modest uptick in the first quarter of the year, gaining more than 7 percent in Q1. During the period, supply concerns, as well uncertainty about US President Donald Trump, were the metal’s main price drivers.
In terms of supply, all eyes were on copper mine disruptions. Chile’s Escondida, the world’s largest copper mine, faced a 43-day strike, the longest stoppage in its history, due to labor negotiations between union workers and BHP Billiton (NYSE:BHP,LSE:BLT,ASX:BHP) management.
In addition, Freeport-McMoRan’s (NYSE:FCX) Indonesia-based Grasberg mine, the second-largest copper mine in the world, stopped production for over a month due to a smelter strike and issues surrounding the renewal of the company’s mining permit.
These supply disruptions were estimated to reduce global copper output by 5 to 7 percent, but bearish demand levels and an increase in stockpiles limited copper price gains. In the first three months of 2017, inventories of copper in exchange-monitored warehouses rose more than 40 percent, hitting their highest levels since 2013.
In Q1, analysts were cautious about the demand outlook from top-consumer China, as the economy from the Asian country was expected to slow down during the year. The red metal traded in a range of $5,000 to $5,760 during the quarter.
Copper trends Q2: Demand worries increase
The copper price stalled in the second quarter, ending the period almost neutral after being hurt by worries about global demand. That said, supply concerns continued during the quarter, and together with a weaker dollar helped drive the copper price.
Strikes at copper mines made news headlines again in the second quarter. In May, thousands of workers at Grasberg in Indonesia decided to go on strike after Freeport laid off almost 10 percent of its workforce. Workers at the Zaldivar copper mine in Chile also voted to strike after labor negotiations with owners Antofagasta (LSE:ANTO) and Barrick Gold (TSX:ABX,NYSE:ABX) failed.
In terms of demand, LME inventories continued to rise, although warehouse stocks had been performing with volatility since January. Several analysts also called for weaker demand in China during the second half of the year, as the government looked to tighten financial conditions. Copper traded between $5,500 and $5,940 during the quarter.
Copper trends Q3: Speculation boosts prices
The copper price rose more than 9 percent in Q3, trading near the $7,000 mark. A strong demand outlook from China, a weaker US dollar and speculation from investors boosted prices.
Many analysts warned at the time that the price rally was “overhyped,” and would run out of steam as it wasn’t based on fundamentals. Prices did ultimately pull back at the end of the quarter, as the dollar rebounded and warehouse stocks increased again.
During Q3, supply worries eased as top copper producer Chile reported higher output in July and Freeport said it would continue to export copper while negotiating a new permit with Indonesia.
In terms of demand, all eyes were on China, as demand from the Asian country slightly outpaced expectations; however, worries that the property sector in China was cooling down due to ongoing tightening measures had many analysts concerned about even weaker demand going forward.
Demand from other countries was also flat, with some markets becoming saturated, according to analysts. The red metal traded in the range of $5,780 to $6,970 during the period.
Copper trends Q4: Prices jump above $7,000
The last quarter of the year saw copper prices break past $7,000, touching a more than three-year high, on the back of positive Chinese data and a weaker US dollar. As of November 30, the red metal had traded in between $6,450 and $7,177 during the quarter.
During Q4, Chinese economic data showed growth in the country, but efforts to cut risks in property and debt started to weigh on prospects for the base metal. That said, analysts and market participants remain bullish on copper moving forward.
“The overall mood is relatively bullish. From a global perspective, slowing investment in copper mines will lead to tight concentrate supply over the next two years. And in China, we don’t see any clear bearish trend for downstream demand in our model,” Adam Fan, CEO of consultancy Shanghai Metal Market, recently said.
This is an updated version of an article first published by the Investing News Network in 2016. Click here to read the 2016 version of the article.
Don’t forget to follow us @INN_Resource for real-time news updates.
Securities Disclosure: I, Priscila Barrera, hold no direct investment interest in any company mentioned in this article.