Were you bullish on oil a year ago–and are now shocked that oil is barely $50/barrel? You aren’t the only one. This wasn’t supposed to have been possible. An oil price crash…ok. To crash and stay this low for two years….no way.
By Keith Schaefer
Were you bullish on oil a year ago–and are now shocked that oil is barely $50/barrel?
You aren’t the only one.
This wasn’t supposed to have been possible.
An oil price crash…ok.
To crash and stay this low for two years….no way.
After reading the just released July 2016 EIA Short Term Energy Outlook (STEO) I went back and compared it to the same report from July 2015.
What I found was yet another reminder of why I have zero faith in the ability of anyone (including me) to predict where oil prices are going.
Comparing the July 2015 STEO with what has actually come to pass provides a very clear explanation as to why 365 days later oil has barely cracked $50 per barrel.
One Year Later – Russian and OPEC Production
It was easy in July 2015 to draft a compelling case for why oil prices would be a lot higher 365 days into the future.
We all know that virtually every onshore oil play can’t deliver a sufficient return on investment at these prices. U.S. drilling should have and actually did collapse.
U.S. production responded. Daily oil production in the U.S. peaked at 9.6 million barrels in the spring of 2015 and has now fallen to 8.4 million barrels per day according to the EIA.
So what happened? How can oil prices still be so low with U.S. production dropping this much?
I dug deep into the data that underpinned the EIA STEO reports for July of this year and last. What I found was that a year ago the EIA had greatly underestimated how much oil Russia and OPEC would be producing today.
Let’s start with Russia where production should be falling apart after two years of low oil revenues.
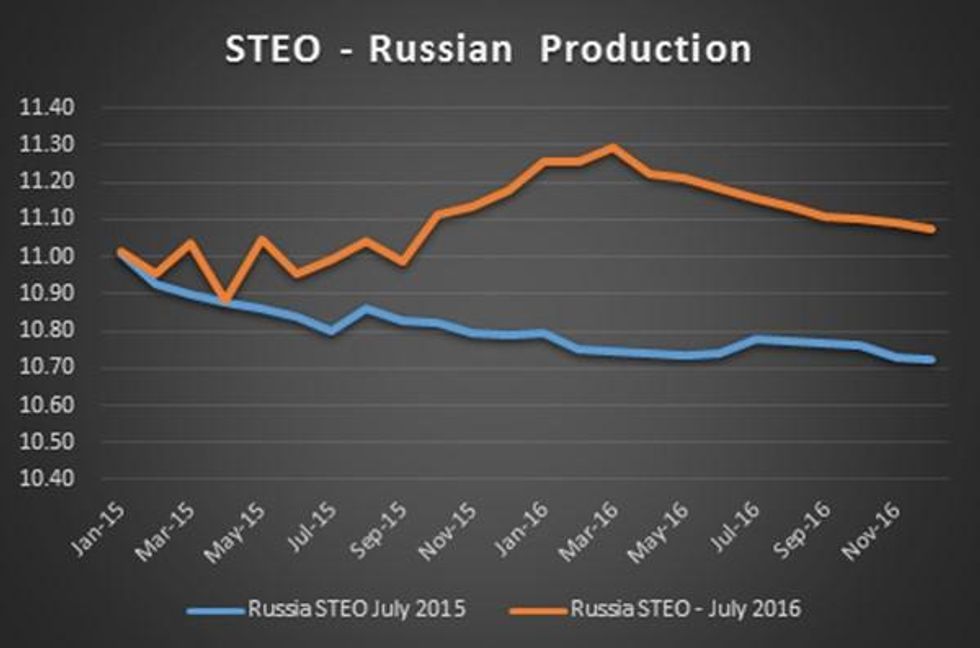
The chart below compares what the EIA predicted (as of July 2015) Russia would produce on a monthly basis from January 2015 through the end of 2016. Note that there are differences in the months prior to July 2015 due to revisions to historical production data.
There is a big gap between what Russia was expected to do and what it has actually done.
First half 2016 production has exceeded the EIA’s estimate by nearly 500,000 barrels per day.
That is A Big Variance.
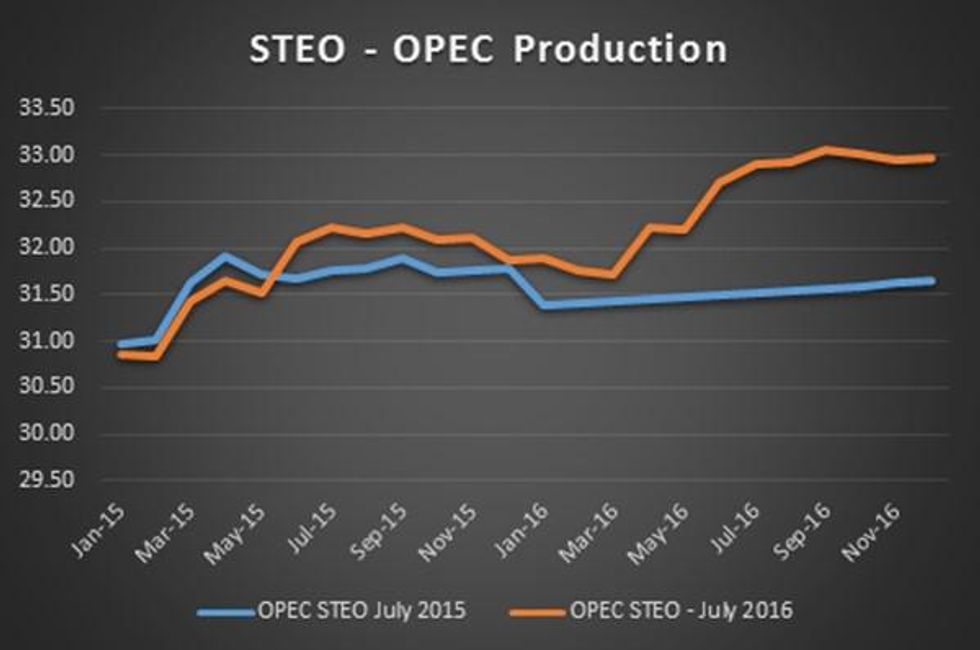
The EIA underestimated OPEC production by an even wider margin.
When the July 2015 STEO was written, Indonesia was not part of OPEC. I’ve adjusted the July 2015 figures to include Indonesia.
As of June 2016 OPEC production was exceeding what was estimated in the July 2015 STEO by a whopping 1.2 million barrels per day. Iran, Iraq and Saudi Arabia have all exceeded expectations.
To put this in context consider that OPEC has exceeded the EIAs projection by an amount equal to the entire production from the Bakken shale.
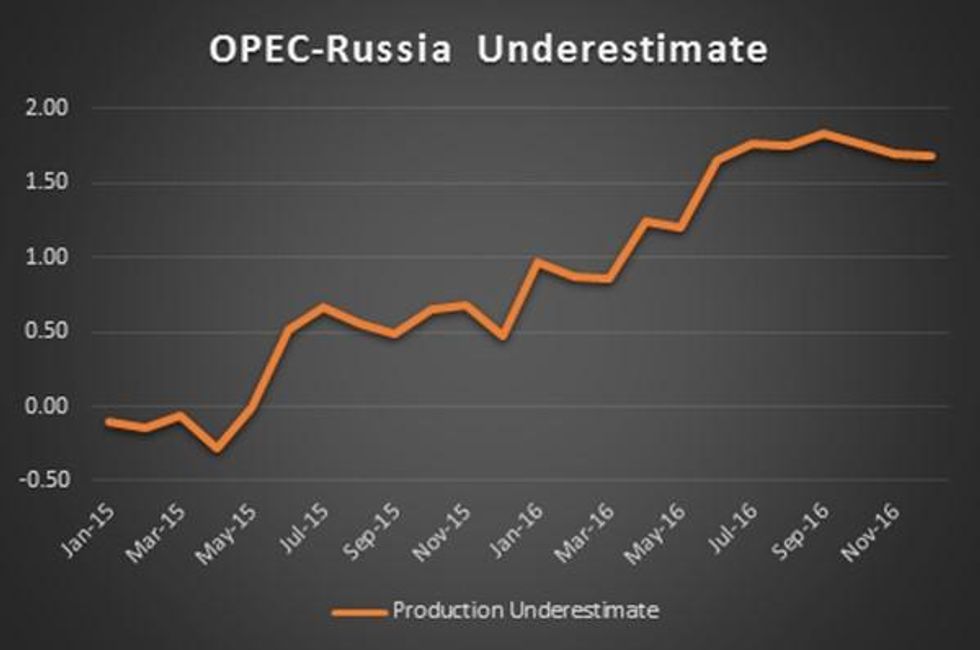
Putting them both together, Russia and OPEC are exceeding the July 2015 STEO by 1.7 million barrels per day as of June 2016.
Those with a bullish view on oil have some very valid points to make. Global oil demand continues to move higher.
Onshore production in the United States has taken a hammering. Exploration budgets everywhere have been decimated.
But when you realize OPEC and Russia have exceeded the EIA’s estimates by 1.7 million barrels per day–it’s easy to understand the problem.
The production surprises from OPEC and Russia are clearly the wet blanket on the oil bull party. Production from these countries hasn’t been slightly more than expected. It is a massive amount of oil and THE reason that the much anticipated oil recovery has yet to happen.
Whether it is rational for OPEC and Russia to continue to produce so much oil into these prices is irrelevant. All that matters is that they are doing it.
Once again many investors get a very real lesson on the difficulties of predicting oil prices.
How Then Does One Make Money Despite Of This…
Despite all this bad news, there is a Bright Light in the North American oilpatch. It’s the Permian Basin of southwest Texas–where a steady improvement in fracking techniques have doubled flow rates in some areas of the play–up to 3000 boepd!
That is giving companies a very fast payout on their wells, even at $45 oil. These stocks are starting to move–and there are four Best of Breed Permian juniors that I believe are THE stocks to own for the next 12 months.
These stocks can grow production quickly, without debt and without new equity–even at these low oil prices.
This article was originally posted on Oil and Gas Investments Bulletin on August 24, 2016.


