The Conversation (0)
Sep. 21, 2017 01:55PM PST
From a technical perspective the bias is bearish against oil on all timescales, says Terry Yaremchuk of Chippingham Financial Group.
Since recovering from a massive selloff to the mid-US$20 range in early 2016, WTI has traded in an upwardly sloping band that ranges from the low US$40s to the high US$50s. Within that trading range a very evident pattern has established itself, as indicated by the cyclical markers shown in the daily chart below. Concurrent with the highs and lows are overbought/sold readings within RSI (relative strength) and cyclical peaks and troughs on the MACD (moving average convergence divergence) scale.
Of particular note is the coiling action that is developing with MACD. The peaks and valleys are triangulating into tighter and tighter lows and highs. While this action can’t predict which direction prices are ultimately headed, this type of coiling action typically precedes significant moves.
WTI — daily
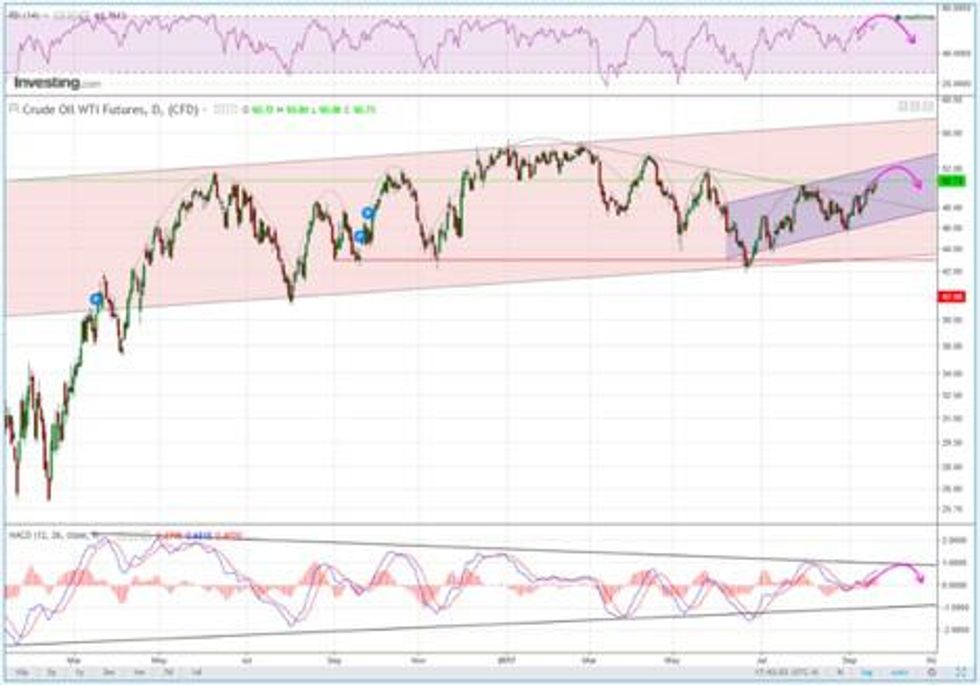
Source: Investing.com, September 21, 2017
For the near term, RSI is nearing overbought status and MACD is approaching the upper bound of that triangulation zone. Extrapolating the pattern, it would suggest that US$52 or below is an inflection point and by extension we could see a short-term pullback to near US$48.
The longer-term picture is a little more ominous when analyzing the weekly and monthly charts, as I will explain below.
WTI — weekly
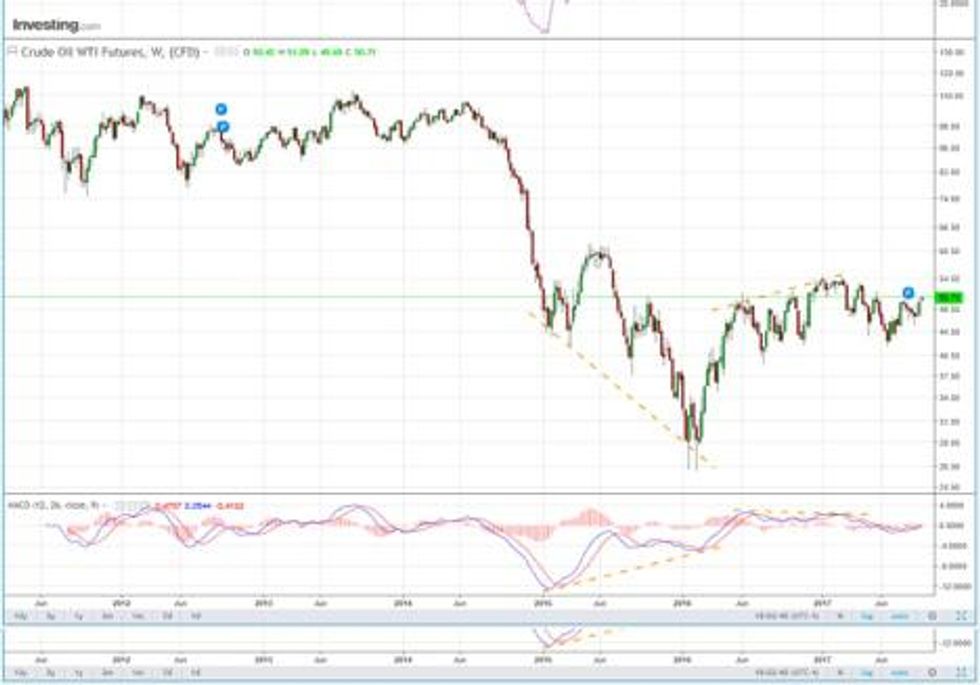
Source: Investing.com, September 21, 2017
One of the indicators that I pay the most attention to is MACD. A divergence occurs when there is a disconnect between price and MACD as indicated by the orange dashed lines. A positive divergence occurred during 2015, where higher lows of MACD were coincident with lower lows of price. This is a very good indicator that sellers are becoming exhausted and that a trend change is happening. It is especially significant when this happens on a longer timescale as it has on the weekly chart. The bad news for oil bulls is that a negative divergence established itself during 2016 and could be signaling that all is not warm and fuzzy in the oil patch.
WTI — monthly
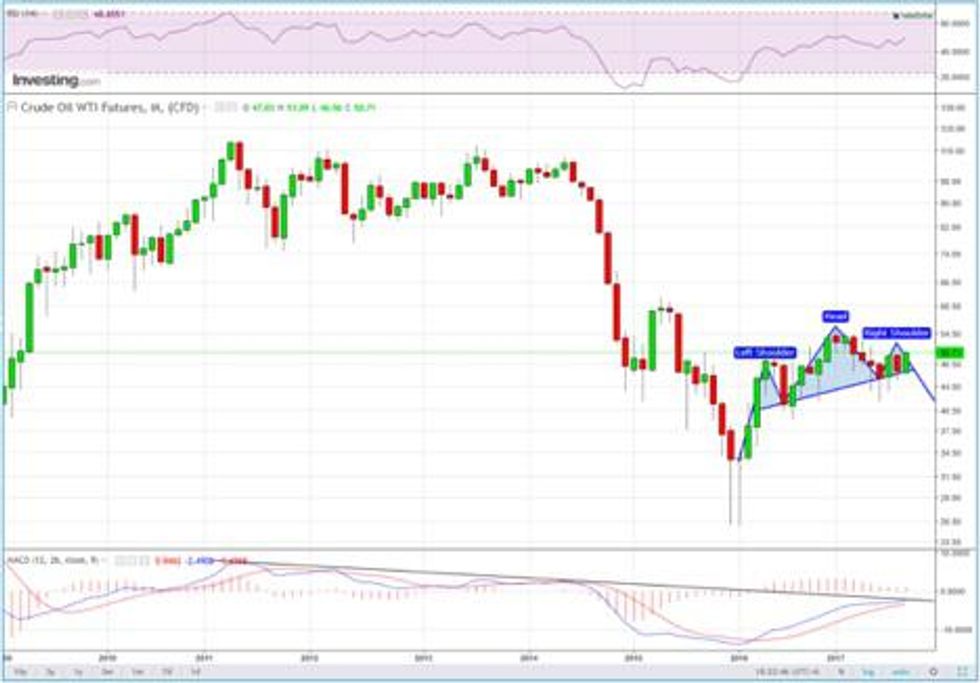
Source: Investing.com, September 21, 2017
MACD is flattening and threatening to roll over on the monthly as well, which is also suggestive of lower prices. One could also make the case that a head-and-shoulders pattern is developing on the monthly, and if the neckline were to be breached a measured move target for oil would be in the mid-US$30s. This is a slow-moving train, so it will be sometime next year or beyond until we are likely to see this scenario.
Conclusion
On all timescales, from a technical perspective the bias is bearish.
Terry Yaremchuk is an Investment Advisor and Futures Trading representative with the Chippingham Financial Group. Terry offers wealth management and commodities trading services. Specific questions regarding a document can be directed to Terry Yaremchuk. Terry can be reached at tyaremchuk@chippingham.com.
This article is not a recommendation or financial advice and is meant for information purposes only. There is inherit risk with all investing and individuals should speak with their financial advisor to determine if any investment is within their own investment objectives and risk tolerance.
All of the information provided is believed to be accurate and reliable; however, the author and Chippingham assumes no responsibility for any error or responsibility for the use of the information provided. The inclusion of links from this site does not imply endorsement.