The US Energy Information Association released its Annual Energy Outlook for 2015 (AEO2015), which includes projections up to the year 2040. When it comes to natural gas, the association predicts the US will shift from net importer to net exporter status by 2017.
The US Energy Information Association (EIA) released its Annual Energy Outlook for 2015 (AEO2015), which includes projections up to the year 2040. When it comes to natural gas, the association predicts the US will shift from net importer to net exporter status by 2017.
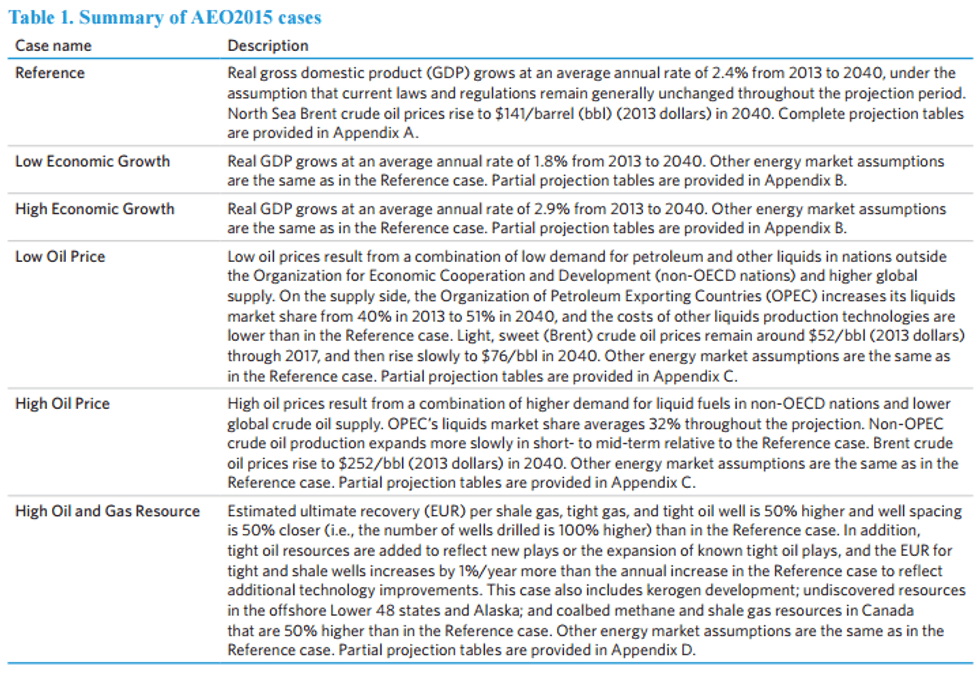
The EIA evaluated a range of trends and issues that could have major implications for the US energy markets. Considering the uncertainties in any energy market projection, the EIA included a main reference case and five alternative cases, all of which are defined in the chart below:
While the reference case is the association’s best prediction, it suggests that case should not be viewed in isolation. EIA encourages readers to “review all cases to gain perspective on how variations in key assumptions can lead to different outlooks for energy markets.”
For the sake of brevity, Gas Investing News focused on the reference case, taking a look at the key points surrounding the natural gas price forecast as well as the production, supply and demand forecasts.
Natural gas price predictions
The EIA used Henry Hub natural gas spot prices for its price predictions. Those vary according to the availability of domestically produced resources, overseas demand for US liquefied natural gas and trends in domestic consumption, according to the EIA. Using the reference case from the report, the Henry Hub spot price is set at $4.88 per million British thermal units (Btu) in 2020, rising to $7.85 per million Btu in 2040.
“[I]ncreased demand in domestic and international markets requires an increased number of well completions to achieve higher levels of production,” the report explained. “In addition, lower cost resources generally are expected to be produced earlier, with more expensive production occurring later in the projection period.”
The price of natural gas delivered to residential and commercial sectors is set to increase from 2013 to 2040 in all cases outlined in the report, with commercial natural gas consumption going up due to factors such as growth in aggregate commercial square footage.
On the other hand, the report notes that consumption on the residential side of things is expected to decrease in spite of economic growth, because of population shifts to warmer areas, increasingly efficient home appliances and an increased use of electric home heating systems.
Natural gas production
Looking at changes in output, the report notes that total dry natural gas production in the US increased by 35 percent between 2005 and 2013, which was likely due to the natural gas share of total US energy consumption rising from 23 percent to 28 percent. That growth in production was largely a result of the development of shale gas resources in the lower 48 states, which the report noted “more than offset declines in other Lower 48 onshore production.”
According to the reference case, more than half of the total increase in the shale gas production comes from the Haynesville and Marcellus formations. Haynesville is located under southwestern Arkansas, northwest Louisiana, East Texas and Marcellus is located in the Appalachian Basinwhich extends through New York, Pennsylvania, Ohio, West Virginia and a number of other eastern states.
Overall, shale gas production – which includes natural gas from tight oil formations in the lower 48 states – increases by 73 percent in the reference case between 2013 and 2040.
Natural gas imports and exports
Overall, the EIA sees net natural gas imports continuing to drop through 2040, regardless of differing variables from the six cases considered in the report. The association noted that net natural gas exports have been on the decline since 2007. In fact, the report sees the US shifting to become a net exporter of natural gas in 2017, with that change largely being driven by increased pipeline exports to Mexico and a reduction in imports from Canada.
In the reference case, new exports from the US are set to total 5.6 trillion cubic feet (Tcf) in 2040, with most net export growth occurring before the year 2030; that’s when gross LNG exports are expected to reach their highest level at 3.4 Tcf. The report also sees lower levels of net pipeline imports from Canada, with net pipeline exports to Mexico growing from 0.7 Tcf in 2013 to 3 Tcf in 2040.
Overall, the price of LNG supplied to international markets is significantly higher than the price of US domestic natural gas supply in the near term. “The growth in US LNG exports is driven by this price difference, which also discourages US LNG imports,” the EIA explained.
As a final note, when it comes to Canada, the report expects the country to continue as the source of nearly all US pipeline imports through 2040. Canada accounted for 97 percent of total US pipeline imports of natural gas in 2013
Securities Disclosure: I, Kristen Moran, hold no direct investment interest in any company mentioned in this article.
Related reading:


