A strong US dollar may pressure gold in the near term, but as long as prices hold above support a buying opportunity may present itself.
Markets generally follow a cycle: the bond market peaks, then the stock market peaks, then the commodities peak and the cycle starts anew. The bond market put in a high in 2016, the stock markets are correcting from parabolic record highs and commodities are starting to come alive.
They don’t ring a bell at the top, and it’s more of a transitional process while the smart money repositions. Armed with that knowledge, there are indications that we are in phase one of a commodities cycle and it’s time to start looking at gold again.
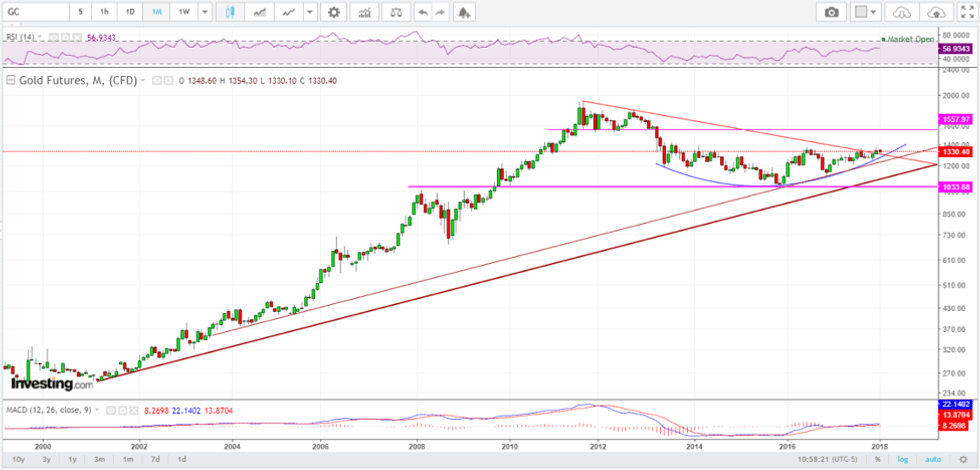
Gold monthly
Source: Investing.com, February 6, 2018
The monthly chart dates back to the year 2000, when the gold bull market first began. Since peaking in 2011, gold has retraced 50 percent of the gain and has been in a consolidation phase ever since. The burgundy uptrend was never violated, and it could be argued that gold is still in a bull market.
Semantics aside, looking at gold from a macro perspective reveals that the downtrend since the peak has recently been penetrated. The blue semicircle indicates a bowl-shaped bottom, which is a very reliable chart pattern, and currently the price of gold is challenging a five-year resistance zone. The coup de gras for the bulls is delineated at $1,400, and a successful breakout points to a resumption of the bull market in gold. Above that, there is resistance at $1,550 and $1,900 — above which is blue sky.
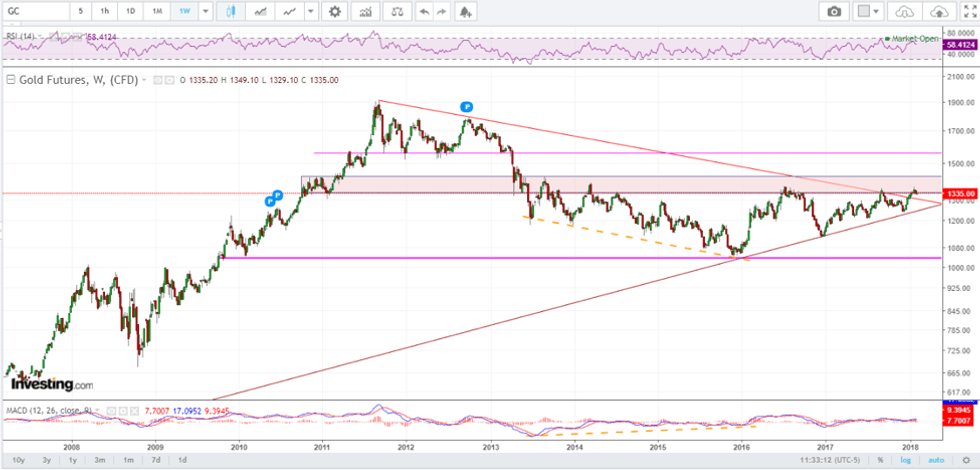
Gold weekly
Source: Investing.com, February 6, 2018
The most significant indicator on the weekly chart that was absent from the monthly is the orange dashed lines indicating positive divergence. On a weekly basis, moving average convergence divergence diverged on a positive basis from price between 2014 and 2016, while prices found new lows.
Since that time there have been a series of higher lows in price, which is what one would expect. Now that price has broken above the red downtrend line I am watching for a test and hold above that. Coincidently, the US dollar is coming off interim lows, and with an inverse relationship between gold and the dollar this makes sense. At some point the dollar and gold could start to move in tandem, as was the case in the early 2000s, but for now the normal relationship is intact.
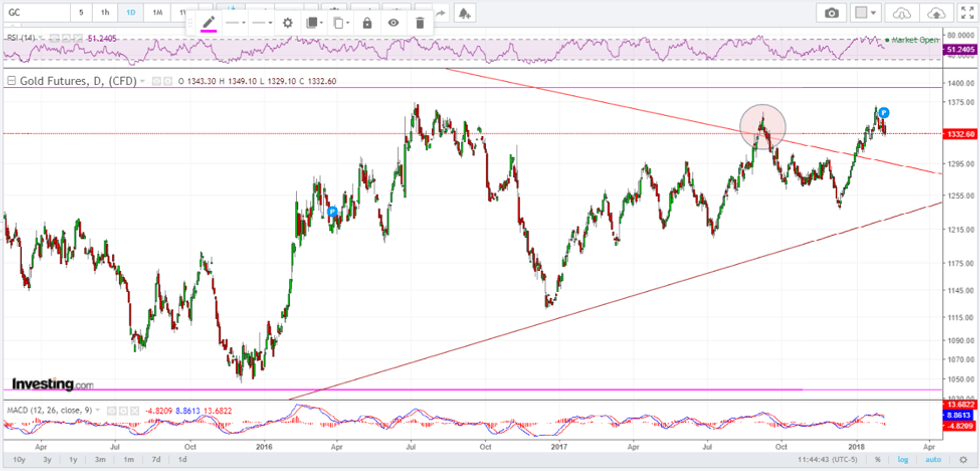
Gold daily
Source: Investing.com, February 6, 2018
I am paying the most attention to the daily chart right now. In September, there was a false breakout above the downtrend line that failed, and this gives me pause in the short term. The macro picture looks great, but a test and hold of the trend and/or a breakout above $1,400 will be important to validate expectations.
Conclusion
Gold appears to have digested the gains of the 11-year run from 2000 to 2011, and now appears ready to resume the uptrend. While the macro looks promising, there are a couple of hurdles left to overcome to confidently state that is the case. In the short term, pressure from a strengthening US dollar may keep downward pressure on the gold price, but as long as the price holds above support a buying opportunity may present itself.
Click here to read more articles by Terry Yaremchuk.
Terry Yaremchuk is an Investment Advisor and Futures Trading representative with the Chippingham Financial Group. Terry offers wealth management and commodities trading services. Specific questions regarding a document can be directed to Terry Yaremchuk. Terry can be reached at tyaremchuk@chippingham.com.
This article is not a recommendation or financial advice and is meant for information purposes only. There is inherit risk with all investing and individuals should speak with their financial advisor to determine if any investment is within their own investment objectives and risk tolerance.
All of the information provided is believed to be accurate and reliable; however, the author and Chippingham assumes no responsibility for any error or responsibility for the use of the information provided. The inclusion of links from this site does not imply endorsement.


