The Conversation (0)
Nov. 08, 2017 03:29PM PST
Silvercorp Metals Inc. (“Silvercorp” or the “Company”) (TSX:SVM) (NYSE American: SVM) reported its financial and operating results for the second quarter ended September 30, 2017. All amounts are expressed in US Dollars.SECOND QUARTER HIGHLIGHTS Net income attributable to equity shareholders of $11.1 million, or $0.07 per share, compared to net income attributable to equity shareholders of $12.4 million, or $0.07 per share in …
Silvercorp Metals Inc. (“Silvercorp” or the “Company”) (TSX:SVM) (NYSE American: SVM) reported its financial and operating results for the second quarter ended September 30, 2017. All amounts are expressed in US Dollars.
SECOND QUARTER HIGHLIGHTS
- Net income attributable to equity shareholders of $11.1 million, or $0.07 per share, compared to net income attributable to equity shareholders of $12.4 million, or $0.07 per share in the prior year quarter;
- Gross margin of 54% compared with 56% in the prior year quarter;
- Sales of $47.5 million, up 3% compared to $46.3 million in the prior year quarter;
- Silver, lead, and zinc metals sold amounted to approximately 1.6 million ounces silver, 16.9 million pounds lead, and 5.6 million pounds zinc, compared to 1.8 million ounces silver, 19.9 million pounds lead, and 5.9 million pounds zinc in the prior year quarter;
- Head grades were 294 grams per tonne (“g/t”) for silver, 4.3% for lead, and 0.8% for zinc at the Ying Mining District, compared to 302 g/t for silver, 4.9% for lead and 1.1% for zinc in the prior year quarter;
- Total and cash mining costs per tonne ore1 of $70.58 and $52.77, respectively, compared to $64.67and $43.09 in the prior year quarter;
- Cash cost per ounce of silver1, net of by-product credits, of negative $5.16, compared to negative $3.05 in the prior year quarter;
- All-in sustaining cost per ounce of silver1, net of by-product credits, of $2.26, compared to $3.15 in the prior year quarter;
- Increased ownership in New Pacific Metals Corp. (“NUAG”) from 16.1% to 31.8% for $20.0 million; and,
- Ended the quarter with $98.6 million in cash and cash equivalents and short-term investments, an increase of $2.2 million or 2% compared to $96.5 million as at March 31, 2017.
FINANCIALS
Net income attributable to equity shareholders of the Company in Q2 Fiscal 2018 was $11.1 million, or $0.07 per share, compared to $12.4 million, or $0.07 per share in Q2 Fiscal 2017.
The Company’s financial results in Q2 Fiscal 2018 were mainly impacted by the following: i) an increase of 48% and 58% in the realized selling prices for lead and zinc, compared to the prior year quarter, ii) a 7% decrease in the realized selling price for silver, iii) less metals sold; iv) higher per tonne production costs, and iv) a $1.1 million foreign exchange loss recorded in the current quarter.
Sales in Q2 Fiscal 2018 were $47.5 million, up 3% compared to $46.3 million in the same quarter last year. Silver and gold sales represented $22.6 million and $0.9 million, respectively, while base metals represented $24.1 million of total sales, compared to silver, gold and base metals sales of $27.0 million, $1.1 million, and $18.2 million, respectively, in the prior year quarter.
Cost of sales in Q2 Fiscal 2018 was $21.9 million compared to $20.5 million in Q2 Fiscal 2017. The cost of sales included $16.2 million (Q2 Fiscal 2017 – $13.8 million) cash production costs, $1.3 million mineral resources tax (Q2 Fiscal 2017 – $1.0 million), and $4.4 million (Q2 Fiscal 2017 – $5.7 million) depreciation and amortization charges. The increase of cash production costs was mainly due to higher per tonne cash production costs recorded in current quarter while the increase of mineral resources tax was due to higher sales achieved in Q2 Fiscal 2018.
Gross profitmargin in Q2 Fiscal 2018 was 54%, compared to 56% in Q2 Fiscal 2017. Ying Mining District’s gross margin was 56% compared to a 61% gross profit margin in the prior year quarter. GC Mine’s profit margin was 40% compared to a 38% gross profit margin in the prior year quarter.
General andadministrative expenses in Q2 Fiscal 2018 were $4.5 million, an increase of 8% or $0.4 million, compared to $4.1 million in Q2 Fiscal 2017.
Income tax expenses in Q2 Fiscal 2018 were $5.3 million compared to $5.9 million in Q2 Fiscal 2017. The income tax expense recorded in Q2 Fiscal 2017 included current income tax expense of $4.5 million (Q2 Fiscal 2016 – $4.9 million) and deferred income tax expense of $0.7 million (Q2 Fiscal 2016 – $1.0 million).
Cash flows provided by operating activities in Q2 Fiscal 2018 were $20.7 million, compared to $27.0 million in the prior year quarter. Before changes in non-cash operating working capital, cash flows provided by operating activities in Q2 Fiscal 2018 were $21.7 million, a decrease of $3.2 million or 13%, compared to $24.9 million in the prior year quarter. Free cash flow in Q2 Fiscal 2018 was $14.2 million, compared to $20.6 million in the prior year quarter.
For the six months ended September 30, 2017, net income attributable to the shareholders of the Company was $22.1 million or $0.13 per share, up 23% compared to $17.1 million or $0.10 per share in the same prior year period; sales were $87.2 million, up 7% from $81.6 million in the same prior year period; and cash flow from operating activities and free cash flow were $37.6 million and $23.9 million, respectively, compared to $47.2 million and $33.4 million in the same prior year period.
Working capital as at September 30, 2017 was $77.6 million, an increase of $6.9 million or 10%, compared to $70.7 million working capital as at March 31, 2017.
OPERATIONS AND DEVELOPMENT
In Q2 Fiscal 2018, the Company’s production was affected by power downtime due to power grid upgrading works, government inspections and explosive supply limitations brought in as a public safety measure by local governments in advance of the 19th National Congress of the Communist Party of China(“CPC”), and the typhoon conditions in South China. On a consolidated basis, the Company mined 239,106 tonnes of ore in Q2 Fiscal 2018, a decrease of 6% or 14,780 tonnes compared to 253,886 tonnes in Q2 Fiscal 2017. Ore mined at the Ying Mining District decreased by 3% or 5,900 tonnes, and ore mined at the GC Mine decreased by 12% or 8,880 tonnes.
In Q2 Fiscal 2018, the Company sold approximately 1.6 million ounces of silver, 800 ounces of gold, 16.9 million pounds of lead, and 5.6 million pounds of zinc, compared to 1.8 million ounces of silver, 1,000 ounces of gold, 19.9 million pounds of lead, and 5.9 million pounds of zinc, respectively, in Q2 Fiscal 2017. The decrease of metals sold was mainly due to less production and lower head grade achieved at the Ying Mining District.
In Q2 Fiscal 2018, the consolidated total mining costs and cash mining costs were $70.58 and $52.77 per tonne, compared to $64.67 and $43.09 per tonne, respectively, in Q2 Fiscal 2017. The increase in cash mining costs were mainly due to i) $0.6 million increase in raw material costs mainly arising from the increasing prices in copper and steel related material, such as cable, rail and ground support products, ii) $1.0 million increase in mining preparation costs resulting from more underground drilling and tunnelling expensed in the current quarter, and iii) lower production output resulting in higher per tonne overhead costs allocation.
The consolidated total production costs and cash costs per ounce of silver, net of by-product credits, were negative $2.43 and negative $5.16 in Q2 Fiscal 2018 compared to $0.10 and negative $3.05 respectively, in the prior year quarter. The overall decrease in cash cost per ounce of silver, net of by-product credits, is mainly due to a 27% increase in by-product credits, mainly arising from 48% and 58% increase in lead and zinc net realized selling prices, offset by 15% and 5% decrease in lead and zinc metals sold. Sales from lead and zinc accounted for 50% of the total sales and amounted to $23.9 million, an increase of $5.7 million, compared to $18.2 million in the prior year quarter.
In Q2 Fiscal 2018, the consolidated all-in sustaining costs per ounce of silver, net of by-product credits, is $2.26 compared to $3.15 in Q2 Fiscal 2017. The decrease was mainly due to an increase of $5.7 millionin by-product credits offset by a $0.6 million increase in sustaining capital expenditures and the increase of per tonne cash production costs as discussed above.
For the six months ended September 30, 2017, approximately 3.1 million ounces of silver, 1,700 ounces of gold, 32.8 million pounds of lead, and 10.6 million pounds of zinc were sold compared to 3.5 million ounces of silver, 2,000 ounces of gold, 36.7 million of lead, and 11.1 million pounds of zinc sold in the same prior year period; the consolidated total mining and cash mining costs were $69.39 and $51.57 per tonne, 4% and 14% increase compared to $66.61 and $45.09 per tonne in the same prior year period while the consolidated total milling costs and cash milling costs reduced by 5% and 6% to $12.45 and $10.13, respectively, compared to $13.11 and $10.79 per tonne in the same prior year period; and, the consolidated cash production costs and all-in sustaining costs per ounce of silver, net of by-product credits, were negative $4.51 and $3.44 compared to negative $1.68 and $5.01, respectively, in the same prior year period.
1. Ying Mining District, Henan Province, China
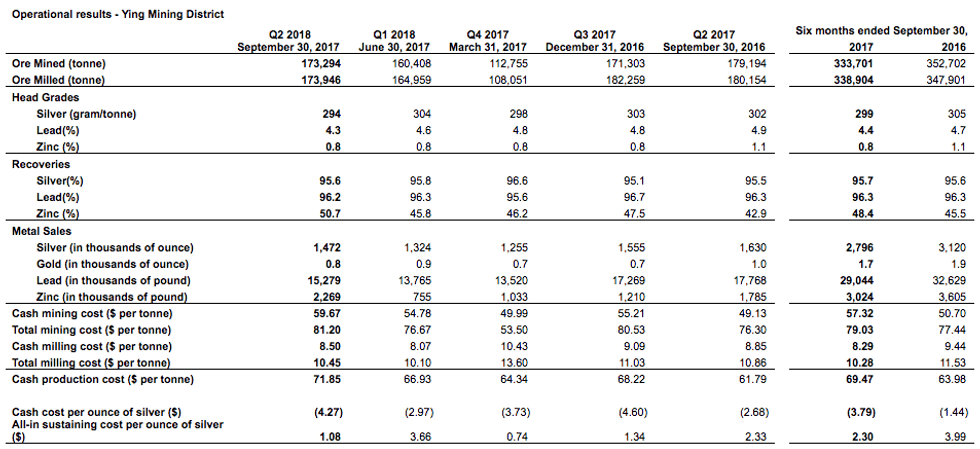
In Q2 Fiscal 2018, the total ore mined at the Ying Mining District was 173,294 tonnes, a decrease of 3%, compared to 179,194 tonnes mined in the prior year quarter. Approximately 2,900 tonnes of ore production was affected by several days of power downtime due to power grid upgrades by State Grid Corporation, and approximately 3,000 tonnes production was affected by government inspections and explosive supply limitation brought in as a safety measure by the local government in advance of the 19thCPC National Congress. As a further public safety measure during the 19th CPC National Congress in October 2017, mining activities at the Ying Mining District were temporary suspended for five days as requested by the local government, which has impacted ore production by approximately 10,000 tonnes in the third quarter of Fiscal 2018.
Correspondingly, ore milled in Q2 Fiscal 2018 decreased by 3% to 173,946 tonnes from 180,154 tonnes in the prior year quarter. Head grades were 294 grams per ton (“g/t”) for silver, 4.3% for lead, and 0.8% for zinc, compared to 302 g/t for silver, 4.9% for lead and 1.1% for zinc in the prior year quarter. The decrease of head grades is mainly due to the average geological grades of ore mined in the current quarter being lower than the prior year quarter.
In Q2 Fiscal 2018, the Ying Mining District sold approximately 1.5 million ounces silver, 15.3 million pounds lead, and 2.3 million pounds zinc, compared to 1.6 million ounces silver, 17.8 million pounds lead, and 1.8 million pounds of zinc in the prior year quarter. The decrease of metals sold at the Ying Mining District was mainly due to a 3% decrease of ore milled and lower head grades achieved in the current quarter.
Total and cash mining costs per tonne at the Ying Mining District in Q2 Fiscal 2018 were $81.20 and $59.67 per tonne, respectively, compared to $76.30 and $49.13 per tonne in the prior year quarter. The increase in cash mining costs were mainly due to i) $0.6 million increase in raw material costs mainly arising from the increasing prices in copper and steel related material, ii) $0.7 million increase in mining preparation costs resulting from more underground drilling and tunnelling expensed in the current quarter, and iii) lower production output resulting in higher per tonne overhead costs allocation. Total and cash milling costs per tonne at the Ying Mining District in Q2 Fiscal 2018 were $10.45 and $8.50, a decrease of 4%, compared to $10.86 and $8.85 in Q2 Fiscal 2017.
Cash cost per ounce of silver, net of by-product credits, in Q2 Fiscal 2018 at the Ying Mining District, was negative $4.27 compared to negative $2.68 in the prior year quarter. The improvement was mainly due to a $4.2 million or 28% increase in by-product credits offset by the 16% increase in the per tonne cash production costs.
All in sustaining costs per ounce of silver, net of by-product credits, in Q2 Fiscal 2018 at the Ying Mining District was $1.08 compared to $2.33 in the prior year quarter. The improvement was mainly due to lower cash costs per ounce of silver as discussed above.
For the six months ended September 30, 2017, a total of 333,701 tonnes of ore were mined and 338,904 tonnes milled at the Ying Mining District, down by 5% and 3%, compared to 352,702 tonnes mined and 347,901 tonnes milled in the same prior year period. Average head grades were 299 g/t for silver, 4.4% for lead, and 0.8% for zinc compared to 305 g/t for silver, 4.7% for lead, and 1.1% for zinc, respectively, in the same prior year period.
During the same time periods, the Ying Mining District sold approximately 2.8 million ounces of silver, 1,700 ounces of gold, 29.0 million pounds of lead, and 3.0 million pounds of zinc, compared to 3.1 million ounces of silver, 1,900 ounces of gold, 32.6 million pounds of lead, and 3.6 million pounds of zinc in prior year period.
For the six months ended September 30, 2017, the cash mining costs at the Ying Mining District was $57.32 per tonne, an increase of 13% compared to $50.70 in the same prior year period. The cash milling costs was $8.29 per tonne, a decrease of 12% compared to $9.44 in the same prior year period.
Cash costs per ounce of silver and all in sustaining costs per ounce of silver, net of by‐product credits, at the Ying Mining District, for the six months ended September 30, 2017, were negative $3.79 and $2.30respectively, compared to negative $1.44 and $3.99 in the same prior year period.
In Q2 Fiscal 2018, approximately 29,834 m or $0.6 million of underground diamond drilling (Fiscal Q2 2017 – 22,188 m or $0.5 million) and 6,390 m or $1.9 million of preparation tunnelling (Fiscal Q2 2017 – 5,333 m or $1.4 million) were completed and expensed as mining preparation costs at the Ying Mining District. In addition, approximately 16,958 m or $5.2 million of horizontal tunnel, raises and declines (Q2 Fiscal 2017 – 14,804 m or $4.8 million) were completed and capitalized.
For the six months ended September 30, 2017, approximately 60,898 m or $1.3 million of underground diamond drilling (same prior year period – 35,038 m or $0.9 million) and 11,727 or $3.3 million of preparation tunnelling (same prior year period – 10,169 m or $2.8 million) were completed and expensed as mining preparation costs at the Ying Mining District. In addition, approximately 35,848 m or $10.2 million of horizontal tunnel, raises, and declines (same prior year period – 32,677 m or $9.7 million) were completed and capitalized.
2. GC Mine, Guangdong Province, China
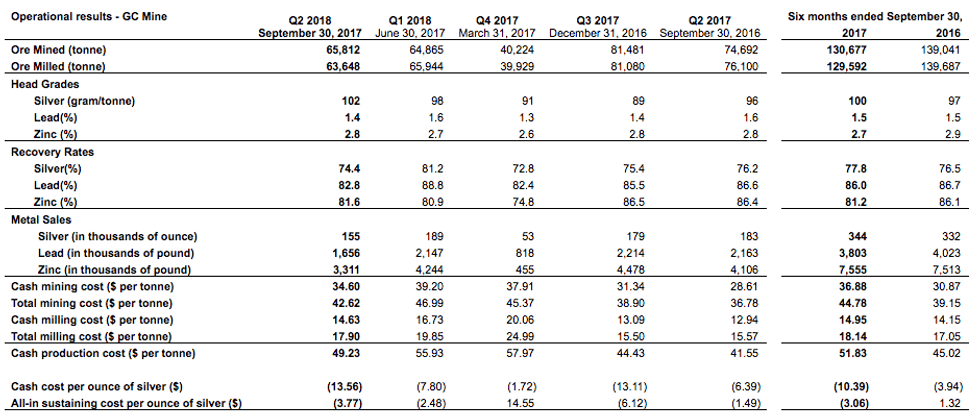
In Q2 Fiscal 2018, the total ore mined at the GC Mine was 65,812 tonnes, a decrease of 8,880 tonnes or 12%, compared to 74,692 tonnes mined in Q2 Fiscal 2017, while ore milled decreased by 16% to 63,648 tonnes from 76,100 tonnes in the prior year quarter. The decrease was mainly due to the interruption arising from the typhoon that impacted South China during the quarter and the regulatory mine inspection during the normal process to renew the safety production permit at the GC Mine. Head grades were 102 g/t for silver, 1.4% for lead, and 2.8% for zinc compared to 96 g/t for silver, 1.6% for lead, and 2.8% for zinc in the prior year quarter.
In Q2 Fiscal 2018, the GC Mine sold 155 thousand ounces of silver, 1.7 million pounds of lead, 3.3 million pounds of zinc, compared to 183 thousand ounces of silver, 2.2 million pounds of lead, and 4.1 million pounds of zinc sold in the prior year quarter. The decrease of metal sold at the GC Mine was mainly due to less ore processed in the current quarter.
Total and cash mining costs per tonne at the GC Mine in Q2 Fiscal 2018 were $42.62 and $34.60 per tonne, compared to $36.78 and $28.61 per tonne in Q2 Fiscal 2017. The increase in cash mining costs was mainly due to a $0.3 million increase in mining preparation costs resulting from more underground drilling and tunnelling expensed in the current quarter and less production output resulting in higher per tonne overhead costs allocation.
Total and cash milling costs per tonne at the GC Mine in Q2 Fiscal 2018 were $17.90 and $14.63, compared to $15.57 and $12.94, respectively, in Q2 Fiscal 2017. The increase in milling costs was mainly due to higher per tonne overhead costs allocation resulting from less ore processed.
Cash costs per ounce of silver, net of by-product credits, at the GC Mine, was negative $13.56 compared to negative $6.39 in the prior year quarter. The decrease was mainly due to $1.1 million or 24% increase in by-product credits resulting from a 60% and 55% increase in net realized lead and zinc selling prices offset by less lead and zinc metals sold at the GC Mine.
All in sustaining costs per ounce of silver, net of by-product credits, in Q2 Fiscal 2018 at the GC Mine was negative $3.77 compared to negative $1.50 in the prior year quarter. The improvement was mainly due to lower cash costs per ounce of silver as discussed above.
For the six months ended September 30, 2017, a total of 130,677 tonnes of ore were mined and 129,592 tonnes were milled at the GC Mine compared to 139,041 tonnes mined and 139,687 tonnes milled in the same prior year period. Average head grades were 100 g/t for silver, 1.5% for lead, and 2.7% for zinc compared to 97 g/t for silver, 1.5% for lead, and 2.9% for zinc, respectively, in the same prior year period.
During the same time periods, the GC Mine sold approximately 344 thousand ounces of silver, 3.8 million pounds of lead, and 7.6 million pounds of zinc, compared to 332 thousand ounces of silver, 4.0 million pounds of lead, and 7.5 million pounds of zinc in the same prior year period.
For the six months ended September 30, 2017, the cash mining costs at the GC Mine was $36.88 per tonne, an increase of 19% compared to $30.87 per tonne in the same prior year period. The increase in cash mining costs was mainly due to a $0.7 million increase in mining preparation as more underground drilling and tunnelling was expensed in the current period and higher per tonne overhead costs allocation resulting from less production output. The cash milling cost was $14.95 per tonne, an increase of 6% compared to $14.15 in the same prior year period.
Cash cost per ounce of silver and all in sustaining costs per ounce of silver, net of by‐product credits, at the GC Mine, for the six months ended September 30, 2016, were negative $10.39 and negative $3.06respectively, compared to negative $3.94 and $1.32 in the same prior year period.
In Q2 Fiscal 2018, approximately 5,511 m or $0.2 million of underground diamond drilling (Q2 Fiscal 2017 – 2,245 m or $0.2 million) and 3,940 m or $1.1 million of tunnelling (Q2 Fiscal 2017 – 3,850 m or $1.0 million) were completed and expensed as mining preparation costs at the GC Mine. In addition, approximately 105 m or $0.1 million of horizontal tunnel, raises and declines (Q2 Fiscal 2017 – 606 m or $0.2 million) were completed and capitalized.
For the six months ended September 30, 2017, approximately 10,483 m or $0.5 million of underground diamond drilling (same prior year period – 5,554 m or $0.4 million) and 9,232 m or $2.4 million of tunnelling (same prior year period – 7,336 m or $1.9 million) were completed and expensed as mining preparation costs at the GC Mine. In addition, approximately 263 m or $0.2 million of horizontal tunnel, raise, and declines (same prior year period – 1,188 m or $0.4 million) were completed and capitalized.
Alex Zhang, P.Geo., is the Qualified Person for Silvercorp under NI 43-101 and has reviewed and given consent to the technical information contained in this news release.
This earnings release should be read in conjunction with the Company’s Management Discussion & Analysis, Financial Statements and Notes to Financial Statements for the corresponding period, which have been posted on SEDAR at www.sedar.com and are also available on the Company’s website at www.silvercorp.ca. All figures are in United States dollars unless otherwise stated.
About Silvercorp
Silvercorp is a low-cost silver-producing Canadian mining company with multiple mines in China. The Company’s vision is to deliver shareholder value by focusing on the acquisition of under developed projects with resource potential and the ability to grow organically. For more information, please visit our website at www.silvercorp.ca.
CAUTIONARY DISCLAIMER – FORWARD LOOKING STATEMENTS
Certain of the statements and information in this press release constitute “forward-looking statements” within the meaning of the United States Private Securities Litigation Reform Act of 1995 and “forward-looking information” within the meaning of applicable Canadian provincial securities laws. Any statements or information that express or involve discussions with respect to predictions, expectations, beliefs, plans, projections, objectives, assumptions or future events or performance (often, but not always, using words or phrases such as “expects”, “is expected”, “anticipates”, “believes”, “plans”, “projects”, “estimates”, “assumes”, “intends”, “strategies”, “targets”, “goals”, “forecasts”, “objectives”, “budgets”, “schedules”, “potential” or variations thereof or stating that certain actions, events or results “may”, “could”, “would”, “might” or “will” be taken, occur or be achieved, or the negative of any of these terms and similar expressions) are not statements of historical fact and may be forward-looking statements or information. Forward-looking statements or information relate to, among other things: the price of silver and other metals; the accuracy of mineral resource and mineral reserve estimates at the Company’s material properties; the sufficiency of the Company’s capital to finance the Company’s operations; estimates of the Company’s revenues and capital expenditures; estimated production from the Company’s mines in the Ying Mining District; timing of receipt of permits and regulatory approvals; availability of funds from production to finance the Company’s operations; and access to and availability of funding for future construction, use of proceeds from any financing and development of the Company’s properties.
Forward-looking statements or information are subject to a variety of known and unknown risks, uncertainties and other factors that could cause actual events or results to differ from those reflected in the forward-looking statements or information, including, without limitation, risks relating to: fluctuating commodity prices; calculation of resources, reserves and mineralization and precious and base metal recovery; interpretations and assumptions of mineral resource and mineral reserve estimates; exploration and development programs; feasibility and engineering reports; permits and licences; title to properties; property interests; joint venture partners; acquisition of commercially mineable mineral rights; financing; recent market events and conditions; economic factors affecting the Company; timing, estimated amount, capital and operating expenditures and economic returns of future production; integration of future acquisitions into the Company’s existing operations; competition; operations and political conditions; regulatory environment in China and Canada; environmental risks; foreign exchange rate fluctuations; insurance; risks and hazards of mining operations; key personnel; conflicts of interest; dependence on management; internal control over financial reporting as per the requirements of the Sarbanes-Oxley Act; and bringing actions and enforcing judgments under U.S. securities laws.
This list is not exhaustive of the factors that may affect any of the Company’s forward-looking statements or information. Forward-looking statements or information are statements about the future and are inherently uncertain, and actual achievements of the Company or other future events or conditions may differ materially from those reflected in the forward-looking statements or information due to a variety of risks, uncertainties and other factors, including, without limitation, those referred to in the Company’s Annual Information Form for the year ended March 31, 2017 under the heading “Risk Factors”. Although the Company has attempted to identify important factors that could cause actual results to differ materially, there may be other factors that cause results not to be as anticipated, estimated, described or intended. Accordingly, readers should not place undue reliance on forward-looking statements or information.
The Company’s forward-looking statements and information are based on the assumptions, beliefs, expectations and opinions of management as of the date of this press release, and other than as required by applicable securities laws, the Company does not assume any obligation to update forward-looking statements and information if circumstances or management’s assumptions, beliefs, expectations or opinions should change, or changes in any other events affecting such statements or information. For the reasons set forth above, investors should not place undue reliance on forward-looking statements and information.
To read the full press release please visiit: https://www.silvercorpmetals.com/news_and_media/news/index.php?content_id=684
Source: www.silvercorpmetals.com