The Conversation (0)
Oct. 06, 2016 08:07PM PST
Precious metals investors were hard hit last week. Here’s a different perspective on where we stand in the gold and silver markets.
By Albert Sung
Precious metals investors were hard hit last week with gold and silver plunging 5 percent and 10 percent respectively. During these times we should take a moment to gain some more perspective on where we stand in the gold and silver markets.
First I want to point out that the takedown in precious metals occurred exactly during the Chinese national holiday, also called the golden week, which started October 1th, 2016. During this week, the Shanghai Gold Exchange did not trade, which means that the largest physical gold market was closed.
The following chart shows monthly SGE gold withdrawals which equal monthly Chinese gold demand. The weekly gold withdrawals average 40 tonnes of gold demand. This is a significant number if you compare it to the gold ETF GLD which has an average trade of 20 tonnes/week. So we are seeing the effect of a closed Chinese gold market here.

Second, it is a known fact that the gold bull market of 2016 was primarily driven by investment demand, especially in ETF’s like GLD as the following correlation shows. The gold bull market started in 2016 when funds were buying physical gold through GLD (red line). Consequently, the gold price started to rise with it (blue line).
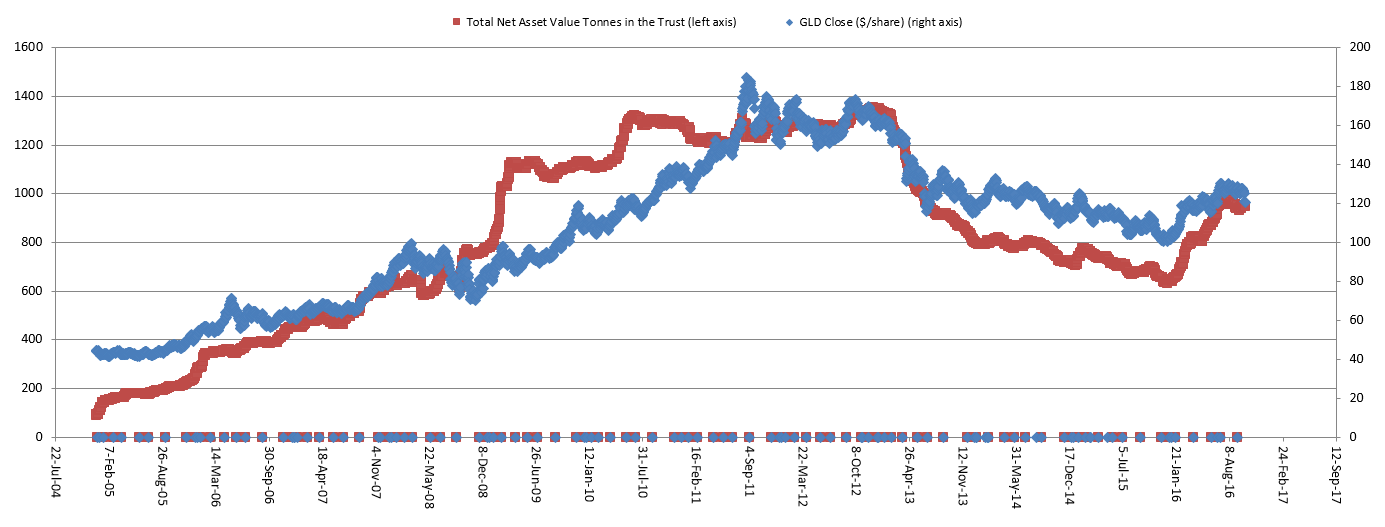
Let’s zoom into 2015-2016. What’s notable is that we don’t see the amount of physical gold withdrawals from GLD (red line is flat) that would explain the big drop in the gold price last week.

This premise is confirmed by the COMEX registered gold numbers presented in the following chart. Historically, we see a correlation between the GLD stock flows and the COMEX registered gold stock numbers (blue line). The latest COMEX gold stock report shows a new record high of 2549666 troy ounces in the registered gold category. So I expect more inflows in physical gold ETF’s and consequently expect a higher gold price.
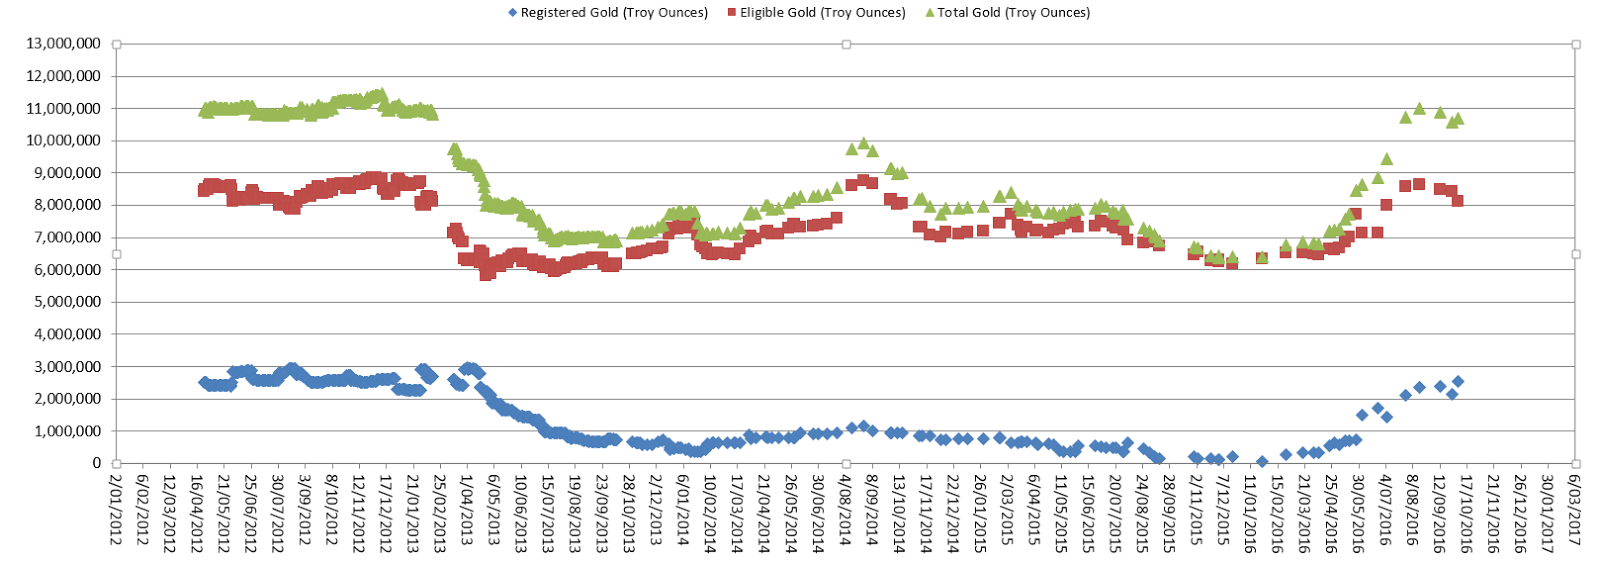
What we can also see from this chart is that open interest has been falling (red line dropping) since July 2016. It is also during this timeframe that gold started to correct. This is a bullish sign. If the total open interest is falling off and prices are declining, the price decline is likely being caused by disgruntled long position holders being forced to liquidate their positions. Technicians view this scenario as a strong position technically because the downtrend will end once all the sellers have sold their positions. You could say that the speculator long positions are now being rinsed out.
It will be interesting to see how many of these long positions have been cleared by seeing how the managed money short positions will rise in the weekly COT reports.
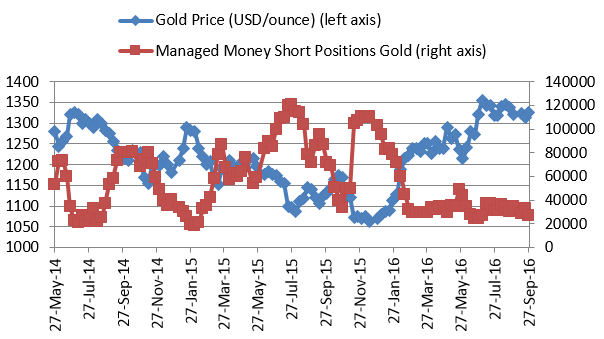
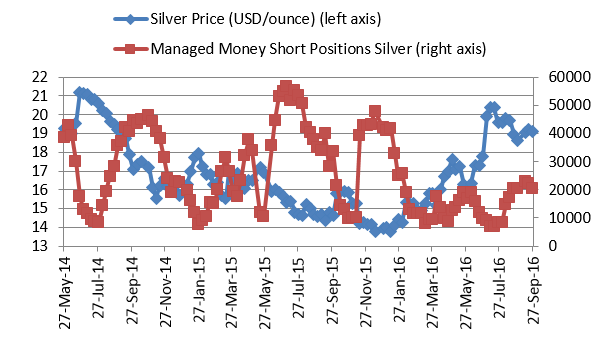
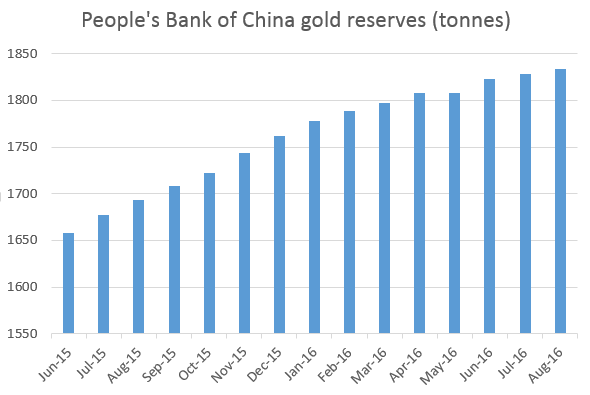
Third, while the SGE is closed, the Chinese central bank is still able to buy physical gold and I expect they will take this opportunity to add to their gold reserves (see chart below).
As a matter of fact, we see huge physical buying on these price dips. Physical gold demand in London jumped as consumers were tempted back to the market by the metal’s technically-driven slide through 1,000 pounds an ounce. Online gold trading platform BullionVault.com saw its heaviest trading dayon Tuesday since its all-time record on June 24, the day of the UK referendum result on European Union membership.
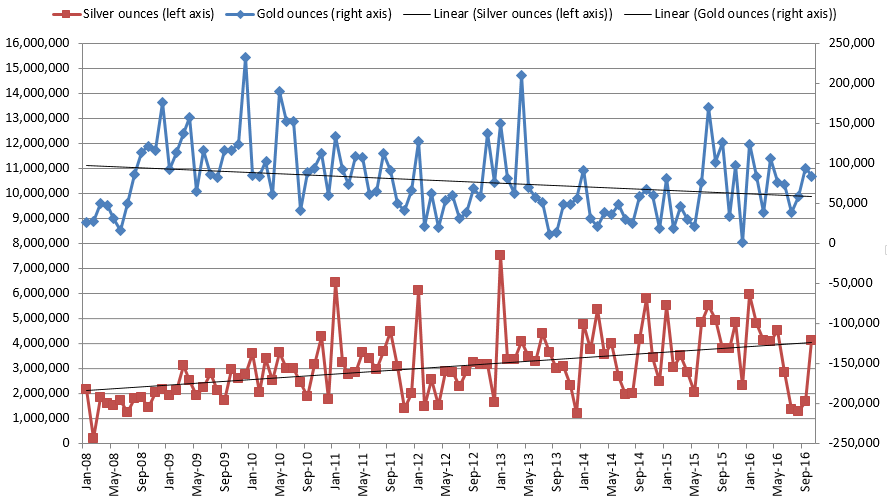
In the silver space the situation is even more pronounced. For example, the U.S. Mint sold 1.03 million 2016 Silver Eagle coins in 24 hours. I extrapolated this figure in the following chart. At these price levels for silver, physical demand has come back to life after a demand dip in the third quarter of 2016.
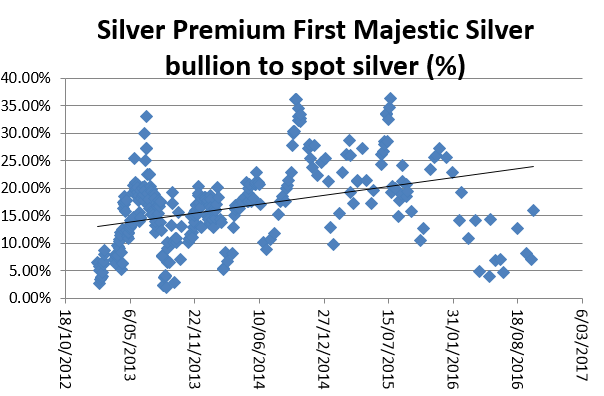
Premiums have shot up in silver bullion stores (see chart below for First Majestic Silver bullion store).
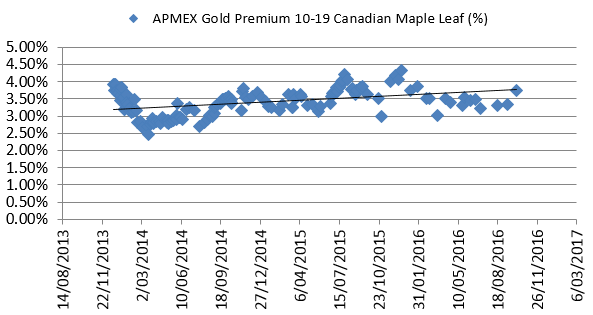
Gold premiums are higher as well (see chart below for APMEX gold maple leafs).
To conclude, I see this correction as a buying opportunity.The price dip is not confirmed by funds selling physical precious metals. On the contrary, huge physical buying has emerged as premiums shoot up. I believe that the weak third quarter will be followed by a pretty strong fourth quarter.
Don’t forget to follow us @INN_Resource for real-time news updates!
Albert Sung is the author of Correlation Economics, monitoring breaking economic news on a day to day basis. He started investing in 2008 because of the economic crisis and holds a masters degree in chemical engineering. Previously, he worked several years as a process engineer at Ashland, a competitor of Dow Chemical. Today, he works as a regulatory compliance consultant at J&J, but his real passion will stay in macro-economics. His experience in the chemical and pharmaceutical industry allows him to monitor the economy from a process engineering standpoint, analyzing macro-economic charts, correlations and trends.