The Conversation (0)
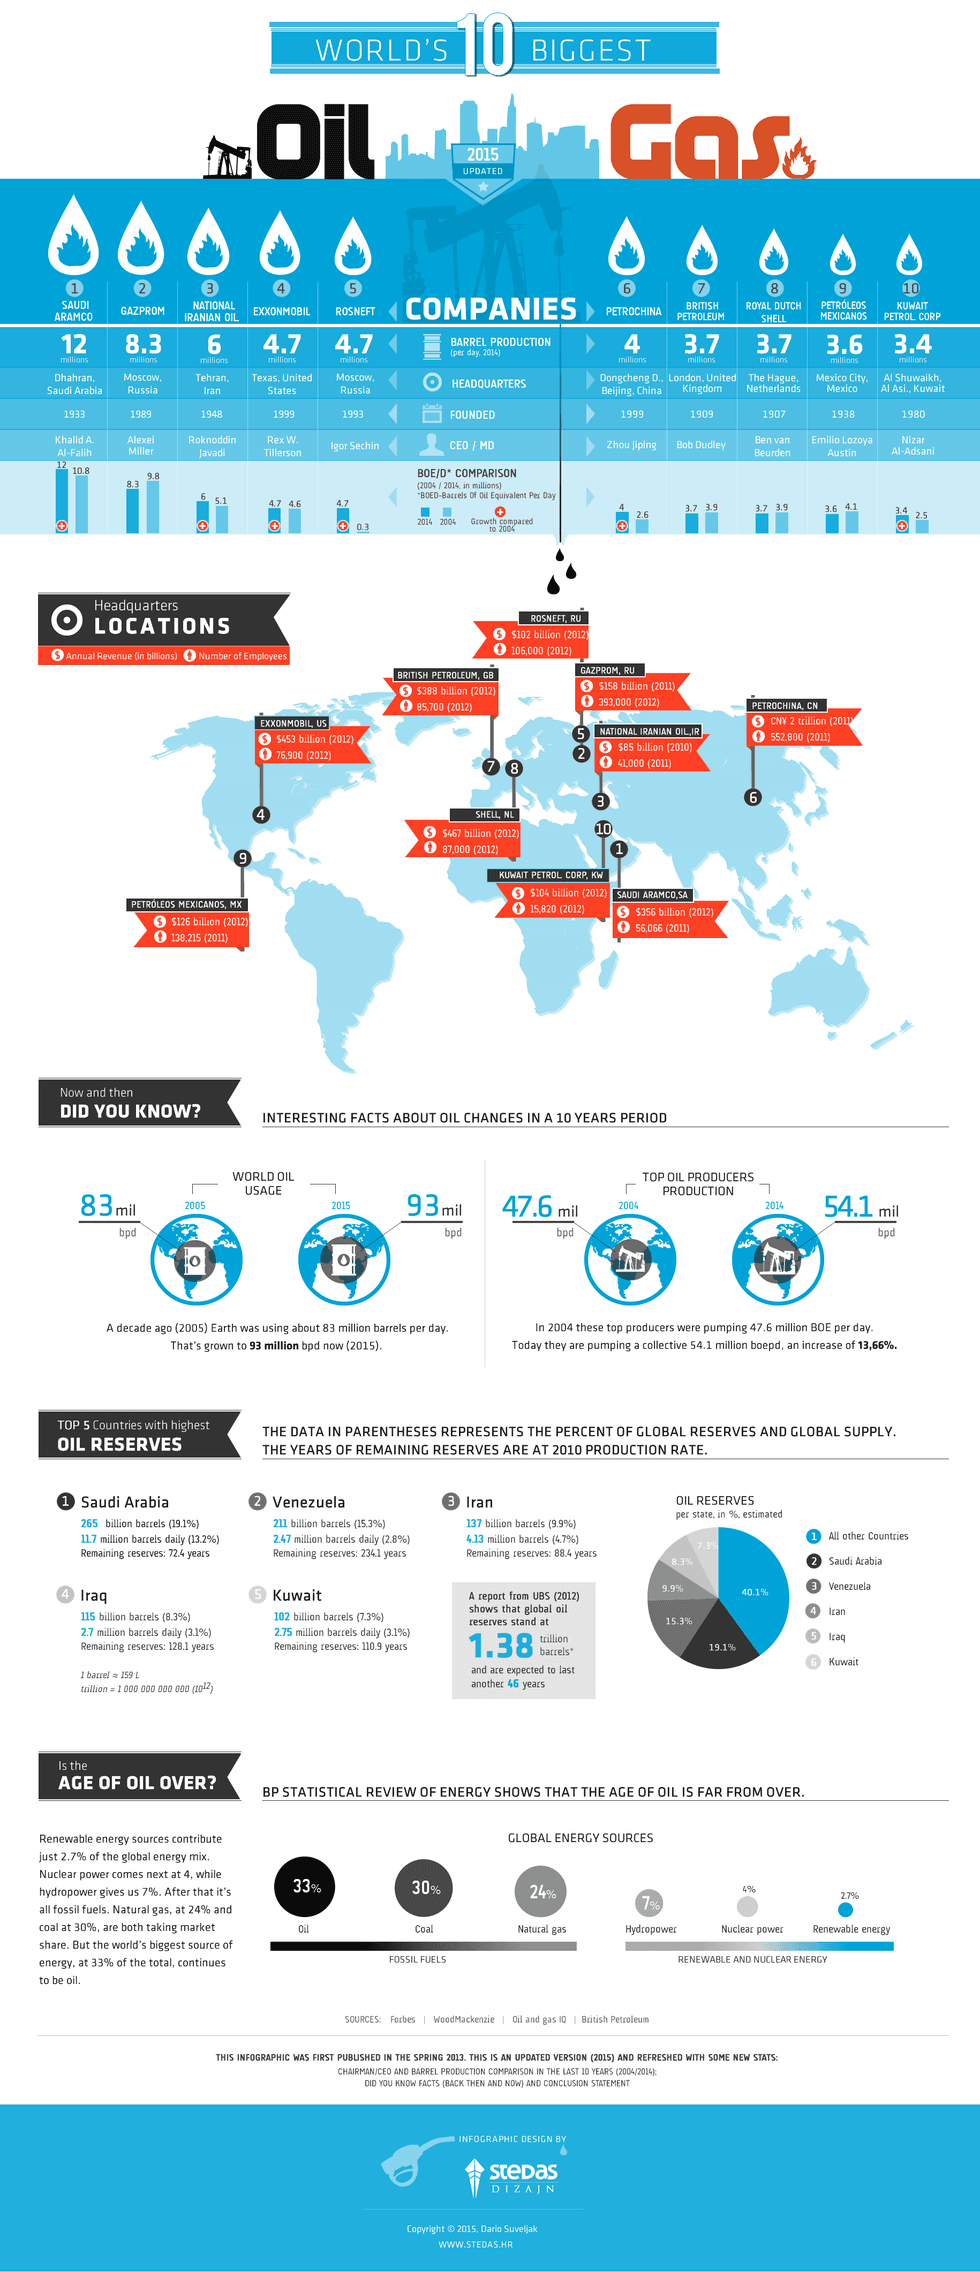
The latest inforgraphic from Visual Capitalist not only ranks oil producers based on factors such as barrel production per day, but it also compares data from a decade ago with today’s information for better perspective.
The latest inforgraphic from Visual Capitalist not only ranks oil producers based on factors such as barrel production per day, but it also compares data from a decade ago with today’s information for better perspective.
According to the data, from 2005 to 2015, global oil usage has only increased from 83 million to 93 million bpd (1.13 percent CAGR). Yet, the Top 10 have grown production at a 1.29 percent CAGR pace and their total production now makes up for approximately 58 percent of all global production.
Click here to view the infographic on the Visual Capitalist website.
Courtesy of: Visual Capitalist