The Conversation (0)
Silvercorp Metals Inc. (“Silvercorp” or the “Company”) (TSX: SVM) (NYSE American: SVM) reported its financial and operating results for the third quarter ended December 31, 2017.
Silvercorp Metals Inc. (“Silvercorp” or the “Company”) (TSX:SVM) (NYSE American:SVM) reported its financial and operating results for the third quarter ended December 31, 2017. All amounts are expressed in US Dollars.
THIRD QUARTER HIGHLIGHTS
- Net income attributable to equity shareholders of $12.7 million, or $0.08 per share1, compared to net income attributable to equity shareholders of $13.1 million, or $0.08 per share in the prior year quarter;
- Gross margin of 52% compared with 55% in the prior year quarter;
- Sales of $44.4 million, down $3.4 million or 7% compared to $47.8 million in the prior year quarter;
- Inventories of silver-lead concentrate of 6,234 tonnes, valued at approximately $16.0 million, an increase of $4.5 million or 39%, compared to 4,666 tonnes valued at approximately $11.5 million in the prior year quarter;
- Silver, lead, and zinc metals sold amounted to approximately 1.5 million ounces silver, 15.8 million pounds lead, and 6.4 million pounds zinc, compared to 1.7 million ounces silver, 19.5 million pounds lead, and 5.7 million pounds zinc in the prior year quarter;
- Head grades were 315 grams per tonne (“g/t”) for silver, 4.5% for lead, and 1.0% for zinc at the Ying Mining District, compared to 303 g/t for silver, 4.8% for lead and 0.8% for zinc in the prior year quarter;
- Total and cash mining costs per tonne ore2 of $74.16 and $56.11, respectively, compared to $67.12 and $47.52 in the prior year quarter;
- Cash cost per ounce of silver2, net of by-product credits, of negative $5.92, compared to negative $5.48 in the prior year quarter;
- All-in sustaining cost per ounce of silver2, net of by-product credits, of $3.16, compared to $1.87 in the prior year quarter;
- Spent $1.8 million to buyback 788,000 common shares of the Company;
- Paid $1.7 million dividend to equity shareholders of the Company;
- Invested $3.8 million to participate in a private placement of New Pacific Metals Corp.; and,
- Ended the quarter with $113.3 million in cash and cash equivalents and short-term investments, an increase of $16.8 million or 17%, compared to $96.5 million as at March 31, 2017.
1 Earnings per share refers to basic earnings per share
2 Non IFRS measure, please refer to section 10 of the corresponding MD&A for reconciliation
FINANCIALS
Net income attributable to equity shareholders of the Company in Q3 Fiscal 2018 was $12.7 million or basic earnings per share of $0.08, compared to $13.1 million, or $0.08 per share in Q3 Fiscal 2017.
Sales in Q3 Fiscal 2018 were $44.4 million, down 7% compared to $47.8 million in the same quarter last year. Silver and gold sales represented $19.8 million and $0.6 million, respectively, while base metals represented $23.9 million of total sales, compared to silver, gold and base metals sales of $23.4 million, $0.7 million, and $23.7 million, respectively, in the prior year quarter.
The Company’s financial results in Q3 Fiscal 2018 were mainly impacted by the following: i) an increase of 8% and 37% in the realized selling prices for lead and zinc, compared to the prior year quarter, ii) a 3% decrease in the realized selling price for silver, iii) less metals sold as inventory built up; and iv) higher per tonne production costs.
As at December 31, 2017, silver-lead concentrate inventories were 6,234 tonnes containing approximately 0.7 million ounces of silver and 6.9 million pounds of lead, an increase of 34% or 1,568 tonnes, compared to 4,666 tonnes silver-lead concentrate inventories containing approximately 0.5 million ounces of silver and 5.4 million pounds of lead held as at December 31, 2016.
Cost of sales in Q3 Fiscal 2018 was $21.2 million, comparable to $21.5 million in Q3 Fiscal 2017. The cost of sales included $15.6 million (Q3 Fiscal 2017 – $14.9 million) cash production costs, $1.3 million mineral resources tax (Q3 Fiscal 2017 – $1.4 million), and $4.4 million (Q3 Fiscal 2017 – $5.2 million) depreciation and amortization charges.
Gross profit margin in Q3 Fiscal 2018 was 52%, compared to 55% in Q3 Fiscal 2017. Ying Mining District’s gross margin was 55% compared to a 58% gross profit margin in the prior year quarter. GC Mine’s profit margin was 41% compared to a 39% gross profit margin in the prior year quarter.
General and administrative expenses in Q3 Fiscal 2018 and the nine months ended December 31, 2017 were $4.9 million and $14.0 million (Q3 Fiscal 2017 – $4.0 million, nine months ended December 31, 2016 – $12.5 million). The increase was mainly due to the resumption of activities at the XHP Project to review alternatives and activities carried at the BYP Mine to renew its mining license, resulting in additional office and administrative expenses and labour costs.
Income tax expenses in Q3 Fiscal 2018 were $4.3 million compared to $5.4 million in Q3 Fiscal 2017. The income tax expense recorded in Q3 Fiscal 2017 included current income tax expense of $3.7 million (Q3 Fiscal 2016 – $4.7 million) and deferred income tax expense of $0.6 million (Q3 Fiscal 2016 – $0.6 million).
Cash flows provided by operating activities in Q3 Fiscal 2018 were $27.5 million, compared to $28.3 million in the prior year quarter. Before changes in non-cash operating working capital, cash flows provided by operating activities in Q3 Fiscal 2018 were $23.0 million, a decrease of $3.4 million or 13%, compared to $26.4 million in the prior year quarter.
For the nine months ended December 31, 2017, net income attributable to equity shareholders of the Company was $34.8 million or $0.21 per share, up 15% compared to $30.2 million or $0.18 per share in the same prior year period; sales were $131.6 million, up 2% from $129.4 million in the same prior year period; and cash flow from operating activities was $65.1 million, down 14% from $75.6 million in the same prior year period.
Working capital as at December 31, 2017 was $84.9 million, an increase of $14.2 million or 20%, compared to $70.7 million working capital as at March 31, 2017.
OPERATIONS AND DEVELOPMENT
(i) Q3 Fiscal 2018 vs. Q3 Fiscal 2017
On a consolidated basis, the Company mined 252,284 tonnes of ore in Q3 Fiscal 2018, comparable to 252,784 tonnes in Q3 Fiscal 2017. Ore milled were 256,037 tonnes, compared to 263,339 tonnes of ore milled in Q3 Fiscal 2017.
In Q3 Fiscal 2018, the Company sold approximately 1.5 million ounces of silver, 700 ounces of gold, 15.8 million pounds of lead, and 6.4 million pounds of zinc, compared to 1.7 million ounces of silver, 700 ounces of gold, 19.5 million pounds of lead, and 5.7 million pounds of zinc, respectively, in Q3 Fiscal 2017. Sales from lead and zinc accounted for 54% of the total sales and amounted to $23.8 million, an increase of $0.3 million, compared to $23.5 million in the prior year quarter.
The consolidated total mining costs and cash mining costs were $74.16 and $56.11 per tonne, compared to $67.12 and $47.52 per tonne, respectively, in Q3 Fiscal 2017. The increase in cash mining costs were mainly due to: i) a $0.9 millionincrease in raw material supply costs, ii) a $0.4 million increase in mining preparation costs resulting from more underground tunnelling expensed in the current quarter, and iii) a $0.5 million increase in mining labor costs due to additional bonus accrued as per the Company’s profit sharing plan in China.
The consolidated total milling costs and cash milling costs in Q3 Fiscal 2018 were $13.45 and $11.31 per tonne, compared to $12.40 and $10.32 per tonne, respectively, in Q3 Fiscal 2017. The increase in cash milling costs were mainly due to $0.2 million increase in raw material supply costs.
The consolidated total production costs and cash costs per ounce of silver, net of by-product credits, were negative $3.04 and negative $5.92 compared to negative $2.50 and negative $5.48 respectively, in the prior year quarter. The overall decrease in cash cost per ounce of silver, net of by-product credits, is mainly due to a 1% increase in by-product credits, mainly arising from 8% and 37% increase in lead and zinc net realized selling prices.
The consolidated all-in sustaining costs per ounce of silver, net of by-product credits, is $3.16 compared to $1.87 in Q3 Fiscal 2017.
(ii) Nine months ended December 31, 2017 vs Nine months ended December 31, 2016
For the nine months ended December 31, 2017, approximately 4.7 million ounces of silver, 2,400 ounces of gold, 48.6 million pounds of lead, and 17.0 million pounds of zinc were sold compared to 5.2 million ounces of silver, 2,600 ounces of gold, 56.1 million of lead, and 16.8 million pounds of zinc sold in the same prior year period.
The consolidated total mining and cash mining costs were $71.07 and $53.17 per tonne, 6% and 16% increase compared to $66.79 and $45.92 per tonne in the same prior year period while the consolidated total milling costs and cash milling costs were $12.81 and $10.55, comparable to $12.86 and $10.62 per tonne in the same prior year period.
The consolidated cash production costs and all-in sustaining costs per ounce of silver, net of by-product credits, were negative $4.97 and $3.35 compared to negative $2.95 and $3.96, respectively, in the same prior year period.
1. Ying Mining District, Henan Province, China
(i) Q3 Fiscal 2018 vs. Q3 Fiscal 2017
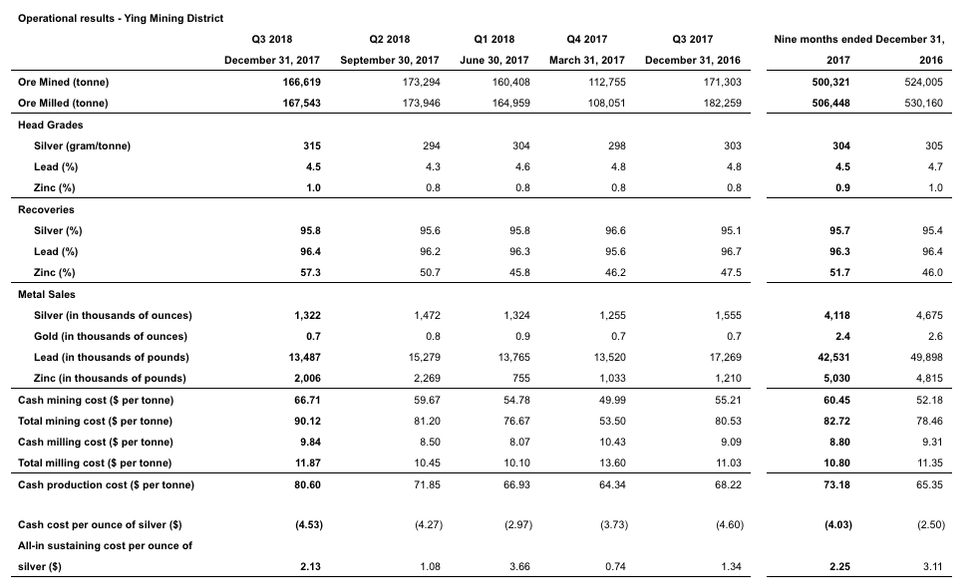
In Q3 Fiscal 2018, the total ore mined at the Ying Mining District was 166,619 tonnes, a decrease of 3% or 4,684 tonnes, compared to 171,303 tonnes mined in the prior year quarter. Correspondingly, ore milled in Q3 Fiscal 2018 decreased by 8% to 167,543 tonnes from 182,259 tonnes in the prior year quarter.
Head grades were 315 grams per ton (“g/t”) for silver, 4.5% for lead, and 1.0% for zinc, compared to 303 g/t for silver, 4.8% for lead and 0.8% for zinc in the prior year quarter. The Company continues to achieve improvements in dilution control using its “Enterprise Blog” to assist manage daily operations.
Metals sold were approximately 1.3 million ounces silver, 13.5 million pounds lead, and 2.0 million pounds zinc, compared to 1.6 million ounces silver, 17.3 million pounds lead, and 1.2 million pounds of zinc in the prior year quarter. The decrease of silver and lead sold was mainly due to silver-lead concentrate inventory built up.
Silver-lead concentrate inventories were 6,200 tonnes containing approximately 0.7 million ounces of silver and 6.8 million pounds of lead, an increase of 33% or 1,544 tonnes, compared to 4,656 tonnes silver-lead concentrate inventories held as at December 31, 2016.
Total and cash mining costs per tonne at the Ying Mining District in Q3 Fiscal 2018 were $90.12 and $66.71 per tonne, respectively, compared to $80.53 and $55.21 per tonne in the prior year quarter. The increase in cash mining costs were mainly due to: i) a $0.9 million increase in raw material supply costs, and ii) a $0.4 million increase in mining labor costs due to additional bonus accrued as per the Company’s profit sharing plan in China.
Total and cash milling costs per tonne at the Ying Mining District in Q3 Fiscal 2018 were $11.87 and $9.84, compared to $11.03 and $9.09 in Q3 Fiscal 2017. The increase in cash milling costs was mainly due to a 15% increase in per tonne raw material supply costs.
Cash cost per ounce of silver, net of by-product credits, in Q3 Fiscal 2018 at the Ying Mining District, was negative $4.53, comparable to negative $4.60 in the prior year quarter.
All in sustaining costs per ounce of silver, net of by-product credits, in Q3 Fiscal 2018 at the Ying Mining District was $2.13compared to $1.34 in the prior year quarter.
Approximately 25,109 m or $0.4 million of underground diamond drilling (Fiscal Q3 2017 – 36,756 m or $0.6 million) and 5,187 m or $1.6 million of preparation tunnelling (Fiscal Q3 2017 – 4,900 m or $1.4 million) were completed and expensed as mining preparation costs at the Ying Mining District. In addition, approximately 16,326 m or $6.0 million of horizontal tunnel, raises and declines (Q3 Fiscal 2017 – 17,823 m or $5.5 million) were completed and capitalized.
(ii) Nine months ended December 31, 2017 vs Nine months ended December 31, 2016
For the nine months ended December 31, 2017, a total of 500,321 tonnes of ore were mined and 506,448 tonnes milled at the Ying Mining District, down by 5% and 4%, compared to 524,005 tonnes mined and 530,160 tonnes milled in the same prior year period.
Average head grades were 304 g/t for silver, 4.5% for lead, and 0.9% for zinc compared to 305 g/t for silver, 4.7% for lead, and 1.0% for zinc, respectively, in the same prior year period.
Metals sold were approximately 4.1 million ounces of silver, 2,400 ounces of gold, 42.5 million pounds of lead, and 5.0 million pounds of zinc, compared to 4.7 million ounces of silver, 2,600 ounces of gold, 49.9 million pounds of lead, and 4.8 million pounds of zinc in prior year period.
The cash mining costs was $60.45 per tonne, an increase of 16% compared to $52.18 in the same prior year period. The increase was mainly due to more underground drilling and tunneling being expensed as mining preparation costs as well as the increase of raw material supply prices. The cash milling cost was $8.80 per tonne, a decrease of 5% compared to $9.31 in the same prior year period.
Cash cost per ounce of silver and all in sustaining costs per ounce of silver, net of by-product credits, were negative $4.03and $2.25 respectively, compared to negative $2.50 and $3.11 in the same prior year period.
Approximately 86,007 m or $1.7 million of underground diamond drilling (same prior year period – 71,794 m or $1.7 million) and 16,914 or $4.9 million of preparation tunnelling (same prior year period – 15,069 m or $4.2 million) were completed and expensed as mining preparation costs at the Ying Mining District. In addition, approximately 52,174 m or $16.2 million of horizontal tunnel, raises, and declines (same prior year period – 50,500 m or $15.2 million) were completed and capitalized.
2. GC Mine, Guangdong Province, China
(i) Q3 Fiscal 2018 vs. Q3 Fiscal 2017
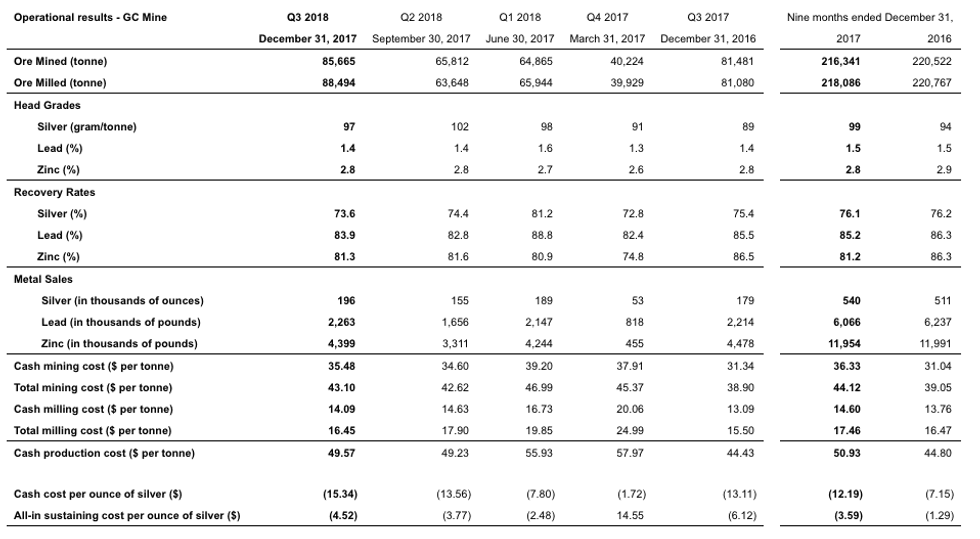
In Q3 Fiscal 2018, the total ore mined at the GC Mine was 85,665 tonnes, an increase of 4,184 tonnes or 5%, compared to 81,481 tonnes mined in Q3 Fiscal 2017, while ore milled increased by 9% to 88,494 tonnes from 81,080 tonnes in the prior year quarter.
Head grades were 97 g/t for silver, 1.4% for lead, and 2.8% for zinc compared to 89 g/t for silver, 1.4% for lead, and 2.8% for zinc in the prior year quarter.
The GC Mine sold 196 thousand ounces of silver, 2.3 million pounds of lead, 4.4 million pounds of zinc, compared to 179 thousand ounces of silver, 2.2 million pounds of lead, and 4.5 million pounds of zinc sold in the prior year quarter.
Total and cash mining costs per tonne at the GC Mine in Q3 Fiscal 2018 were $43.10 and $35.48 per tonne, compared to $38.90 and $31.34 per tonne in Q3 Fiscal 2017. The increase in cash mining costs was mainly due to: i) a $0.2 millionincrease in mining preparation costs resulting from more underground drilling expensed in the current quarter, and ii) a $0.2 million increase in mining contractor fees.
Total and cash milling costs per tonne at the GC Mine in Q3 Fiscal 2018 were $16.45 and $14.09, compared to $15.50 and $13.09, respectively, in Q3 Fiscal 2017. The increase in milling costs was mainly due to a $0.2 million increase in raw material supply costs.
Correspondingly, the cash production costs per tonne of ore processed in Q3 Fiscal 2018 at the GC Mine increased to $49.57 from $44.43 in the prior year quarter.
Cash costs per ounce of silver, net of by-product credits, at the GC Mine, was negative $15.34 compared to negative $13.11in the prior year quarter. The improvement was mainly due to a $1.4 million or 23% increase in by-product credits resulting from a 12% and 37% increase in net realized lead and zinc selling prices at the GC Mine.
All in sustaining costs per ounce of silver, net of by-product credits, in Q3 Fiscal 2018 at the GC Mine was negative $4.52compared to negative $6.12 in the prior year quarter.
Approximately 7,770 m or $0.4 million of underground diamond drilling (Q3 Fiscal 2017 – 3,935 m or $0.2 million) and 5,053 m or $1.2 million of tunnelling (Q3 Fiscal 2017 – 4,640 m or $1.3 million) were completed and expensed as mining preparation costs at the GC Mine. In addition, approximately 17 m or $0.1 million of horizontal tunnel, raises and declines (Q3 Fiscal 2017 – 554 m or $0.3 million) were completed and capitalized.
(ii) Nine months ended December 31, 2017 vs Nine months ended December 31, 2016
For the nine months ended December 31, 2017, a total of 216,341 tonnes of ore were mined and 218,086 tonnes were milled at the GC Mine compared to 220,522 tonnes mined and 220,767 tonnes milled in the same prior year period.
Average head grades were 99 g/t for silver, 1.5% for lead, and 2.8% for zinc compared to 94 g/t for silver, 1.5% for lead, and 2.9% for zinc, respectively, in the same prior year period.
Metals sold were 540 thousand ounces of silver, 6.1 million pounds of lead, and 12.0 million pounds of zinc, compared to 511 thousand ounces of silver, 6.2 million pounds of lead, and 12.0 million pounds of zinc in the same prior year period.
The cash mining costs at the GC Mine was $36.33 per tonne, an increase of 17% compared to $31.04 per tonne in the same prior year period. The increase in cash mining costs was mainly due to a $0.9 million increase in mining preparation costs as more underground drilling and tunnelling was expensed in the current period.
The cash milling costs was $14.60 per tonne, an increase of 6% compared to $13.76 in the same prior year period.
Cash costs per ounce of silver and all in sustaining costs per ounce of silver, net of by-product credits, were negative $12.19 and negative $3.59 respectively, compared to negative $7.15 and $1.29 in the same prior year period. The improvement is mainly due to higher by-product credits achieved arising from a 12% and 37% increase, respectively, in lead and zinc realized selling prices.
Approximately 18,253 m or $0.9 million of underground diamond drilling (same prior year period – 9,489 m or $0.6 million) and 14,285 m or $3.8 million of tunnelling (same prior year period – 11,976 m or $3.2 million) were completed and expensed as mining preparation costs at the GC Mine. In addition, approximately 280 m or $0.2 million of horizontal tunnel, raise, and declines (same prior year period – 1,685 m or $0.7 million) were completed and capitalized.
FISCAL 2019 PRODUCTION AND CASH COST GUIDANCE
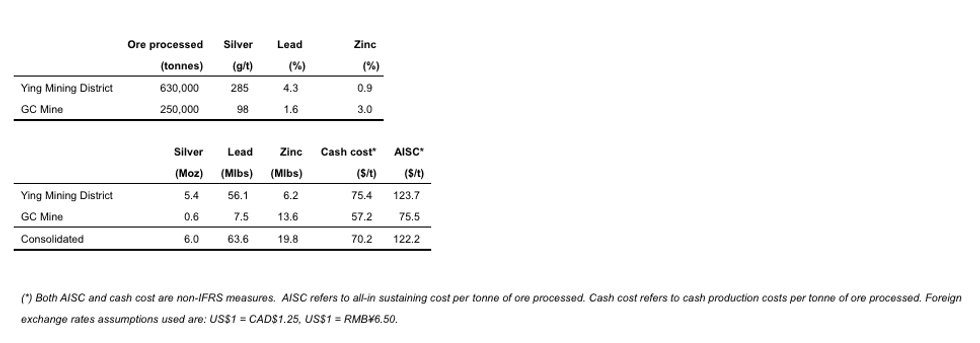
In Fiscal 2019, the Company expects to process approximately 880,000 tonnes of ore, yielding 6.0 million ounces of silver, 63.6 million pounds of lead, and 19.8 million pounds of zinc. Fiscal 2019 production guidance represents an increase of approximately 4% in silver production, 1% in lead production, and 8% in zinc production compared to the prior year’s guidance released on February 2, 2017.
1. Ying Mining District, Henan Province, China
In Fiscal 2019, Ying Mining District plans to mine and process 630,000 tonnes of ore averaging 285 g/t silver, 4.3% lead, and 0.9% zinc with expected metal production of 5.4 million ounces of silver, 56.1 million pounds of lead, and 6.2 million pounds of zinc. Fiscal 2019 production guidance at the Ying Mining District represents an increase of approximately 4% in silver head grade and 2% in lead head grade compared to prior year’s guidance. Metal production is comparable to prior year’s guidance.
The cash production costs is expected to be $75.4 per tonne of ore, and the all-in sustaining costs is estimated at $123.7per tonne of ore processed.
Capital expenditures at the Ying Mining District in Fiscal 2019 are budgeted at $31.8 million, including $23.2 million for mine tunnelling and ramp development and $8.6 million for equipment and infrastructure.
2. GC Mine, Guangdong Province, China
In Fiscal 2019, GC Mine plans to mine and process 250,000 tonnes of ore averaging 98 g/t silver, 1.6% lead, and 3.0% zinc with expected metal production of 0.6 million ounces of silver, 7.5 million pounds of lead and 13.6 million pounds of zinc. Fiscal 2019 represents an increase of approximately 50% in silver production, 6% in lead production, and 11% in zinc production.
The cash production costs is expected to be $57.2 per tonne of ore, and the all-in sustaining costs would be $57.2 per tonne of ore processed.
Capital expenditures at GC Mine in Fiscal 2019 are budgeted at $3.0 million, including $1.7 million for mine tunnelling and ramp development and $1.3 million for equipment and infrastructure.
Mr. JianZhao Yin, P.Geo., is the Qualified Person for Silvercorp under NI 43-101 and has reviewed and given consent to the technical information contained in this news release.
This earnings release should be read in conjunction with the Company’s Management Discussion & Analysis, Financial Statements and Notes to Financial Statements for the corresponding period, which have been posted on SEDAR at www.sedar.com and are also available on the Company’s website at www.silvercorp.ca. All figures are in United States dollars unless otherwise stated.
About Silvercorp
Silvercorp is a low-cost silver-producing Canadian mining company with multiple mines in China. The Company’s vision is to deliver shareholder value by focusing on the acquisition of under developed projects with resource potential and the ability to grow organically. For more information, please visit our website at www.silvercorp.ca.
CAUTIONARY DISCLAIMER – FORWARD LOOKING STATEMENTS
Certain of the statements and information in this press release constitute “forward-looking statements” within the meaning of the United States Private Securities Litigation Reform Act of 1995 and “forward-looking information” within the meaning of applicable Canadian provincial securities laws. Any statements or information that express or involve discussions with respect to predictions, expectations, beliefs, plans, projections, objectives, assumptions or future events or performance (often, but not always, using words or phrases such as “expects”, “is expected”, “anticipates”, “believes”, “plans”, “projects”, “estimates”, “assumes”, “intends”, “strategies”, “targets”, “goals”, “forecasts”, “objectives”, “budgets”, “schedules”, “potential” or variations thereof or stating that certain actions, events or results “may”, “could”, “would”, “might” or “will” be taken, occur or be achieved, or the negative of any of these terms and similar expressions) are not statements of historical fact and may be forward-looking statements or information. Forward-looking statements or information relate to, among other things: the price of silver and other metals; the accuracy of mineral resource and mineral reserve estimates at the Company’s material properties; the sufficiency of the Company’s capital to finance the Company’s operations; estimates of the Company’s revenues and capital expenditures; estimated production from the Company’s mines in the Ying Mining District; timing of receipt of permits and regulatory approvals; availability of funds from production to finance the Company’s operations; and access to and availability of funding for future construction, use of proceeds from any financing and development of the Company’s properties.
Forward-looking statements or information are subject to a variety of known and unknown risks, uncertainties and other factors that could cause actual events or results to differ from those reflected in the forward-looking statements or information, including, without limitation, risks relating to: fluctuating commodity prices; calculation of resources, reserves and mineralization and precious and base metal recovery; interpretations and assumptions of mineral resource and mineral reserve estimates; exploration and development programs; feasibility and engineering reports; permits and licences; title to properties; property interests; joint venture partners; acquisition of commercially mineable mineral rights; financing; recent market events and conditions; economic factors affecting the Company; timing, estimated amount, capital and operating expenditures and economic returns of future production; integration of future acquisitions into the Company’s existing operations; competition; operations and political conditions; regulatory environment in China and Canada; environmental risks; foreign exchange rate fluctuations; insurance; risks and hazards of mining operations; key personnel; conflicts of interest; dependence on management; internal control over financial reporting as per the requirements of the Sarbanes-Oxley Act; and bringing actions and enforcing judgments under U.S. securities laws.
This list is not exhaustive of the factors that may affect any of the Company’s forward-looking statements or information. Forward-looking statements or information are statements about the future and are inherently uncertain, and actual achievements of the Company or other future events or conditions may differ materially from those reflected in the forward-looking statements or information due to a variety of risks, uncertainties and other factors, including, without limitation, those referred to in the Company’s Annual Information Form for the year ended March 31, 2017 under the heading “Risk Factors”. Although the Company has attempted to identify important factors that could cause actual results to differ materially, there may be other factors that cause results not to be as anticipated, estimated, described or intended. Accordingly, readers should not place undue reliance on forward-looking statements or information.
The Company’s forward-looking statements and information are based on the assumptions, beliefs, expectations and opinions of management as of the date of this press release, and other than as required by applicable securities laws, the Company does not assume any obligation to update forward-looking statements and information if circumstances or management’s assumptions, beliefs, expectations or opinions should change, or changes in any other events affecting such statements or information. For the reasons set forth above, investors should not place undue reliance on forward-looking statements and information.
Source: www.prnewswire.com