The Conversation (0)
Sep. 20, 2017 04:40PM PST
Silver is at an interesting inflection point, with most signs pointing to higher highs, says Terry Yaremchuk in this article.
Silver recently broke a downtrend that has been in effect since an interim high of US$21.20 per ounce on July 4, 2016. Silver has largely trended down since then, trading as low as US$15.15 on July 10 of this year, but recently started rallying — as shown in the daily chart below, the metal broke through its downtrend to briefly trade above US$18. Silver is now testing the trend line for support, and if support can hold at this level the next level of upside resistance for silver is between US$18.50 and US$18.75.
Strength in silver is a little counterintuitive. Silver, as with many commodities, generally trades inversely to the US dollar (refer here for my recent article titled “An Interim Bottom for the US dollar Index”), the latter of which looks to be oversold and due for a relief rally. I say generally because it is not a perfect relationship, and there is historical precedent for silver and gold to move in the same direction as the US dollar and sometimes for an extended period; however, the normal relationship is of an inverse nature.
Silver — daily
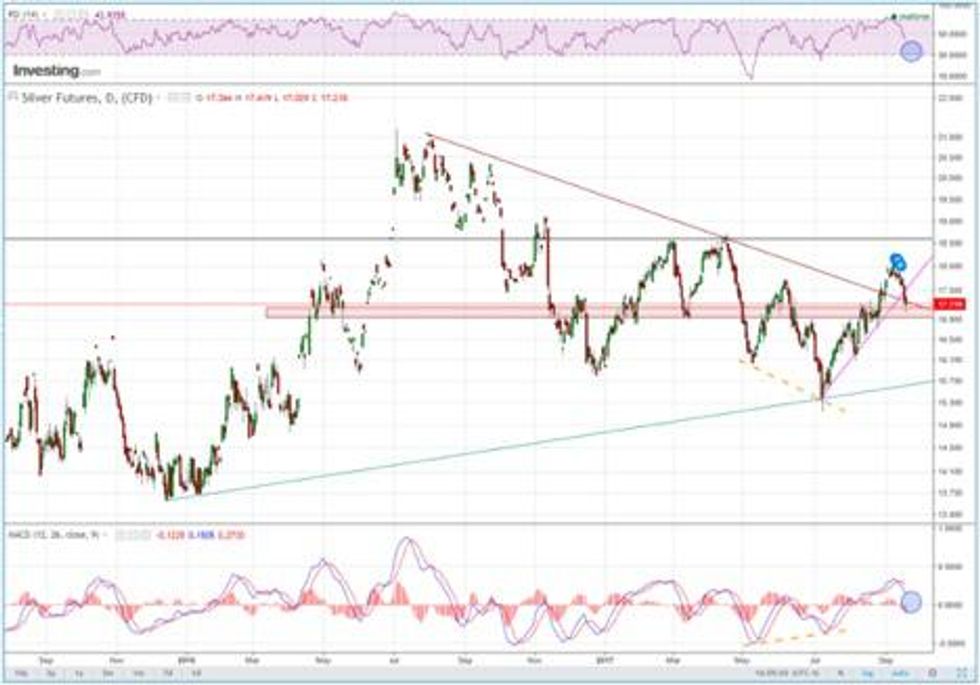
Source: Investing.com, September 20, 2017
Points of interest in the daily chart are the red downward sloping trend line, the red shaded congestion zone, the orange dashed lines and the blue circles. The orange dashed lines are indicative of positive divergence between price and MACD (moving average convergence divergence), which coupled with extreme oversold readings present in MACD and RSI (relative strength index), accompanied the rally from US$15 to US$18.
What to watch now is the blue circles for bottoming of RSI and a flattening of the MACD curve. Concurrent with a reversal in RSI and MACD would be an expectation for price to hold support at or above the shaded congestion area. If that proves the case, silver could challenge resistance above US$18.50. A violation of support in the shaded congestion zone would bring the likelihood of sub-US$16 back into the picture.
Silver — weekly
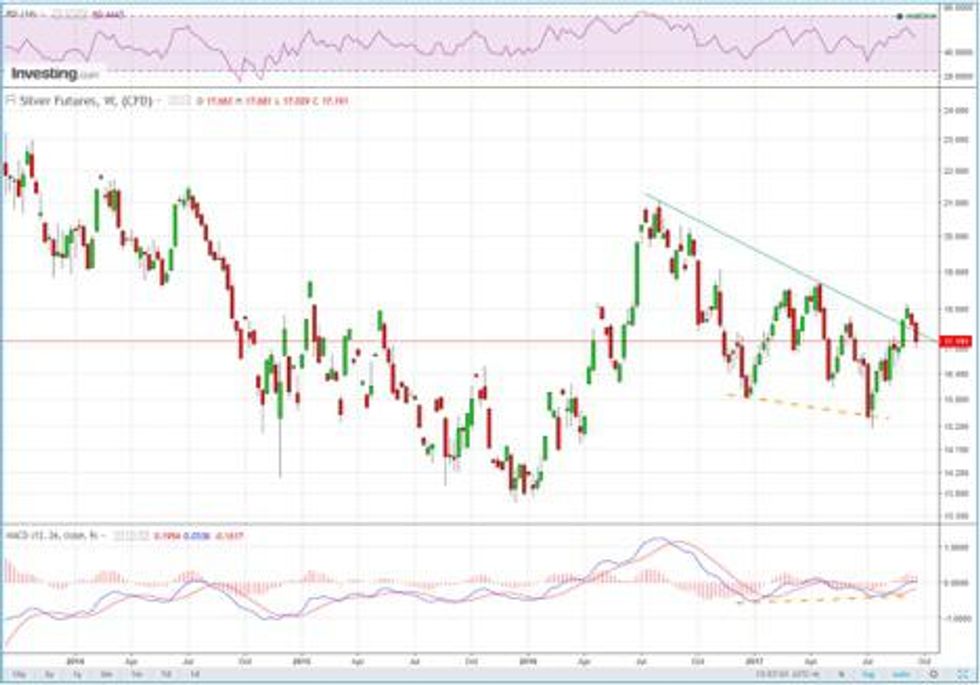
Source: Investing.com, September 20, 2017
As in the daily chart, a positive divergence between MACD and price is present from a weekly perspective. Generally this indicator is more reliable when present in longer timeframe analysis, suggesting an upward bias remains in effect on a longer-term basis.
Conclusion
Silver is at an interesting inflection point, with most signs pointing to higher highs. In the bull case, if silver can hold support, US$18.50 becomes a reasonable target. Failure to hold support would likely be accompanied by technical selling, confirming a bull trap, and it would not be a stretch to expect sub-$16 prices for silver.
Terry Yaremchuk is an Investment Advisor and Futures Trading representative with the Chippingham Financial Group. Terry offers wealth management and commodities trading services. Specific questions regarding a document can be directed to Terry Yaremchuk. Terry can be reached at tyaremchuk@chippingham.com.
This article is not a recommendation or financial advice and is meant for information purposes only. There is inherit risk with all investing and individuals should speak with their financial advisor to determine if any investment is within their own investment objectives and risk tolerance.
All of the information provided is believed to be accurate and reliable; however, the author and Chippingham assumes no responsibility for any error or responsibility for the use of the information provided. The inclusion of links from this site does not imply endorsement.