
The Conversation (0)
Aug. 25, 2015 11:36AM PST
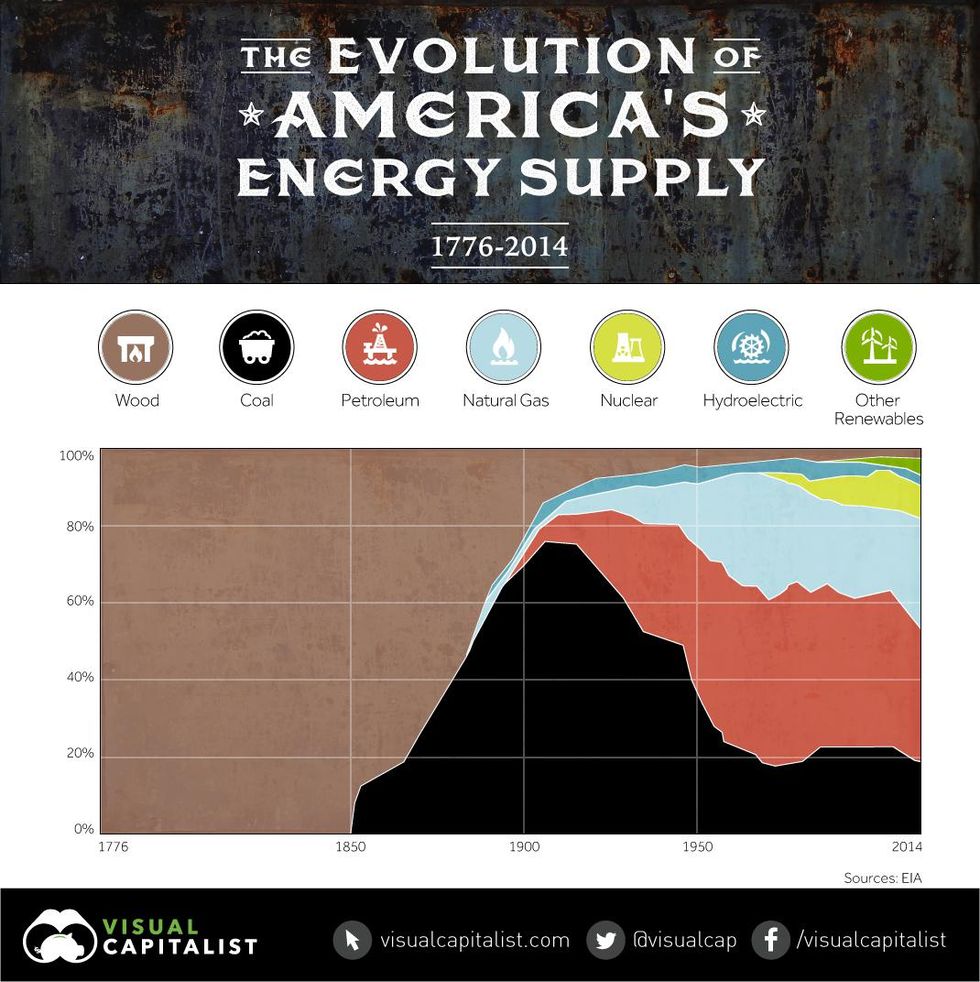
The latest infographic from Visual Capitalist took data from the Energy Information Administration (EIA) to create a chart on on the history of America’s energy supply dating back to the year 1776.
The latest infographic from Visual Capitalist took data from the Energy Information Administration (EIA) to create a chart on on the history of America’s energy supply dating back to the year 1776.
Click here to view the chart on the Visual Capitalist website.
Courtesy of: Visual Capitalist