The Conversation (0)
Terry Yaremchuk outlines the technical indicators he applies when analyzing a chart, and draws attention to key inflection points for bitcoin.
2017 was quite the year for bitcoin. The cryptocurrency started the year trading at approximately US$1,000 per token (already over five times the interim low since the previous all-time high just shy of $1,200), and by year end had peaked at almost $20,000.
The parabolic rise in bitcoin coincided with the introduction of bitcoin futures on December 17, 2017, which was followed by a ferocious blow off. Bitcoin has since undergone a massive and volatile correction, and is currently trading between $12,500 and $10,000. While the low-hanging fruit appears to have been picked, there are still opportunities to take advantage of bitcoin’s volatility. In this article, I will introduce a couple of the technical indicators I apply when analyzing a chart and draw attention to inflection points to be mindful of.
Nothing goes up or down in a straight line, and when a trend changes how should you know where to buy or sell? In the case of bitcoin, as the parabolic rise was reaching its nadir, a technical indicator was developing that often coincides with interim highs. Negative divergence was flashing a warning signal on the five-hour chart back in early December. Negative divergence is when price reaches higher highs coincident with lower lows on a moving average algorithm called MACD (moving average convergence divergence), indicated by the orange dashed lines below.
Five-hour chart
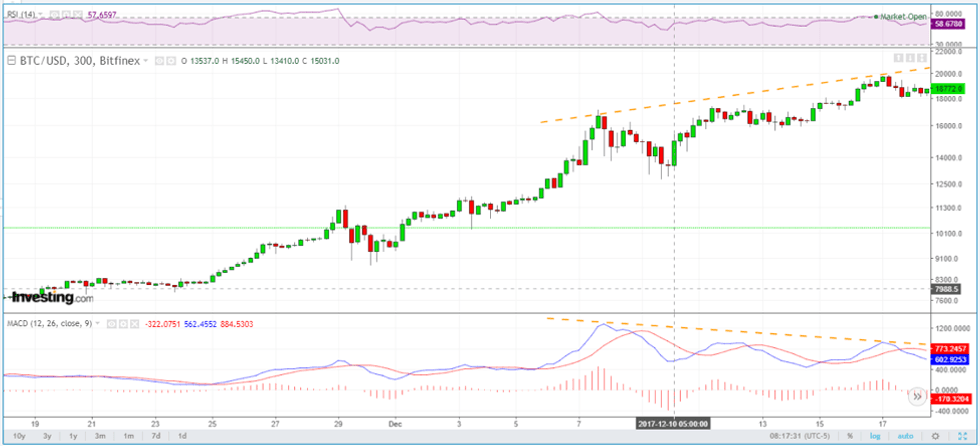
Source: Investing.com, January 31, 2018
While statistically this is a reliable predictor, confirmation of a break of support should precede action. So where is support? Usually previous highs and/or trend lines are areas to expect buyers to step in. Another useful tool measures retracement levels between interim lows and interim highs as a function of a mathematical phenomenon.
It is common for corrections to retrace 38 percent, 50 percent or even 62 percent (all derivatives of Fibonacci) of a previous move. On the chart below, $12,380, $10,050 and $7,715 correspond to those levels based on the move from $165 to $20,000. Not surprisingly, those levels have been acting as support and resistance levels as seen below in the daily chart. The psychological $10,000 level is also coincident with the red uptrend line.
Daily chart
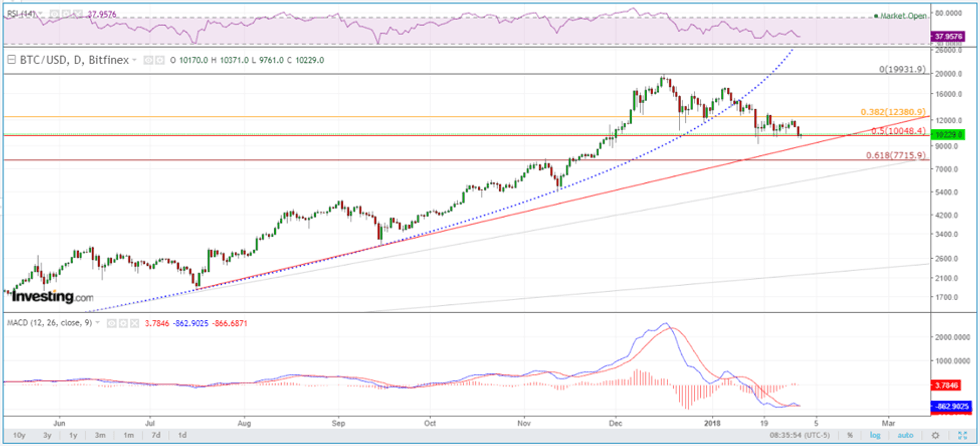
Source: Investing.com, January 31, 2018
As a trader, my comfort level is to buy and sell inflection points and have stop losses in place to guard against contrary moves.
Conclusion
Since breaking down from its parabolic rise, bitcoin has been testing support levels, and first support is in the vicinity of $10,000. If this level holds, expect bitcoin to be rangebound between $10,000 and $12,500 until either support or resistance is broken. On the downside, the next levels of support are approximately $7,500 and $5,000. On the upside, resistance is approximately $13,000 and then $17,000.
Terry Yaremchuk is an Investment Advisor and Futures Trading representative with the Chippingham Financial Group. Terry offers wealth management and commodities trading services. Specific questions regarding a document can be directed to Terry Yaremchuk. Terry can be reached at tyaremchuk@chippingham.com.
This article is not a recommendation or financial advice and is meant for information purposes only. There is inherit risk with all investing and individuals should speak with their financial advisor to determine if any investment is within their own investment objectives and risk tolerance.
All of the information provided is believed to be accurate and reliable; however, the author and Chippingham assumes no responsibility for any error or responsibility for the use of the information provided. The inclusion of links from this site does not imply endorsement.