The Conversation (0)
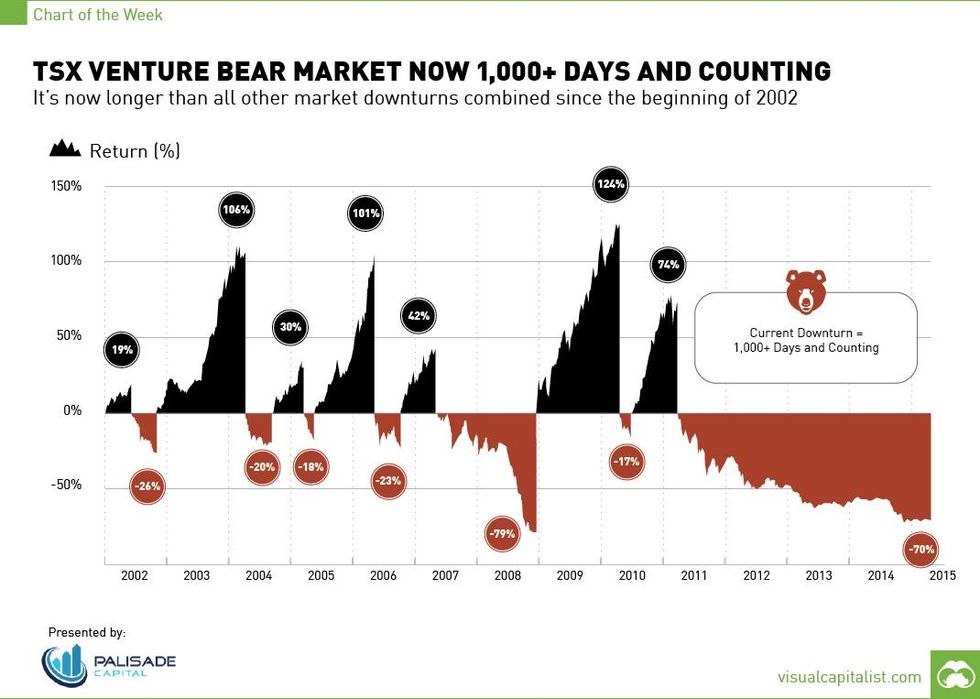
The latest chart infographic from Visual Capitalist uses a chart that breaks up all the S&P/TSX Venture Index booms and busts since the beginning of 2002.
The latest chart infographic from Visual Capitalist uses a chart that breaks up all the S&P/TSX Venture Index booms and busts since the beginning of 2002.
According to the chart, the previous downturns have all occurred over the course of 802 trading days, whereas the most recent bear market has now passed 1,000 trading days in length.
Click here to view the infographic on the Visual Capitalist website.
Courtesy of: Visual Capitalist