
The Conversation (0)
Apr. 03, 2015 04:00PM PST
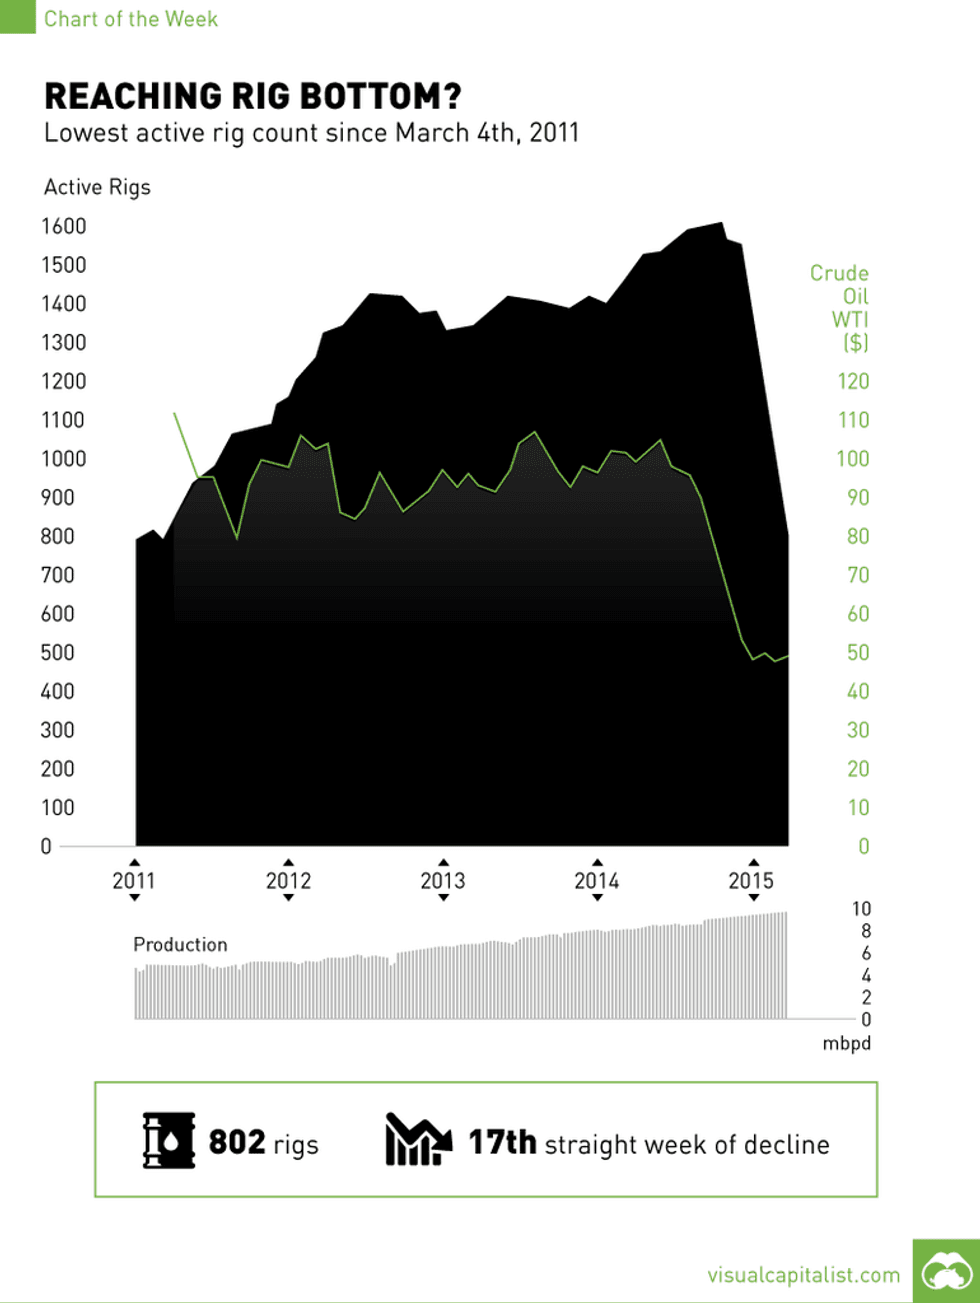
The latest infographic from Visual Capitalist takes a look at the number of operational oil rigs in the United States, which has declined for the seventeenth straight week
The latest infographic from Visual Capitalist takes a look at the number of operational oil rigs in the United States, which has declined for the seventeenth straight week. This also represents a 50 percent decline since last October, with the last time it reached this low point being four years ago on the week ending March 4, 2011. The production numbers haven’t been affected by the decrease in oil rigs however, with US production at its highest level since 1972 at 9.3 million barrels per day.
Click here to view the infographic on the Visual Capitalist website.
Courtesy of: Visual Capitalist