The Conversation (0)
When thinking about the big data market, it can certainly be overwhelming due to its vast, and somewhat complex, nature. To break it down a little, big data is defined as a volume of data that runs through a business on a daily basis. But, SAS.com states, “it’s not the amount of data that’s important. It’s what organizations do with the data that matters.”
That said, in a report written by Thomas H. Davenport and Jill Dyche from the International Institute of Analytics, titled “Big Data in Big Companies” found that big data used by larger companies is beneficial in a number of ways, including:
- cost reductions;
- improving the time it takes to do simple computing task; and
- supporting internal business decisions, to name a few.
As such, it should come as no surprise that investments in big data are climbing. In fact, it’s expected that global spending in this market will climb well over the $57 billion threshold in 2017 alone, and rising 10 percent on a yearly basis until 2020. By then, the Research and Markets report projects the industry to be worth $76 billion.
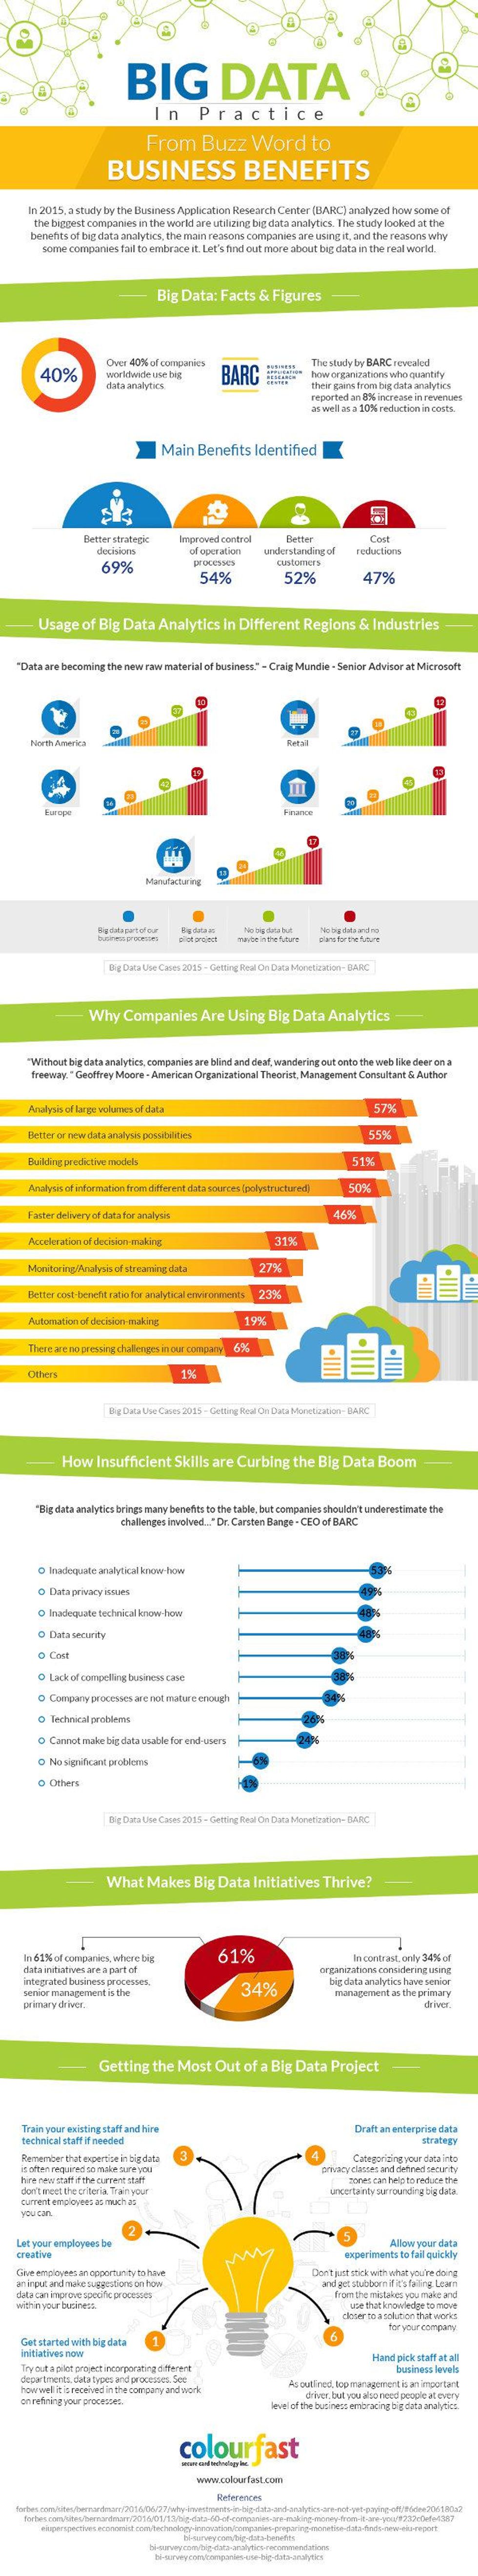
With that in mind, MarketingProfs put together an infographic titled “Big Data: From Buzzword to Business Benefits,” compiled of data from Colourfast, outlining what percentage of companies are using big data, some of the main benefits, and how big data is used in different regions, shown below.
Don’t forget to follow us @INN_Technology for real-time news updates!
Securities Disclosure: I, Jocelyn Aspa, hold no direct investment interest in any company mentioned in this article.