The Conversation (0)
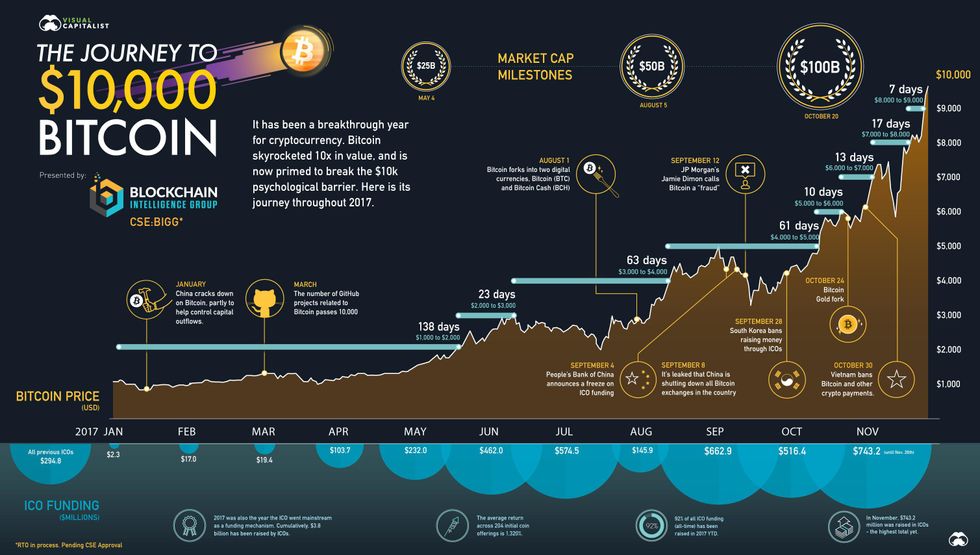
With bitcoin reaching an impressive milestone, this infographic provides an overview of some key events of the digital currency since the start of the year.
Digital currency bitcoin broke a new record this week by climbing above $10,000 for the first time in its short history, unofficially making 2017 the year of bitcoin.
By Wednesday morning (November 29), the cryptocurrency topped $11,000 to $11,377.33 as of 9:16 a.m. EST, although since then it’s stepped back under $10,000 to $9,679. Overall, since January bitcoin has soared roughly 950 percent.
That being said, however, with the year bitcoin has had it’s become (arguably) clear that the cryptocurrency will be a force to be reckoned with as an asset class in the years to come.
Since the start of the year, there has been an entire catalogue of key events tied to bitcoin, including:
- reaching over $1,000 for the first time in 1,124 days on January 2, 2017;
- surpassing $25 billion in market cap on May 4, 2017;
- forking into two currencies–bitcoin (BTC) and bitcoin cash (BCH) at the beginning of August;
- the People’s Bank of China announcing it will freeze ICO funding on September 4, 2017;
- surpassing the $100 billion market cap threshold on October 20, 2017;
- further splitting into two digital currencies, bitcoin (BTC) and bitcoin gold (BTG) on October 24, 2017; and
- soaring above $10,000 for the first time on November 28, 2017.
That’s not all, of course. Below is an infographic presented by Blockchain Intelligence Group and Visual Capitalist, showcasing bitcoin’s milestones throughout the year and how it reached $10,000.
Courtesy of: Visual Capitalist
Don’t forget to follow us @INN_Technology for real-time news updates!
Securities Disclosure: I, Jocelyn Aspa, hold no direct investment interest in any company mentioned in this article.
Securities Disclosure: I, Jocelyn Aspa, hold no direct investment interest in any company mentioned in this article.