The Conversation (2)
The US$ index fluctuated sideways inside an 18 month consolidation channel for the better part of 2016 ending the year on a very strong note post election.
The US$ index fluctuated sideways inside an 18 month consolidation channel for the better part of 2016 ending the year on a very strong note post election.
As mentioned previously the range for the DX had been bound by 92.50 on the low end and 100.40 as an upper bound. This followed a sharp one year gain in the value of the DX relative to it’s basket of benchmark currencies, a year that wreaked havoc on commodities and related economies inversely correlated to the US$ in the process.
Technical analysis can validate or repudiate expectations and by examining the collective actions of all participants in a market, we can observe whether the tide is ebbing or flooding and look for inflections that indicate potential tidal turning points.
US dollar index daily
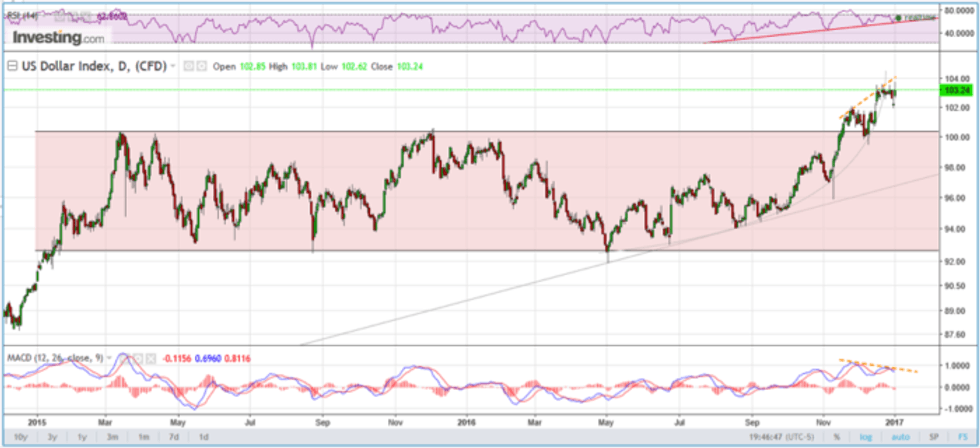 Source: Investing.com Jan 3, 2017
The daily technical chart has been giving off mixed signals since breaking out of the sideways channel. A breakout of this nature is typically a bullish event and should be indicative of a continuation of the previous trend. But… MACD is telegraphing negative divergence as shown by the orange dashed lines which is an early warning signal of a possible reversal. RSI is also showing signs of fatigue and a break below the red trend line would increase the likelihood that a reversal is manifesting. If the dollar does start to weaken, the upper bound of the pink consolidation channel at 100 will likely offer initial support. Only a close below that level will confirm a reversal and with the mixed bag of signals it’s still too early to make that declaration.
US dollar index daily
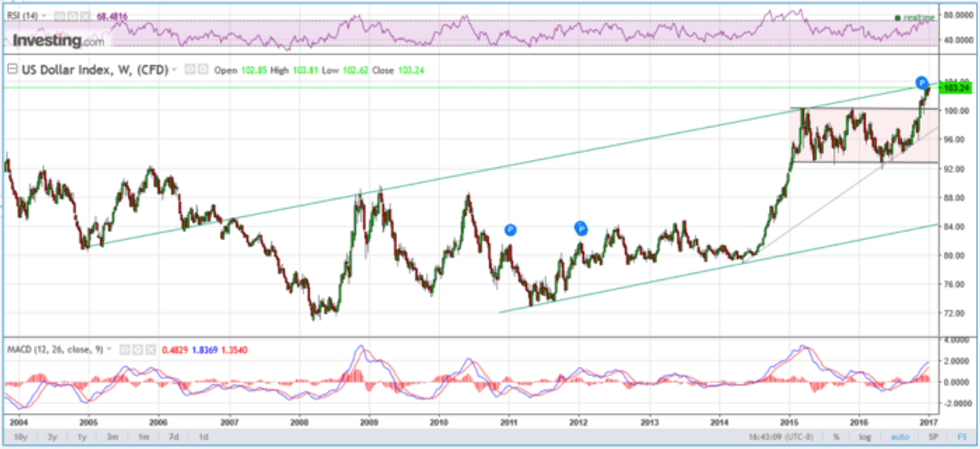 Source: Investing.com Jan 3, 2017
Similar to the daily chart, MACD is losing upside momentum on the weekly and is threatening to curl down. However, until MACD actually does roll over it isn’t valid from a technical perspective. It is worth paying close attention to though as negative divergence from price on the weekly chart is a much more powerful and reliable indicator than on the daily and tends to be indicative of interim inflection points. Also noteworthy is seeing RSI in overbought territory on a weekly basis. It is possible to stay overbought for an extended period but any weakness would further strengthen the bear case. Last but not least, upside resistance is coincident with a well established upward sloping trend boundary.
Conclusion
It is still too early to call an end to the US $ bull but the signs are certainly indicating that the path of least resistance is down with a potential tidal shift from flood to ebb. If this were to transpire the inverse relationship would be a boon to those commodities affected by that relationship. A close above 103.81 or below 100 will add more clarity to what is a muddy picture at this juncture.
Don’t forget to follow us at @INN_Resource for real time updates!
Terry Yaremchuk is an Investment Advisor and Futures Trading representative with the Chippingham Financial Group. Terry offers wealth management and commodities trading services. Specific questions regarding a document can be directed to Terry Yaremchuk. Terry can be reached at tyaremchuk@chippingham.com.
This article is not a recommendation or financial advice and is meant for information purposes only. There is inherit risk with all investing and individuals should speak with their financial advisor to determine if any investment is within their own investment objectives and risk tolerance.
All of the information provided is believed to be accurate and reliable; however, the author and Chippingham assumes no responsibility for any error or responsibility for the use of the information provided. The inclusion of links from this site does not imply endorsement.