The Conversation (0)
(all amounts in US dollars, unless otherwise noted)
Ero Copper Corp. (TSX: ERO, NYSE: ERO) ("Ero" or the "Company") is pleased to announce its operating and financial results for the three and six months ended June 30, 2024. Management will host a conference call tomorrow, Friday, August 2, 2024, at 11:30 a.m. eastern time to discuss the results. Dial-in details for the call can be found near the end of this press release.
HIGHLIGHTS
- The Company reached a major inflection point with the successful production of first saleable copper concentrate at the Tucumã Project in early Q3 2024. Ramp up to commercial production is now underway
- Second quarter copper production was 8,867 tonnes at C1 cash costs (*) of $2.16 per pound of copper produced
- Gold production during the quarter was 16,555 ounces at C1 cash costs (*) and All-in Sustaining Costs ("AISC") (*) of $428 and $842, respectively, per ounce produced
- Second quarter financial results were bolstered by stronger metal prices and a favorable exchange rate environment, which also contributed to another quarter of record gross profit at the Xavantina Operations
- Net loss attributable to the owners of the Company of $53.2 million, or $0.52 per share on a diluted basis
- Adjusted net income attributable to the owners of the Company (*) of $18.6 million, or $0.18 per share on a diluted basis
- Adjusted EBITDA (*) of $51.5 million
- Available liquidity at quarter-end was $169.8 million, including $44.8 million in cash and cash equivalents, $100.0 million of undrawn availability under the Company's senior secured revolving credit facility, and $25.0 million of undrawn availability under the copper prepayment facility, entered into in May 2024
(*) These are non-IFRS measures and do not have a standardized meaning prescribed by IFRS and might not be comparable to similar financial measures disclosed by other issuers. Please refer to the Company's discussion of Non-IFRS measures in its Management's Discussion and Analysis for the three and six months ended June 30, 2024 and the Reconciliation of Non-IFRS Measures section at the end of this press release.
- The Company is reaffirming full-year production and copper cash cost guidance and updating other 2024 guidance ranges to reflect H1 2024 performance, including exceptional year-to-date unit costs at the Xavantina Operations driven by elevated gold grades
- Gold C1 cash cost guidance is being reduced to $450 to $550 (from $550 to $650) per ounce of gold produced, and AISC guidance is being lowered to $900 to $1,000 (from $1,050 to $1,150) per ounce of gold produced
- Full-year capital expenditure guidance is being narrowed to $303 to $348 million (from $299 to $349 million)
"With the Tucumã Project ramping up to commercial production and the Xavantina Operations continuing to deliver exceptional operating results, we are on track to achieve record copper and gold production this year," said David Strang, Chief Executive Officer . "At the same time, gold prices continue to test new highs while gross profit margins in our copper business are benefiting from a historically tight concentrate market.
"This is an incredibly exciting time for our Company as the investments we've made over the last several years begin to yield tangible returns. Our team's hard work and dedication have positioned us to capitalize on these favorable market conditions and crystallize value for our shareholders."
SECOND QUARTER REVIEW
- Mining & Milling Operations
- The Caraíba Operations processed 957,692 tonnes of ore grading 1.03% copper, producing 8,867 tonnes of copper in concentrate for the quarter after metallurgical recoveries of 90.2%
- Mill throughput continued to benefit from the successful completion of the Caraíba mill expansion in late 2023 with tonnes processed up 12.2% quarter-on-quarter and 17.9% compared to Q4 2023
- Higher processed tonnage contributed to a 9.6% increase in copper production quarter-on-quarter
- The Xavantina Operations processed 40,446 tonnes of ore grading 14.00 grams per tonne, producing 16,555 ounces of gold in the quarter after metallurgical recoveries of 91.0%
- The Caraíba Operations processed 957,692 tonnes of ore grading 1.03% copper, producing 8,867 tonnes of copper in concentrate for the quarter after metallurgical recoveries of 90.2%
- Organic Growth Projects
- During the quarter and subsequent to quarter-end, the Company achieved several important milestones at the Tucumã Project, including the successful production of first saleable copper concentrate, which exceeded process design concentrate grade targets
- Production levels are projected to reach 80% of design mill capacity and 80% of design recovery rates by the end of Q3 2024
- At the Caraíba Operations, main shaft sinking at the Pilar Mine's new external shaft is progressing on schedule, with a projected depth of approximately 600 meters expected to be reached by year-end
- During the quarter and subsequent to quarter-end, the Company achieved several important milestones at the Tucumã Project, including the successful production of first saleable copper concentrate, which exceeded process design concentrate grade targets
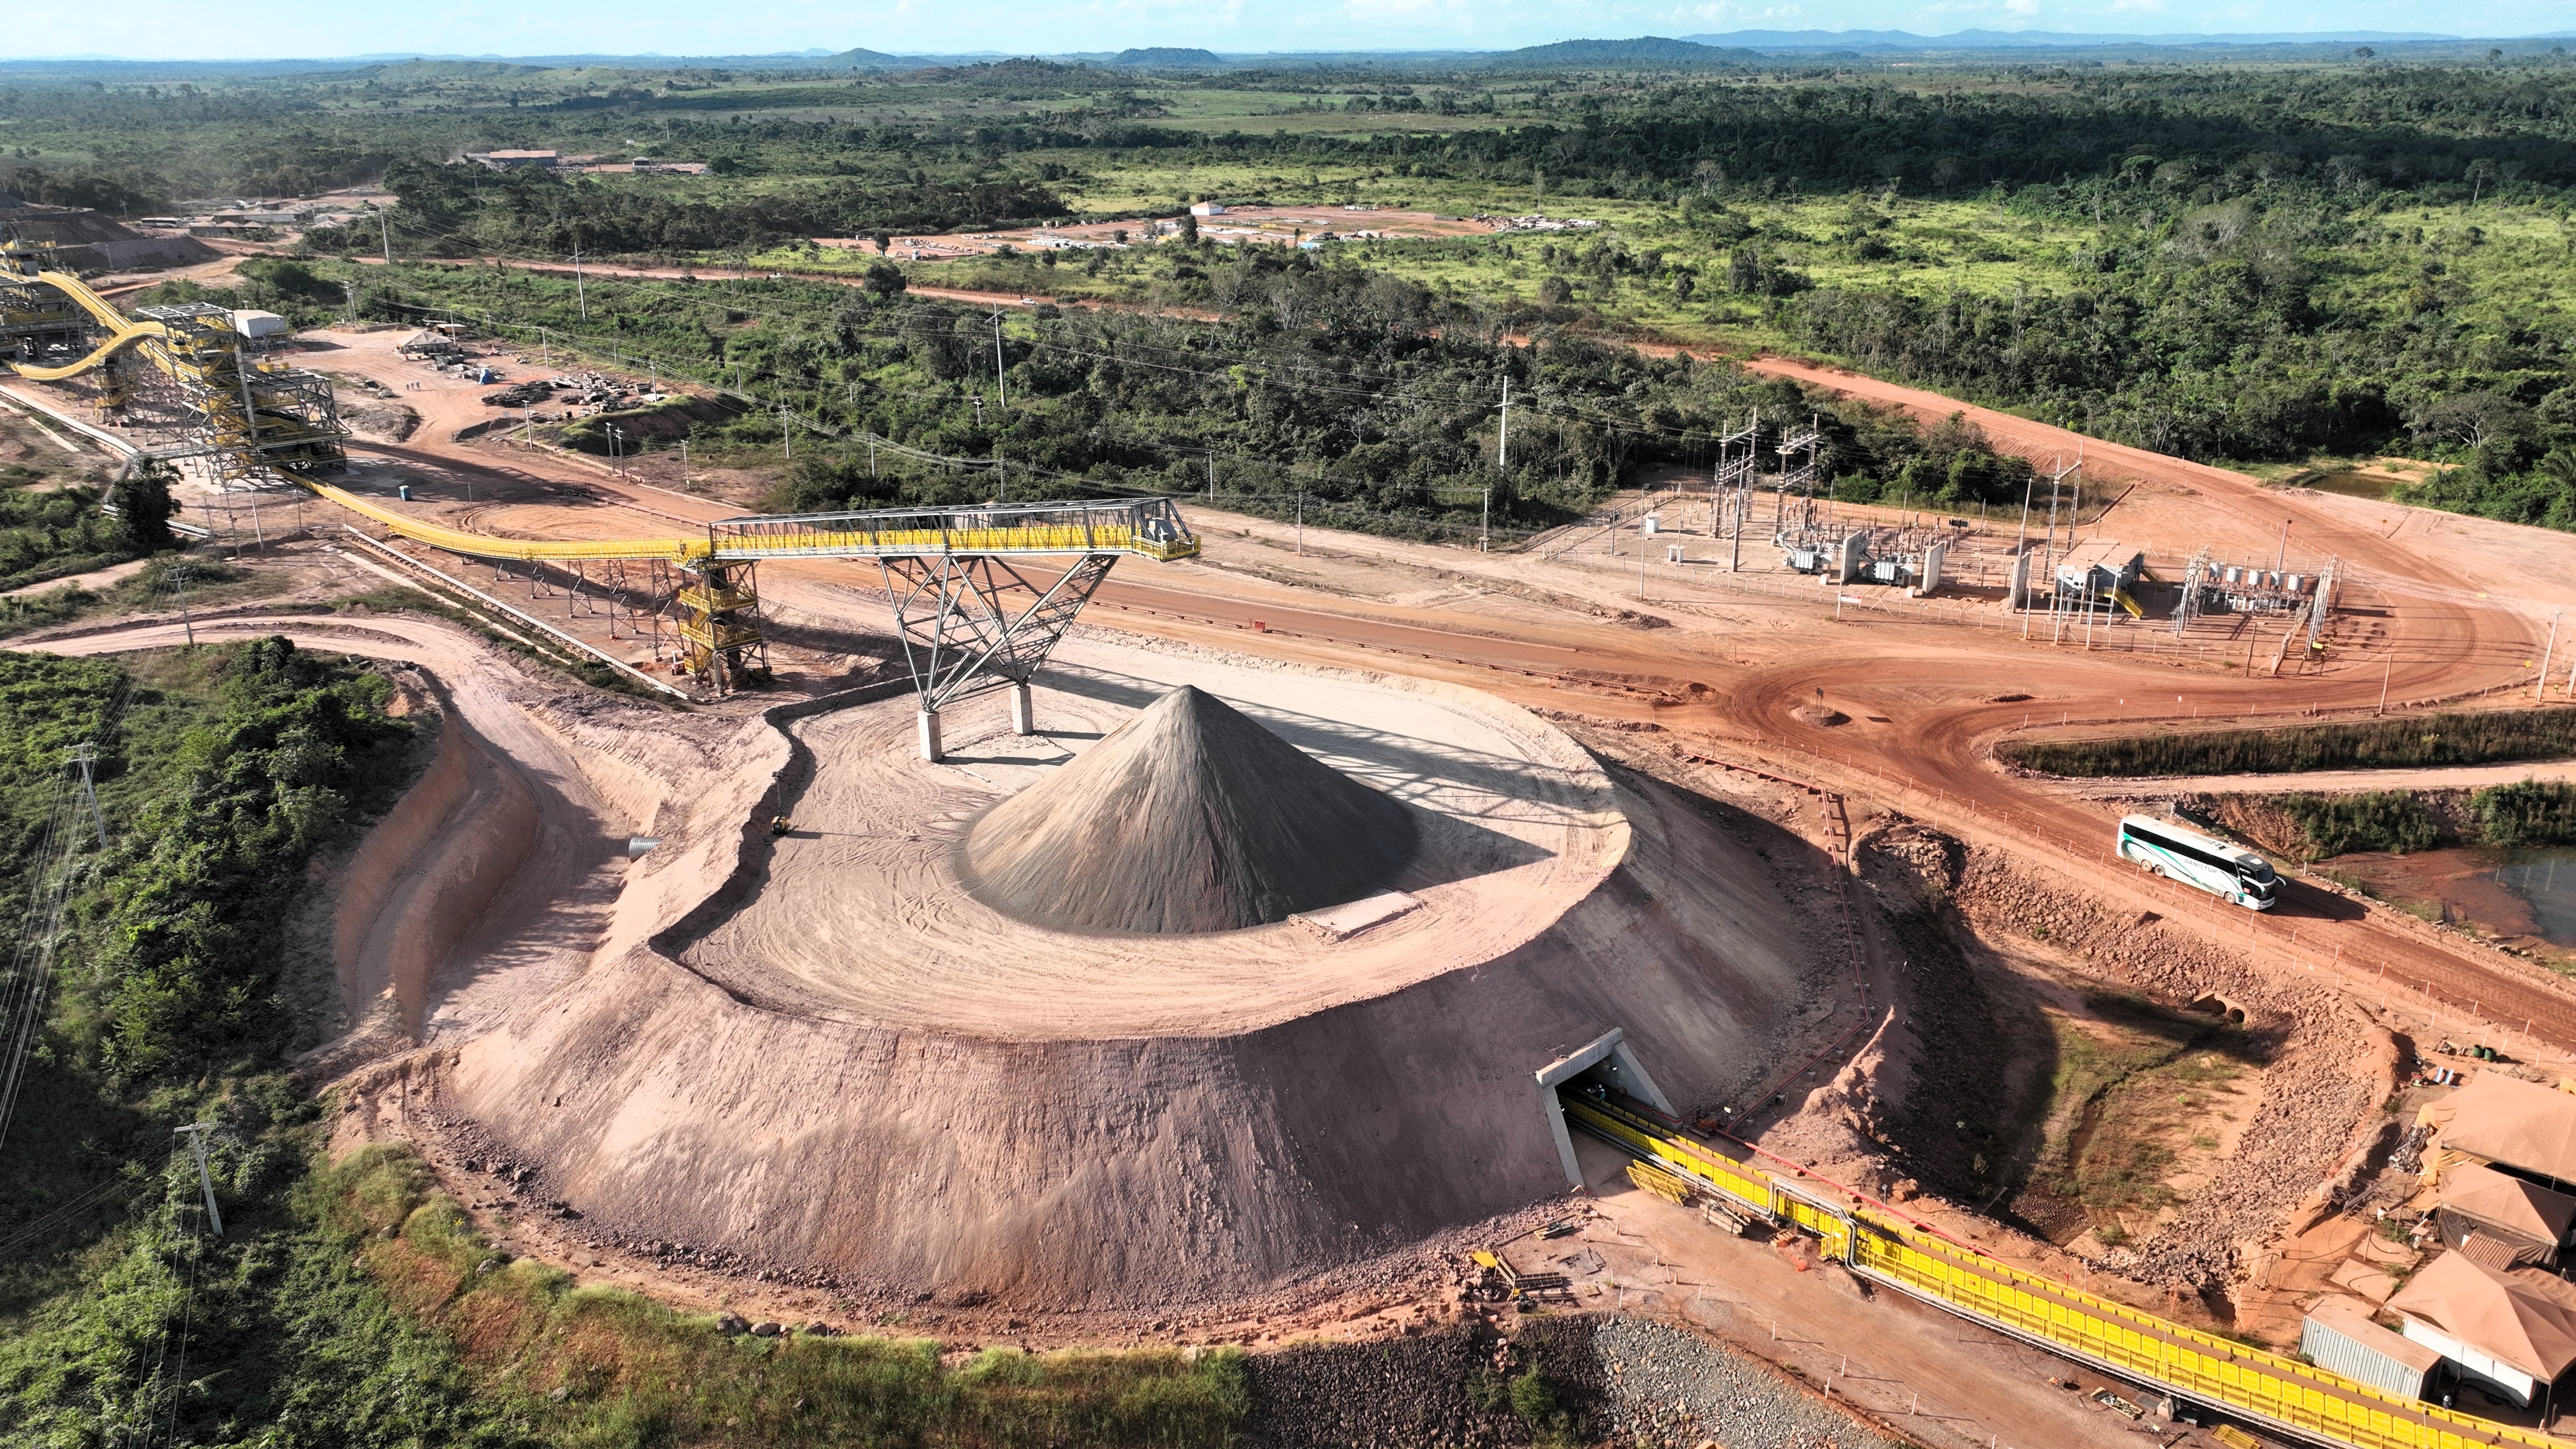
Figure 1: Crushed ore stockpile at the Tucumã Project (June 2024).
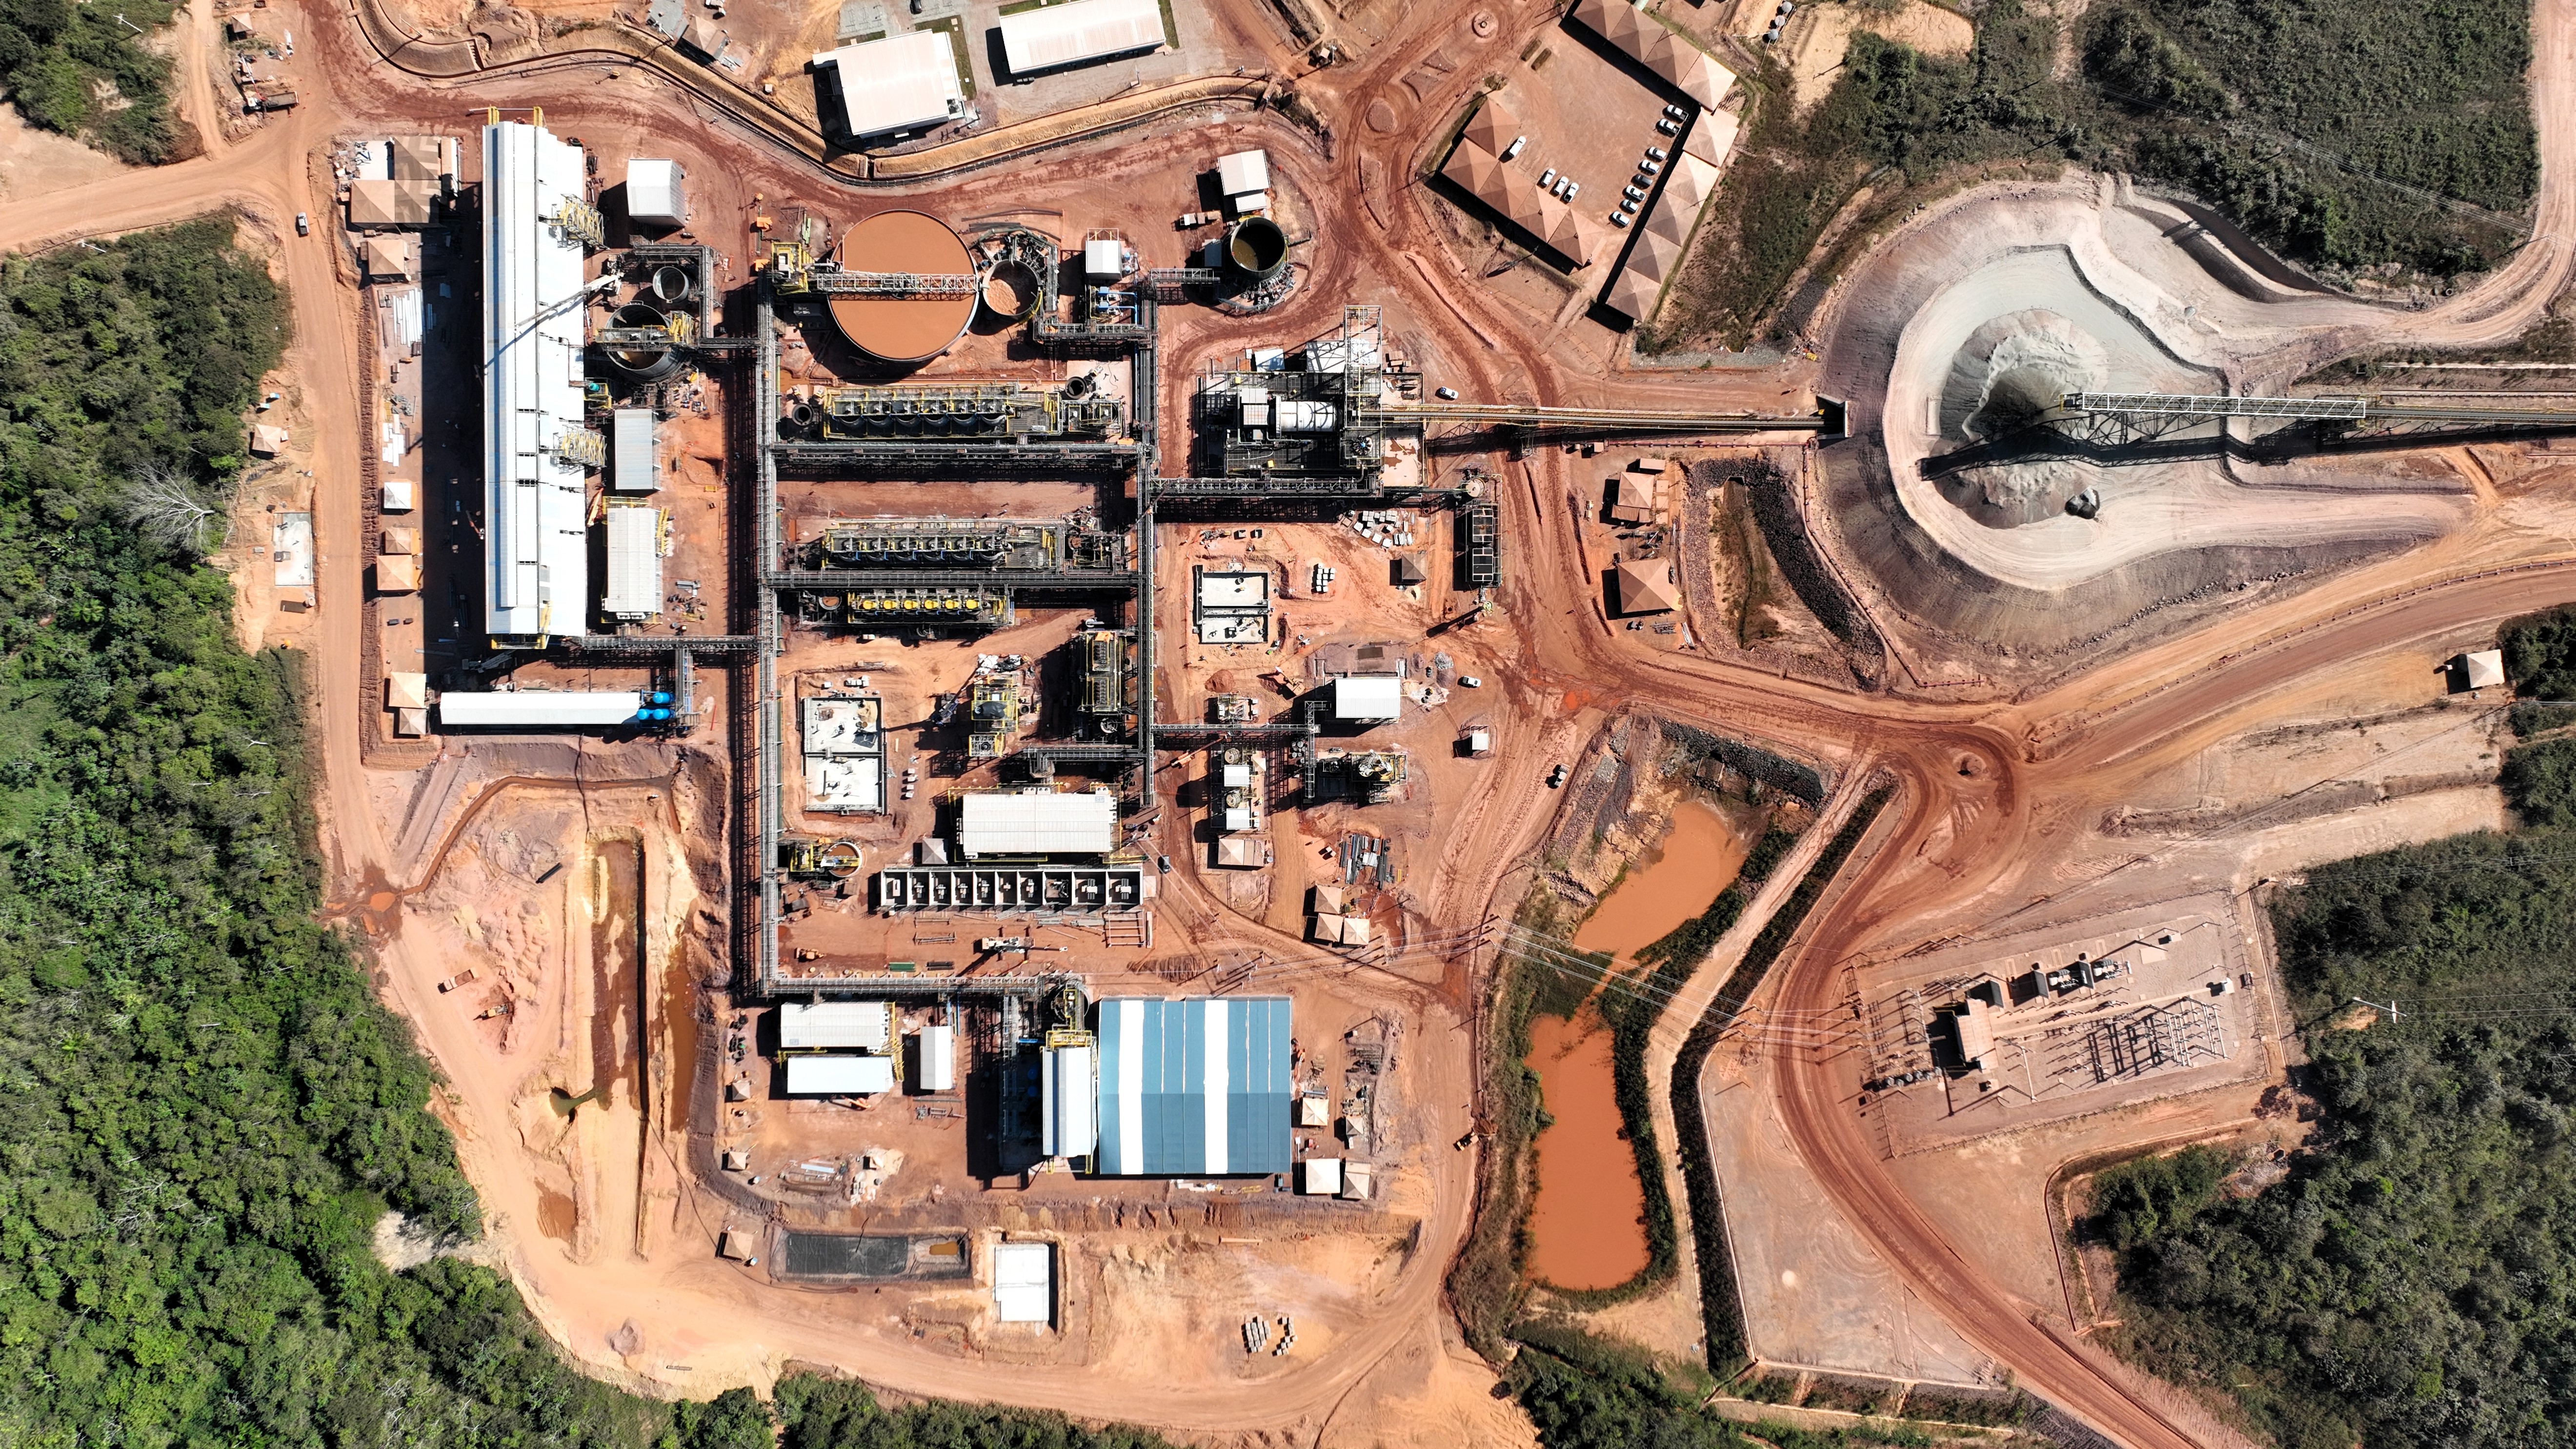
Figure 2: Aerial view of the Tucumã Project's process plant, including ball mill, flotation and filtration (center), concentrate shed (bottom), and crushed ore stockpile (right) (July 2024).
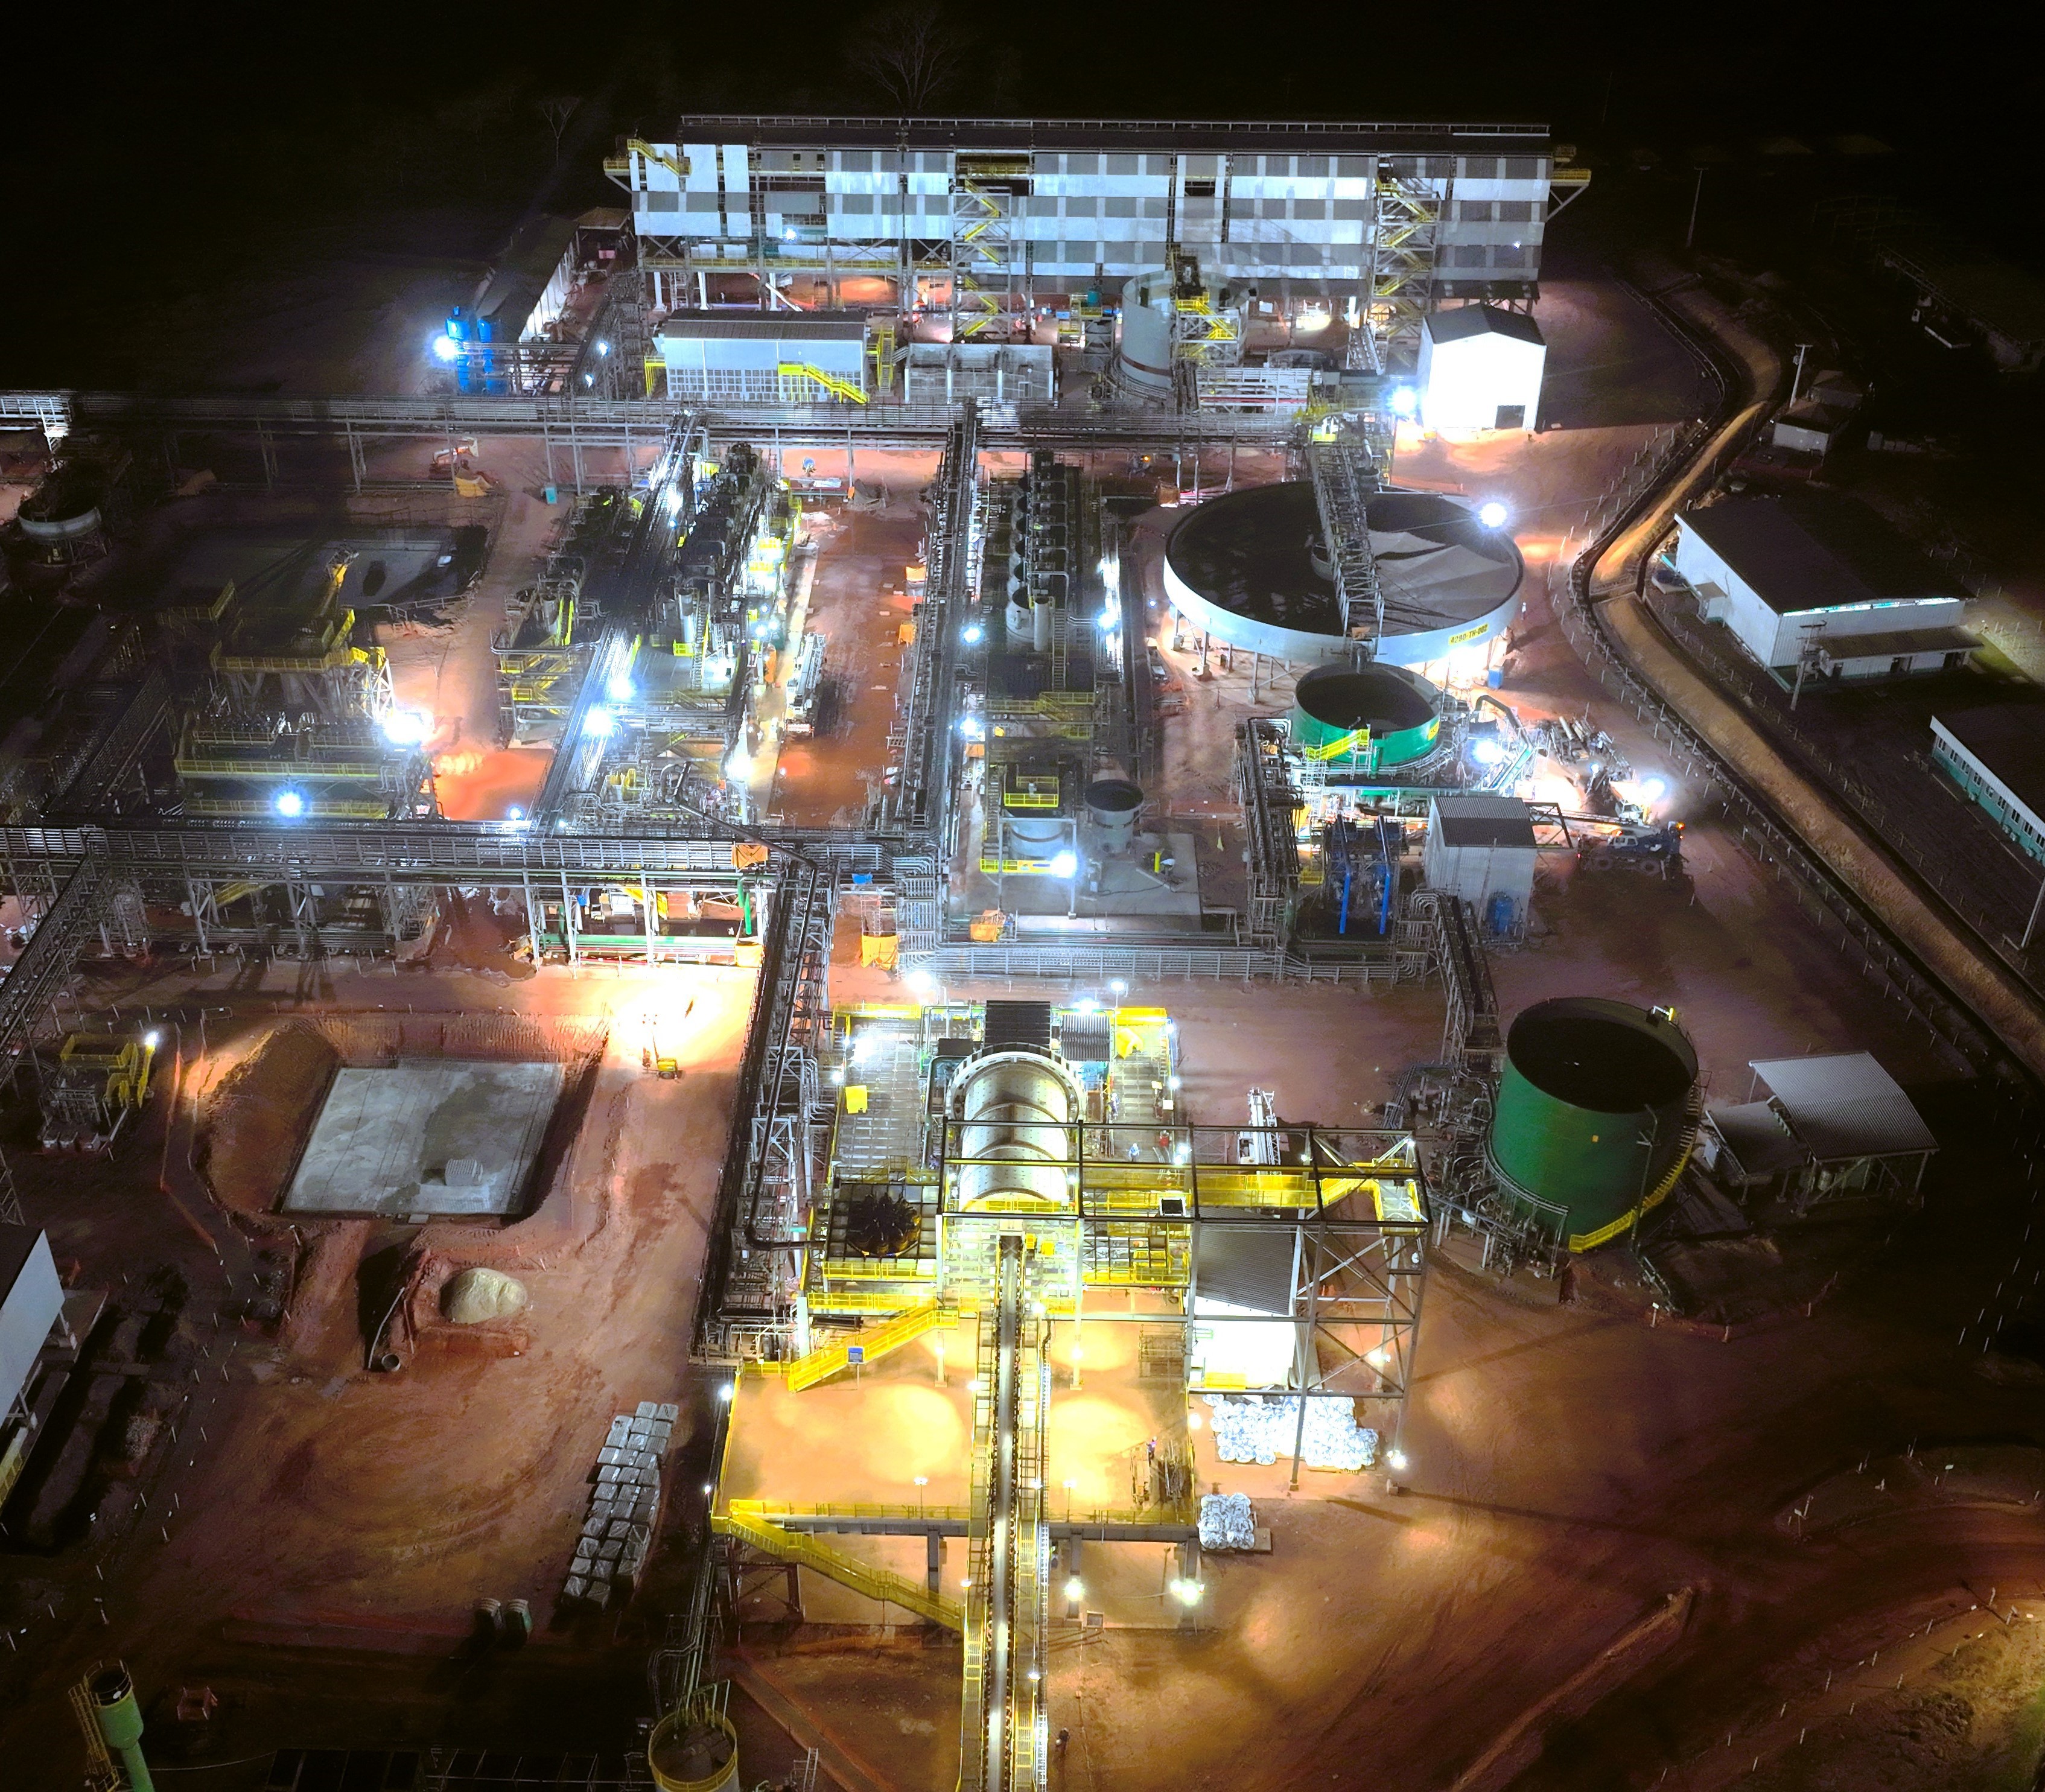
Figure 3: Night-time aerial view of the Tucumã Project's process plant, including ball mill, flotation and filtration, taken during the first 24-hour shift of continuous mill operations (July 2024).
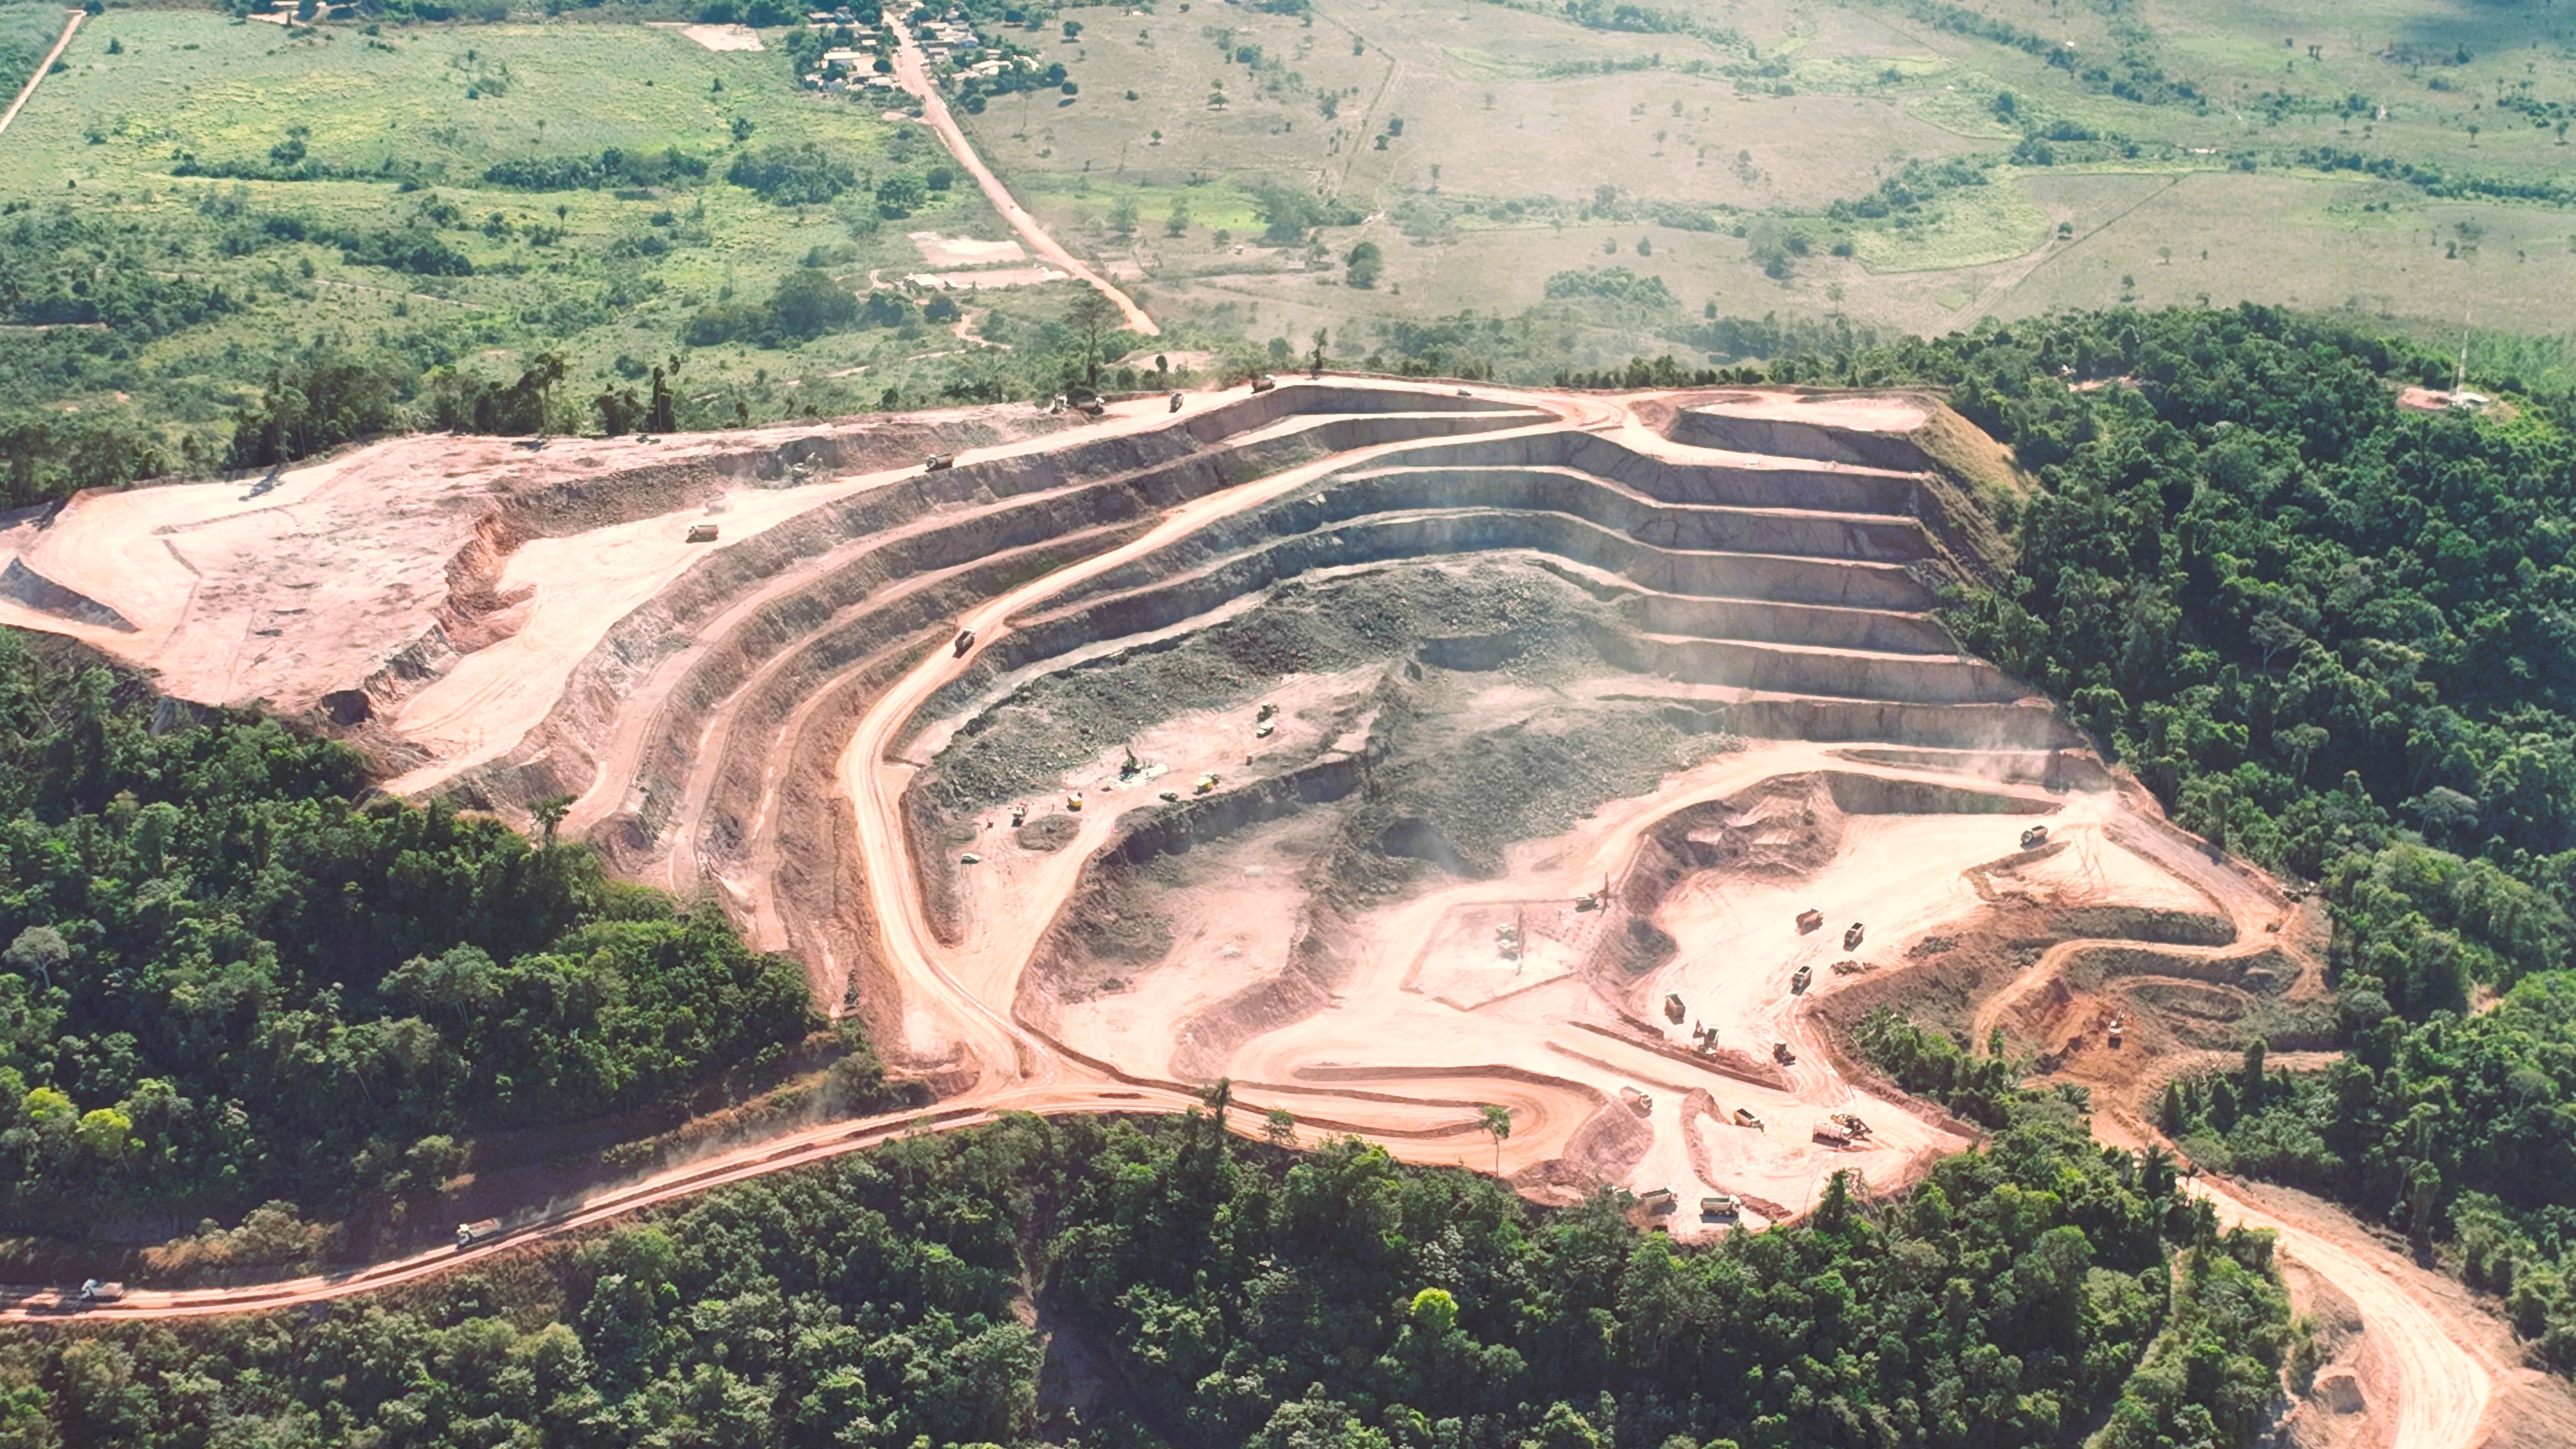
Figure 4: Mining of high-grade sulphide ore at the Tucumã Project (July 2024).
OPERATING AND FINANCIAL HIGHLIGHTS
| 2024 - Q2 | 2024 - Q1 | 2023 - Q2 | 2024 - YTD | 2023 - YTD | |||||||||
| Operating Highlights | |||||||||||||
| Copper (Caraíba Operations) | |||||||||||||
| Ore Processed (tonnes) | 957,692 | 853,371 | 840,821 | 1,811,063 | 1,613,369 | ||||||||
| Grade (% Cu) | 1.03 | 1.08 | 1.55 | 1.05 | 1.45 | ||||||||
| Cu Production (tonnes) | 8,867 | 8,091 | 12,004 | 16,958 | 21,331 | ||||||||
| Cu Production (000 lbs) | 19,548 | 17,838 | 26,464 | 37,386 | 47,027 | ||||||||
| Cu Sold in Concentrate (tonnes) | 8,706 | 9,461 | 11,612 | 18,167 | 21,076 | ||||||||
| Cu Sold in Concentrate (000 lbs) | 19,192 | 20,859 | 25,600 | 40,051 | 46,465 | ||||||||
| Cu C1 cash cost (1)(2) | $ | 2.16 | $ | 2.30 | $ | 1.66 | $ | 2.23 | $ | 1.76 | |||
| Gold (Xavantina Operations) | |||||||||||||
| Ore Processed (tonnes) | 40,446 | 37,834 | 34,377 | 78,280 | 70,140 | ||||||||
| Grade (g / tonne) | 14.00 | 16.38 | 13.20 | 15.15 | 12.51 | ||||||||
| Au Production (oz) | 16,555 | 18,234 | 12,333 | 34,789 | 24,776 | ||||||||
| Au C1 cash cost (1) | $ | 428 | $ | 395 | $ | 492 | $ | 411 | $ | 464 | |||
| Au AISC (1) | $ | 842 | $ | 797 | $ | 1,081 | $ | 819 | $ | 1,013 | |||
| Financial Highlights ($ in millions, except per share amounts) | |||||||||||||
| Revenues | $ | 117.1 | $ | 105.8 | $ | 104.9 | $ | 222.9 | $ | 205.9 | |||
| Gross profit | 43.3 | 31.2 | 39.4 | 74.5 | 79.5 | ||||||||
| EBITDA (1) | (36.2 | ) | 17.8 | 58.6 | (18.4 | ) | 106.6 | ||||||
| Adjusted EBITDA (1) | 51.5 | 43.3 | 45.8 | 94.8 | 90.2 | ||||||||
| Cash flow from operations | 14.7 | 17.2 | 55.5 | 31.9 | 71.8 | ||||||||
| Net (loss) income | (53.4 | ) | (6.8 | ) | 29.9 | (60.2 | ) | 54.4 | |||||
| Net (loss) income attributable to owners of the Company | (53.2 | ) | (7.1 | ) | 29.6 | (60.4 | ) | 53.7 | |||||
| Per share (basic) | (0.52 | ) | (0.07 | ) | 0.32 | (0.59 | ) | 0.58 | |||||
| Per share (diluted) | (0.52 | ) | (0.07 | ) | 0.32 | (0.59 | ) | 0.58 | |||||
| Adjusted net income attributable to owners of the Company (1) | 18.6 | 16.8 | 22.3 | 35.4 | 44.7 | ||||||||
| Per share (basic) | 0.18 | 0.16 | 0.24 | 0.34 | 0.48 | ||||||||
| Per share (diluted) | 0.18 | 0.16 | 0.24 | 0.34 | 0.48 | ||||||||
| Cash, cash equivalents, and short-term investments | 44.8 | 51.7 | 180.4 | 44.8 | 180.4 | ||||||||
| Working (deficit) capital (1) | (57.6 | ) | (28.6 | ) | 140.7 | (57.6 | ) | 140.7 | |||||
| Net debt (1) | 482.0 | 415.1 | 246.5 | 482.0 | 246.5 | ||||||||
(1) EBITDA, adjusted EBITDA, adjusted net income (loss) attributable to owners of the Company, adjusted net income (loss) per share attributable to owners of the Company, net (cash) debt, working capital, copper C1 cash cost, copper C1 cash cost including foreign exchange hedges, gold C1 cash cost and gold AISC are non- IFRS measures. These measures do not have a standardized meaning prescribed by IFRS and might not be comparable to similar financial measures disclosed by other issuers. Please refer to the Company's discussion of Non-IFRS measures in its Management's Discussion and Analysis for the three and six months ended June 30, 2024 and the Reconciliation of Non-IFRS Measures section at the end of this press release.
(2) Copper C1 cash cost including foreign exchange hedges was $2.16 in Q2 2024 (Q2 2023 - $1.55) and $2.22 in YTD 2024 (YTD 2024 - $1.68).
2024 PRODUCTION AND COST GUIDANCE (*)
The Company is reaffirming its consolidated copper production guidance of 59,000 to 72,000 tonnes in concentrate, with production expected to be weighted towards H2 2024 largely due to the projected ramp-up of production at the Tucumã Project. Contributions from the Tucumã Project, combined with significantly lower concentrate treatment and refining charges, as well as a more favorable USD to BRL exchange rate, are expected to result in lower consolidated copper C1 cash costs in H2 2024 compared to H1 2024. As a result, the Company is reaffirming its full-year consolidated copper C1 cash cost guidance range of
$1.50 to $1.75 per pound of copper produced.
The Company is reaffirming its increased full-year gold production guidance range of 60,000 to 65,000 ounces. While slightly lower production is projected to result in higher unit costs in H2 2024 compared to H1 2024, the Company is lowering its 2024 gold cost guidance to reflect exceptional year-to-date unit cost performance. Full-year gold C1 cash cost guidance is now $450 to $550 (originally $550 to $650) per ounce of gold produced, and AISC guidance has been reduced to $900 to $1,000 (from $1,050 to $1,150) per ounce of gold produced.
The Company's cost guidance for 2024 assumes a foreign exchange rate of 5.00 BRL per USD, a gold price of $1,900 per ounce and a silver price of $23.00 per ounce.
| Original Guidance | Updated Guidance | |
| Consolidated Copper Production (tonnes) | ||
| Caraíba Operations | 42,000 - 47,000 | Low End of Range |
| Tucumã Operations | 17,000 - 25,000 | Unchanged |
| Total | 59,000 - 72,000 | Unchanged |
| Consolidated Copper C1 Cash Costs (1) Guidance | ||
| Caraíba Operations | $1.80 - $2.00 | Unchanged |
| Tucumã Operations | $0.90 - $1.10 | Unchanged |
| Total | $1.50 - $1.75 | Unchanged |
| The Xavantina Operations | ||
| Au Production (ounces) | 55,000 - 60,000 | 60,000 - 65,000 |
| Gold C1 Cash Cost (1) Guidance | $550 - $650 | $450 - $550 |
| Gold AISC (1) Guidance | $1,050 - $1,150 | $900 - $1,000 |
* Guidance is based on certain estimates and assumptions, including but not limited to, mineral reserve estimates, grade and continuity of interpreted geological formations and metallurgical performance. Please refer to the Company's most recent Annual Information Form and Management of Risks and Uncertainties in the MD&A for complete risk factors.
(1) Please refer to the section titled "Alternative Performance (Non-IFRS) Measures" within the MD&A.
2024 CAPITAL EXPENDITURE GUIDANCE (*)
The Company is narrowing its full-year capital expenditure guidance range to $303 to $348 million (from $299 to $349 million).
The 2024 capital expenditure guidance assumes an exchange rate of 5.10 USD:BRL for the Tucumã Project based on allocated foreign exchange hedges with a weighted average ceiling and floor of 5.10 and 5.23 USD:BRL, respectively. All other capital expenditures assume an exchange rate of 5.00 USD:BRL. Figures presented in the table below are in USD millions.
| Original Guidance | Updated Guidance | ||
| Caraíba Operations | |||
| Growth | $80 - $90 | $70 - $80 | |
| Sustaining | $100 - $110 | $90 - $100 | |
| Total, Caraíba Operations | $180 - $200 | $160 - $180 | |
| Tucumã Project | |||
| Growth | $65 - $75 | $85 - $90 (1) | |
| Capitalized Ramp-Up Costs | $4 - $6 | $8 - $10 (2) | |
| Sustaining | $2 - $5 | $2 - $5 | |
| Total, Tucumã Project | $71 - $86 | $95 - $105 | |
| Xavantina Operations | |||
| Growth | $3 - $5 | $3 - $5 | |
| Sustaining | $15 - $18 | $15 - $18 | |
| Total, Xavantina Operations | $18 - $23 | $18 - $23 | |
| Consolidated Exploration Programs | $30 - $40 | $30 - $40 | |
| Company Total | |||
| Growth | $148 - $170 | $158 - $175 | |
| Capitalized Ramp-Up Costs | $4 - $6 | $8 - $10 | |
| Sustaining | $117 - $133 | $107 - $123 | |
| Exploration | $30 - $40 | $30 - $40 | |
| Total, Company | $299 - $349 | $303 - $348 |
(*) Guidance is based on certain estimates and assumptions, including but not limited to, mineral reserve estimates, grade and continuity of interpreted geological formations and metallurgical performance. Please refer to the Company's most recent Annual Information Form and Management of Risks and Uncertainties in the MD&A for complete risk factors.
(1) Includes approximately $11.7 million of taxes deemed non-recoverable.
(2) Includes capitalized mining costs that were accelerated by over two months due to the early completion of pre-strip activities. This additional capital is expected to result in lower operating costs in H2 2024.
CONFERENCE CALL DETAILS
The Company will hold a conference call on Friday, August 2, 2024 at 11:30 am Eastern time (8:30 am Pacific time) to discuss these results.
| Date: | Friday, August 2, 2024 |
| Time: | 11:30 am Eastern time (8:30 am Pacific time) |
| Dial in: | Canada/USA Toll Free: 1-844-763-8274, International: +1-647-484-8814 Please dial in 5-10 minutes prior to the start of the call or pre-register using this link to bypass the live operator queue |
| Webcast: | To access the webcast, click here |
| Replay: | Canada/USA: 1-855-669-9658, International: +1-412-317-0088 For country-specific dial-in numbers, click here |
| Replay Passcode: | 6135252 |
Reconciliation of Non-IFRS Measures
Financial results of the Company are presented in accordance with IFRS. The Company utilizes certain alternative performance (non-IFRS) measures to monitor its performance, including copper C1 cash cost, copper C1 cash cost including foreign exchange hedges, gold C1 cash cost, gold AISC, EBITDA, adjusted EBITDA, adjusted net income attributable to owners of the Company, adjusted net income per share, net (cash) debt, working capital and available liquidity. These performance measures have no standardized meaning prescribed within generally accepted accounting principles under IFRS and, therefore, amounts presented may not be comparable to similar measures presented by other mining companies. These non-IFRS measures are intended to provide supplemental information and should not be considered in isolation or as a substitute for measures of performance prepared in accordance with IFRS.
For additional details please refer to the Company's discussion of non-IFRS and other performance measures in its Management's Discussion and Analysis for the three and six months ended June 30, 2024 which is available on SEDAR+ at www.sedarplus.ca, and on EDGAR at www.sec.gov.
Copper C1 cash cost and copper C1 cash cost including foreign exchange hedges
The following table provides a reconciliation of copper C1 cash cost to cost of production, its most directly comparable IFRS measure.
| Reconciliation: | 2024 - Q2 | 2024 - Q1 | 2023 - Q2 | 2024 - YTD | 2023 - YTD | ||||||||||
| Cost of production | $ | 41,945 | $ | 42,227 | $ | 37,767 | $ | 84,172 | $ | 74,052 | |||||
| Add (less): | |||||||||||||||
| Transportation costs & other | 1,283 | 1,252 | 1,733 | 2,535 | 3,072 | ||||||||||
| Treatment, refining, and other | 4,058 | 5,170 | 7,954 | 9,228 | 14,417 | ||||||||||
| By-product credits | (3,431 | ) | (2,440 | ) | (3,704 | ) | (5,871 | ) | (6,514 | ) | |||||
| Incentive payments | (1,174 | ) | (1,199 | ) | (1,129 | ) | (2,373 | ) | (2,366 | ) | |||||
| Net change in inventory | (468 | ) | (3,893 | ) | 1,323 | (4,361 | ) | 138 | |||||||
| Foreign exchange translation and other | 21 | (7 | ) | (13 | ) | 14 | 2 | ||||||||
| C1 cash costs | 42,234 | 41,110 | 43,931 | 83,344 | 82,801 | ||||||||||
| (Gain) loss on foreign exchange hedges | 46 | (276 | ) | (2,842 | ) | (230 | ) | (3,774 | ) | ||||||
| C1 cash costs including foreign exchange hedges | $ | 42,280 | $ | 40,834 | $ | 41,089 | $ | 83,114 | $ | 79,027 | |||||
| Mining | $ | 27,881 | $ | 25,256 | $ | 25,794 | $ | 53,137 | $ | 49,004 | |||||
| Processing | 7,927 | 7,177 | 7,643 | 15,104 | 14,197 | ||||||||||
| Indirect | 5,799 | 5,947 | 6,244 | 11,746 | 11,697 | ||||||||||
| Production costs | 41,607 | 38,380 | 39,681 | 79,987 | 74,898 | ||||||||||
| By-product credits | (3,431 | ) | (2,440 | ) | (3,704 | ) | (5,871 | ) | (6,514 | ) | |||||
| Treatment, refining and other | 4,058 | 5,170 | 7,954 | 9,228 | 14,417 | ||||||||||
| C1 cash costs | 42,234 | 41,110 | 43,931 | 83,344 | 82,801 | ||||||||||
| (Gain) loss on foreign exchange hedges | 46 | (276 | ) | (2,842 | ) | (230 | ) | (3,774 | ) | ||||||
| C1 cash costs including foreign exchange hedges | $ | 42,280 | $ | 40,834 | $ | 41,089 | $ | 83,114 | $ | 79,027 | |||||
| Costs per pound | |||||||||||||||
| Total copper produced (lb, 000) | 19,548 | 17,838 | 26,464 | 37,386 | 47,027 | ||||||||||
| Mining | $ | 1.42 | $ | 1.42 | $ | 0.97 | $ | 1.42 | $ | 1.04 | |||||
| Processing | $ | 0.41 | $ | 0.40 | $ | 0.29 | $ | 0.41 | $ | 0.30 | |||||
| Indirect | $ | 0.30 | $ | 0.33 | $ | 0.24 | $ | 0.31 | $ | 0.25 | |||||
| By-product credits | $ | (0.18 | ) | $ | (0.14 | ) | $ | (0.14 | ) | $ | (0.16 | ) | $ | (0.14 | ) |
| Treatment, refining and other | $ | 0.21 | $ | 0.29 | $ | 0.30 | $ | 0.25 | $ | 0.31 | |||||
| Copper C1 cash costs | $ | 2.16 | $ | 2.30 | $ | 1.66 | $ | 2.23 | $ | 1.76 | |||||
| (Gain) loss on foreign exchange hedges | $ | — | $ | (0.02 | ) | $ | (0.11 | ) | $ | (0.01 | ) | $ | (0.08 | ) | |
| Copper C1 cash costs including foreign exchange hedges | $ | 2.16 | $ | 2.28 | $ | 1.55 | $ | 2.22 | $ | 1.68 | |||||
Gold C1 cash cost and gold AISC
The following table provides a reconciliation of gold C1 cash cost and gold AISC to cost of production, its most directly comparable IFRS measure.
| Reconciliation: | 2024 - Q2 | 2024 - Q1 | 2023 - Q2 | 2024 - YTD | 2023 - YTD | ||||||||||||||
| Cost of production | $ | 7,580 | $ | 7,255 | $ | 5,657 | $ | 14,835 | $ | 11,764 | |||||||||
| Add (less): | |||||||||||||||||||
| Incentive payments | (226 | ) | (443 | ) | (311 | ) | (669 | ) | (718 | ) | |||||||||
| Net change in inventory | (322 | ) | 264 | 936 | (58 | ) | 584 | ||||||||||||
| By-product credits | (259 | ) | (189 | ) | (163 | ) | (448 | ) | (339 | ) | |||||||||
| Smelting and refining | 97 | 90 | 63 | 187 | 139 | ||||||||||||||
| Foreign exchange translation and other | 215 | 232 | (119 | ) | 447 | 57 | |||||||||||||
| C1 cash costs | $ | 7,085 | $ | 7,209 | $ | 6,063 | $ | 14,294 | $ | 11,487 | |||||||||
| Site general and administrative | 1,350 | 1,353 | 1,338 | 2,703 | 2,570 | ||||||||||||||
| Accretion of mine closure and rehabilitation provision | 88 | 92 | 111 | 180 | 216 | ||||||||||||||
| Sustaining capital expenditure | 2,653 | 3,254 | 3,530 | 5,907 | 6,543 | ||||||||||||||
| Sustaining lease payments | 1,908 | 2,122 | 1,740 | 4,030 | 3,400 | ||||||||||||||
| Royalties and production taxes | 862 | 510 | 556 | 1,372 | 894 | ||||||||||||||
| AISC | $ | 13,946 | $ | 14,540 | $ | 13,338 | $ | 28,486 | $ | 25,110 | |||||||||
| Costs | |||||||||||||||
| Mining | $ | 3,705 | $ | 3,820 | $ | 3,017 | $ | 7,525 | $ | 5,584 | |||||
| Processing | 2,277 | 2,259 | 2,048 | 4,536 | 3,953 | ||||||||||
| Indirect | 1,265 | 1,229 | 1,098 | 2,494 | 2,150 | ||||||||||
| Production costs | 7,247 | 7,308 | 6,163 | 14,555 | 11,687 | ||||||||||
| Smelting and refining costs | 97 | 90 | 63 | 187 | 139 | ||||||||||
| By-product credits | (259 | ) | (189 | ) | (163 | ) | (448 | ) | (339 | ) | |||||
| C1 cash costs | $ | 7,085 | $ | 7,209 | $ | 6,063 | $ | 14,294 | $ | 11,487 | |||||
| Site general and administrative | 1,350 | 1,353 | 1,338 | 2,703 | 2,570 | ||||||||||
| Accretion of mine closure and rehabilitation provision | 88 | 92 | 111 | 180 | 216 | ||||||||||
| Sustaining capital expenditure | 2,653 | 3,254 | 3,530 | 5,907 | 6,543 | ||||||||||
| Sustaining leases | 1,908 | 2,122 | 1,740 | 4,030 | 3,400 | ||||||||||
| Royalties and production taxes | 862 | 510 | 556 | 1,372 | 894 | ||||||||||
| AISC | $ | 13,946 | $ | 14,540 | $ | 13,338 | $ | 28,486 | $ | 25,110 | |||||
| Costs per ounce | |||||||||||||||
| Total gold produced (ounces) | 16,555 | 18,234 | 12,333 | 34,789 | 24,776 | ||||||||||
| Mining | $ | 224 | $ | 209 | $ | 245 | $ | 216 | $ | 225 | |||||
| Processing | $ | 138 | $ | 124 | $ | 166 | $ | 130 | $ | 160 | |||||
| Indirect | $ | 76 | $ | 67 | $ | 89 | $ | 72 | $ | 87 | |||||
| Smelting and refining | $ | 6 | $ | 5 | $ | 5 | $ | 5 | $ | 6 | |||||
| By-product credits | $ | (16 | ) | $ | (10 | ) | $ | (13 | ) | $ | (12 | ) | $ | (14 | ) |
| Gold C1 cash cost | $ | 428 | $ | 395 | $ | 492 | $ | 411 | $ | 464 | |||||
| Gold AISC | $ | 842 | $ | 797 | $ | 1,081 | $ | 819 | $ | 1,013 | |||||
Earnings before interest, taxes, depreciation and amortization (EBITDA) and Adjusted EBITDA
The following table provides a reconciliation of EBITDA and Adjusted EBITDA to net income, its most directly comparable IFRS measure.
| Reconciliation: | 2024 - Q2 | 2024 - Q1 | 2023 - Q2 | 2024 - YTD | 2023 - YTD | ||||||||||
| Net (Loss) Income | $ | (53,399 | ) | $ | (6,830 | ) | $ | 29,941 | $ | (60,229 | ) | $ | 54,441 | ||
| Adjustments: | |||||||||||||||
| Finance expense | 4,565 | 4,634 | 5,995 | 9,199 | 12,521 | ||||||||||
| Finance income | (1,361 | ) | (1,468 | ) | (3,362 | ) | (2,829 | ) | (7,500 | ) | |||||
| Income tax (recovery) expense | (8,267 | ) | (1,853 | ) | 5,773 | (10,120 | ) | 10,439 | |||||||
| Amortization and depreciation | 22,294 | 23,296 | 20,239 | 45,590 | 36,745 | ||||||||||
| EBITDA | $ | (36,168 | ) | $ | 17,779 | $ | 58,586 | $ | (18,389 | ) | $ | 106,646 | |||
| Foreign exchange loss (gain) | 70,454 | 18,996 | (15,057 | ) | 89,450 | (23,678 | ) | ||||||||
| Share based compensation | 6,075 | 6,545 | 4,909 | 12,620 | 9,926 | ||||||||||
| Write-down of exploration and evaluation asset | 10,745 | — | — | 10,745 | — | ||||||||||
| Unrealized loss (gain) on copper derivatives | 436 | (64 | ) | (2,654 | ) | 372 | (2,654 | ) | |||||||
| Adjusted EBITDA | $ | 51,542 | $ | 43,256 | $ | 45,784 | $ | 94,798 | $ | 90,240 | |||||
Adjusted net income attributable to owners of the Company and Adjusted net income per share attributable to owners of the Company
The following table provides a reconciliation of Adjusted net income attributable to owners of the Company and Adjusted EPS to net income attributable to the owners of the Company, its most directly comparable IFRS measure.
| Reconciliation: | 2024 - Q2 | 2024 - Q1 | 2023 - Q2 | 2024 - YTD | 2023 - YTD | ||||||||||
| Net (loss) income as reported attributable to the | |||||||||||||||
| owners of the Company | $ | (53,247 | ) | $ | (7,141 | ) | $ | 29,576 | $ | (60,388 | ) | $ | 53,730 | ||
| Adjustments: | |||||||||||||||
| Share based compensation | 6,075 | 6,545 | 4,909 | 12,620 | 9,926 | ||||||||||
| Unrealized foreign exchange loss (gain) on USD | |||||||||||||||
| denominated balances in MCSA | 48,517 | 11,257 | (9,716 | ) | 59,774 | (14,469 | ) | ||||||||
| Unrealized foreign exchange loss (gain) on foreign exchange derivative contracts | 16,006 | 9,304 | (2,078 | ) | 25,310 | (5,230 | ) | ||||||||
| Write-down of exploration and evaluation asset | 10,745 | — | — | 10,745 | — | ||||||||||
| Unrealized loss (gain) on copper derivative contracts | 434 | (64 | ) | (2,644 | ) | 370 | (2,644 | ) | |||||||
| Tax effect on the above adjustments | (9,904 | ) | (3,128 | ) | 2,205 | (13,032 | ) | 3,413 | |||||||
| Adjusted net income attributable to owners of the Company | $ | 18,626 | $ | 16,773 | $ | 22,252 | $ | 35,399 | $ | 44,726 | |||||
| Weighted average number of common shares | |||||||||||||||
| Basic | 103,082,363 | 102,769,444 | 92,685,916 | 102,918,092 | 92,491,063 | ||||||||||
| Diluted | 103,961,615 | 103,242,437 | 93,643,447 | 103,704,730 | 93,429,191 | ||||||||||
| Adjusted EPS | |||||||||||||||
| Basic | $ | 0.18 | $ | 0.16 | $ | 0.24 | $ | 0.34 | $ | 0.48 | |||||
| Diluted | $ | 0.18 | $ | 0.16 | $ | 0.24 | $ | 0.34 | $ | 0.48 | |||||
Net (Cash) Debt
The following table provides a calculation of net (cash) debt based on amounts presented in the Company's condensed consolidated interim financial statements as at the periods presented.
| June 30, 2024 | March 31, 2024 | December 31, 2023 | June 30, 2023 | ||||||||||||
| Current portion of loans and borrowings | $ | 39,889 | $ | 16,059 | $ | 20,381 | $ | 17,105 | |||||||
| Long-term portion of loans and borrowings | 486,919 | 450,743 | 405,852 | 409,818 | |||||||||||
| Less: | |||||||||||||||
| Cash and cash equivalents | (44,773 | ) | (51,692 | ) | (111,738 | ) | (124,382 | ) | |||||||
| Short-term investments | — | — | — | (56,011 | ) | ||||||||||
| Net debt (cash) | $ | 482,035 | $ | 415,110 | $ | 314,495 | $ | 246,530 | |||||||
Working Capital and Available Liquidity
The following table provides a calculation for these based on amounts presented in the Company's condensed consolidated interim financial statements as at the periods presented.
| June 30, 2024 | March 31, 2024 | December 31, 2023 | June 30, 2023 | ||||||||||||
| Current assets | $ | 124,554 | $ | 129,960 | $ | 199,487 | $ | 280,783 | |||||||
| Less: Current liabilities | (182,143 | ) | (158,565 | ) | (173,800 | ) | (140,090 | ) | |||||||
| Working (deficit) capital | $ | (57,589 | ) | $ | (28,605 | ) | $ | 25,687 | $ | 140,693 | |||||
| Cash and cash equivalents | 44,773 | 51,692 | 111,738 | 124,382 | |||||||||||
| Short-term investments | — | — | — | 56,011 | |||||||||||
| Available undrawn revolving credit facilities | 100,000 | 105,000 | 150,000 | 150,000 | |||||||||||
| Available undrawn prepayment facilities (1) | $ | 25,000 | $ | — | $ | — | $ | — | |||||||
| Available liquidity | $ | 169,773 | $ | 156,692 | $ | 261,738 | $ | 330,393 | |||||||
(1) In May 2024, the Company entered into a $50.0 million non-priced copper prepayment facility arrangement. Through the end of 2024, the Company has the option to increase the size of the facility from $50.0 million to
$75.0 million.
ABOUT ERO COPPER CORP
Ero is a high-margin, high-growth copper producer with operations in Brazil and corporate headquarters in Vancouver, B.C., Canada. The Company's primary asset is a 99.6% interest in the Brazilian copper mining company, Mineração Caraíba S.A. ("MCSA"), 100% owner of the Company's Caraíba Operations (formerly known as the MCSA Mining Complex), which are located in the Curaçá Valley, Bahia State, Brazil and include the Pilar and Vermelhos underground mines and the Surubim open pit mine, and the Tucumã Project (formerly known as Boa Esperança), an IOCG-type copper project located in Pará, Brazil. The Company also owns 97.6% of NX Gold S.A. ("NX Gold") which owns the Xavantina Operations (formerly known as the NX Gold Mine), comprised of an operating gold and silver mine located in Mato Grosso, Brazil. Additional information on the Company and its operations, including technical reports on the Caraíba Operations, Xavantina Operations and Tucumã Project, can be found on the Company's website ( www.erocopper.com), on SEDAR+ ( www.sedarplus.ca), and on EDGAR ( www.sec.gov). The Company's shares are publicly traded on the Toronto Stock Exchange and the New York Stock Exchange under the symbol "ERO".
FOR MORE INFORMATION, PLEASE CONTACT
Courtney Lynn, SVP, Corporate Development, Investor Relations & Sustainability
(604) 335-7504
info@erocopper.com
CAUTION REGARDING FORWARD LOOKING INFORMATION AND STATEMENTS
This press release contains "forward-looking statements" within the meaning of the United States Private Securities Litigation Reform Act of 1995 and "forward-looking information" within the meaning of applicable Canadian securities legislation (collectively, "forward-looking statements"). Forward-looking statements include statements that use forward-looking terminology such as "may", "could", "would", "will", "should", "intend", "target", "plan", "expect", "budget", "estimate", "forecast", "schedule", "anticipate", "believe", "continue", "potential", "view" or the negative or grammatical variation thereof or other variations thereof or comparable terminology. Forward-looking statements may include, but are not limited to, statements with respect to the Company's expected production, operating costs and capital expenditures at the Caraíba Operations, the Tucumã Project and the Xavantina Operations; estimated timing for certain milestones, including ramp-up of production levels, at the Tucumã Project; expected progress at the new external shaft at the Caraíba Operations; expectations related to foreign exchange rates as well as copper concentrate treatment and refining charges; and any other statement that may predict, forecast, indicate or imply future plans, intentions, levels of activity, results, performance or achievements.
Forward-looking statements are subject to a variety of known and unknown risks, uncertainties and other factors that could cause actual results, actions, events, conditions, performance or achievements to materially differ from those expressed or implied by the forward-looking statements, including, without limitation, risks discussed in this press release and in the Company's Annual Information Form for the year ended December 31, 2023 ("AIF") under the heading "Risk Factors". The risks discussed in this press release and in the AIF are not exhaustive of the factors that may affect any of the Company's forward-looking statements. Although the Company has attempted to identify important factors that could cause actual results, actions, events, conditions, performance or achievements to differ materially from those contained in forward-looking statements, there may be other factors that cause results, actions, events, conditions, performance or achievements to differ from those anticipated, estimated or intended.
Forward-looking statements are not a guarantee of future performance. There can be no assurance that forward-looking statements will prove to be accurate, as actual results and future events could differ materially from those anticipated in such statements. Forward-looking statements involve statements about the future and are inherently uncertain, and the Company's actual results, achievements or other future events or conditions may differ materially from those reflected in the forward-looking statements due to a variety of risks, uncertainties and other factors, including, without limitation, those referred to herein and in the AIF under the heading "Risk Factors".
The Company's forward-looking statements are based on the assumptions, beliefs, expectations and opinions of management on the date the statements are made, many of which may be difficult to predict and beyond the Company's control. In connection with the forward-looking statements contained in this press release and in the AIF, the Company has made certain assumptions about, among other things: favourable equity and debt capital markets; the ability to raise any necessary additional capital on reasonable terms to advance the production, development and exploration of the Company's properties and assets; future prices of copper, gold and other metal prices; the timing and results of exploration and drilling programs; the accuracy of any mineral reserve and mineral resource estimates; the geology of the Caraíba Operations, the Xavantina Operations and the Tucumã Project being as described in the respective technical report for each property; production costs; the accuracy of budgeted exploration, development and construction costs and expenditures; the price of other commodities such as fuel; future currency exchange rates and interest rates; operating conditions being favourable such that the Company is able to operate in a safe, efficient and effective manner; work force continuing to remain healthy in the face of prevailing epidemics, pandemics or other health risks, political and regulatory stability; the receipt of governmental, regulatory and third party approvals, licenses and permits on favourable terms; obtaining required renewals for existing approvals, licenses and permits on favourable terms; requirements under applicable laws; sustained labour stability; stability in financial and capital goods markets; availability of equipment; positive relations with local groups and the Company's ability to meet its obligations under its agreements with such groups; and satisfying the terms and conditions of the Company's current loan arrangements. Although the Company believes that the assumptions inherent in forward-looking statements are reasonable as of the date of this press release, these assumptions are subject to significant business, social, economic, political, regulatory, competitive and other risks and uncertainties, contingencies and other factors that could cause actual actions, events, conditions, results, performance or achievements to be materially different from those projected in the forward-looking statements. The Company cautions that the foregoing list of assumptions is not exhaustive. Other events or circumstances could cause actual results to differ materially from those estimated or projected and expressed in, or implied by, the forward-looking statements contained in this press release. There can be no assurance that forward-looking statements will prove to be accurate, as actual results and future events could differ materially from those anticipated in such statements. Accordingly, readers should not place undue reliance on forward- looking statements.
Forward-looking statements contained herein are made as of the date of this press release and the Company disclaims any obligation to update or revise any forward-looking statement, whether as a result of new information, future events or results or otherwise, except as and to the extent required by applicable securities laws.
CAUTIONARY NOTES REGARDING MINERAL RESOURCE AND MINERAL RESERVE ESTIMATES
Unless otherwise indicated, all reserve and resource estimates included in this press release and the documents incorporated by reference herein have been prepared in accordance with National Instrument 43-101, Standards of Disclosure for Mineral Projects ("NI 43-101") and the Canadian Institute of Mining, Metallurgy and Petroleum (the "CIM") — CIM Definition Standards on Mineral Resources and Mineral Reserves, adopted by the CIM Council, as amended (the "CIM Standards"). NI 43-101 is a rule developed by the Canadian Securities Administrators that establishes standards for all public disclosure an issuer makes of scientific and technical information concerning mineral projects. Canadian standards, including NI 43-101, differ significantly from the requirements of the United States Securities and Exchange Commission (the "SEC"), and reserve and resource information included herein may not be comparable to similar information disclosed by U.S. companies. In particular, and without limiting the generality of the foregoing, this press release and the documents incorporated by reference herein use the terms "measured resources," "indicated resources" and "inferred resources" as defined in accordance with NI 43-101 and the CIM Standards.
Further to recent amendments, mineral property disclosure requirements in the United States (the "U.S. Rules") are governed by subpart 1300 of Regulation S-K of the U.S. Securities Act of 1933, as amended (the "U.S. Securities Act") which differ from the CIM Standards. As a foreign private issuer that is eligible to file reports with the SEC pursuant to the multi-jurisdictional disclosure system (the "MJDS"), Ero is not required to provide disclosure on its mineral properties under the U.S. Rules and will continue to provide disclosure under NI 43-101 and the CIM Standards. If Ero ceases to be a foreign private issuer or loses its eligibility to file its annual report on Form 40-F pursuant to the MJDS, then Ero will be subject to the U.S. Rules, which differ from the requirements of NI 43-101 and the CIM Standards.
Pursuant to the new U.S. Rules, the SEC recognizes estimates of "measured mineral resources", "indicated mineral resources" and "inferred mineral resources". In addition, the definitions of "proven mineral reserves" and "probable mineral reserves" under the U.S. Rules are now "substantially similar" to the corresponding standards under NI 43-101. Mineralization described using these terms has a greater amount of uncertainty as to its existence and feasibility than mineralization that has been characterized as reserves. Accordingly, U.S. investors are cautioned not to assume that any measured mineral resources, indicated mineral resources, or inferred mineral resources that Ero reports are or will be economically or legally mineable. Further, "inferred mineral resources" have a greater amount of uncertainty as to their existence and as to whether they can be mined legally or economically. Under Canadian securities laws, estimates of "inferred mineral resources" may not form the basis of feasibility or pre-feasibility studies, except in rare cases. While the above terms under the U.S. Rules are "substantially similar" to the standards under NI 43-101 and CIM Standards, there are differences in the definitions under the U.S. Rules and CIM Standards. Accordingly, there is no assurance any mineral reserves or mineral resources that Ero may report as "proven mineral reserves", "probable mineral reserves", "measured mineral resources", "indicated mineral resources" and "inferred mineral resources" under NI 43-101 would be the same had Ero prepared the reserve or resource estimates under the standards adopted under the U.S. Rules.
Photos accompanying this announcement are available at
https://www.globenewswire.com/NewsRoom/AttachmentNg/19e07d18-843c-43a6-84ac-74dc05a7d4a7
https://www.globenewswire.com/NewsRoom/AttachmentNg/e2d1d8ae-f52d-4b56-8c6f-5e66e1fd8bc7
https://www.globenewswire.com/NewsRoom/AttachmentNg/72efbe24-9324-4de3-9742-b9ca9c387f1d
https://www.globenewswire.com/NewsRoom/AttachmentNg/9d8313f0-a46b-4a86-9291-6a124b00048c
![]()