(TSX: LUN) (Nasdaq Stockholm: LUMI) Lundin Mining Corporation ("Lundin Mining" or the "Company") today announced the voting results from its 2024 Annual and Special Meeting of Shareholders (the "Meeting"). A total of 610,859,421 common shares were voted at the Meeting, representing 78.81% of the votes attached to all outstanding common shares as of the record date March 22, 2024 . Shareholders voted in favour of all items of business considered at the Meeting, as follows:
- AustraliaNorth AmericaWorld
Investing News NetworkYour trusted source for investing success
- Lithium Outlook
- Oil and Gas Outlook
- Gold Outlook Report
- Uranium Outlook
- Rare Earths Outlook
- All Outlook Reports
- Top Generative AI Stocks
- Top EV Stocks
- Biggest AI Companies
- Biggest Blockchain Stocks
- Biggest Cryptocurrency-mining Stocks
- Biggest Cybersecurity Companies
- Biggest Robotics Companies
- Biggest Social Media Companies
- Biggest Technology ETFs
- Artificial Intellgience ETFs
- Robotics ETFs
- Canadian Cryptocurrency ETFs
- Artificial Intelligence Outlook
- EV Outlook
- Cleantech Outlook
- Crypto Outlook
- Tech Outlook
- All Market Outlook Reports
- Cannabis Weekly Round-Up
- Top Alzheimer's Treatment Stocks
- Top Biotech Stocks
- Top Plant-based Food Stocks
- Biggest Cannabis Stocks
- Biggest Pharma Stocks
- Longevity Stocks to Watch
- Psychedelics Stocks to Watch
- Top Cobalt Stocks
- Small Biotech ETFs to Watch
- Top Life Science ETFs
- Biggest Pharmaceutical ETFs
- Life Science Outlook
- Biotech Outlook
- Cannabis Outlook
- Pharma Outlook
- Psychedelics Outlook
- All Market Outlook Reports
Earn-In On The Afla Cu/Zn Project Consolidates The Palma VMS Belt
Alvo Minerals Limited (ASX: ALV) (“Alvo” or the “Company”) is pleased to announce the signing of a binding agreement to earn-in to the highly prospective Alfa Project (“Afla”), consolidating the broader Palma Volcanogenic Massive Sulphide (VMS) belt. The Afla Project is located adjacent to Alvo’s Palma Project and covers a strategic southern portion of the target host rocks of the VMS sequence.
HIGHLIGHTS
- Binding agreement to earn-in to the Afla Cu/Zn Project, consolidating the southern portion of the highly prospective Palma VMS belt
- The Afla Project was partially covered by a VTEM survey, and multiple conductors have been identified which appear similar to conductors that host significant VMS mineralisation at Palma
- The Brazilian Geological Survey (CPRM) conducted regional stream sediment sampling and soils sampling across the area highlighting several highly anomalous prospects
- Earn-in transaction has no upfront cash payments and will utilise Alvo’s existing exploration team to deliver the 1,000m of diamond drilling within 18 months of the agreement to earn the initial 60% of the project
- Ability to earn up to 100% of the project dependant on additional exploration and contract milestones
Alvo has the team, the tools and expertise to conduct a cost-effective exploration program across the Afla Project.
Rob Smakman, Alvo’s Managing Director commented on the Afla Project:
"We have secured the Afla Project due to its prospectivity and strategic location. It’s a significant area that increases our control over the VMS district, an enviable land package for a junior anywhere in the world and we are confident that integrating exploration at Afla with our existing CY2023 plans will be seamless. Field work on the ground will start immediately, focussed on the already identified targets. We will continue our systematic approach to prioritisation of the multiple greenfields targets to the point of being drill-ready.
“We have built an expert in-house team that is motivated and focussed on making new discoveries. We have leading edge in-house exploration tools available and continue to enhance our knowledge of the typical type and style of mineralisation in the district. We are really excited that we will be integrating the Afla Project into our exploration plans.”
Afla Cu/Zn Project
Alvo has signed a binding deal with AFLA INVESTIMENTOS E PARTICIPAÇÕES LTDA, (“Afla Investimentos”) a Brazilian company with interests in gold and limestone mining, agriculture, and real estate. The Afla Project includes 5 granted exploration licenses covering a total area of 9,758Ha (98km2), located adjacent to both Alvo’s Palma VMS Project and Alvo’s Ni/Cu/PGE Project at Cana Brava (see Figure 1). The Project is considered predominantly prospective for VMS style (Cu, Zn, Pb, Ag, Au) mineralisation.
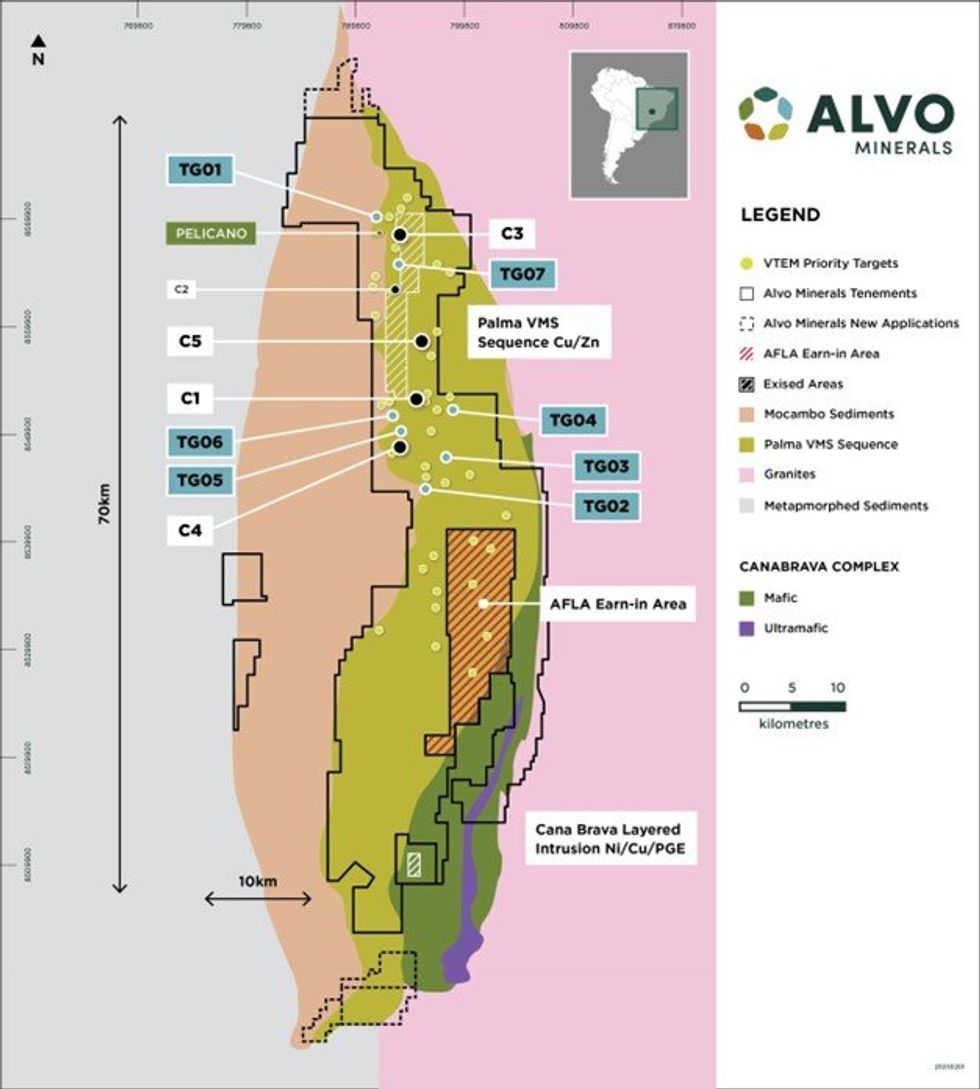
Figure 1: Regional geology and tenement holdings for Alvo's Palma project area - Afla Project area in red hash.
Prior to Afla Investimentos taking control of the project in 2018, the area was explored by the Brazilian subsidiary of BHP (Colorado Exploration circa 1980’s), Glencore (early 2000’s) and Nexa in 2008. No historical data from these companies is currently available, however a recent due diligence field visit noted historical drill-core believed to be from when BHP was exploring the area.
Alvo is pursuing the historical information which may exist in the Mines Department, however there is no guarantee that this information will be available.
The Geological survey of Brazil (CPRM) completed a regional Stream Sediment survey which covered the Afla Project ground and indicated anomalous catchments of Cu, Zn and Pb. The CPRM also completed several soil sampling and mapping traverses also confirming anomalous Cu and Zn.
In 2008, Votorantim Exploration (now Nexa) flew a VTEM survey covering most of the Afla ground. This is the same survey that covers much of the Palma project and the source of multiple conductive targets currently being followed up by the Alvo exploration team. Alvo’s consultants have highlighted 5 individual conductors on the Afla ground that warrant follow up (see Figure 1).
The work by the CPRM and the VTEM survey is a great starting point for Alvo’s exploration strategy.
Integrating Afla into the Palma Regional Exploration Strategy
Alvo is undertaking an extensive regional exploration program across the Palma project which covers over 780km2 (including the Afla Project increases this tenure to ~875 km2) of contiguous and highly prospective ground in a known VMS district. The district has been largely unexplored for over 30 years since the first discovery in the 1970s and presents an extraordinary opportunity to make new discoveries by applying modern and systematic exploration techniques.
VMS deposits typically occur in clusters, where multiple deposits are located in similar geological districts. These districts can host a number of VMS deposits that range in size from less than 1Mt to exceeding 100Mt.
Exploration work is underway across multiple prospects with the aim of advancing prospects to drill-ready status. Field activities including geological mapping, soil sampling, Auger drilling (“Auger”), Induced Polarisation Surveys (“IP”) and Fixed Loop electromagnetic surveys (“FLEM”) are underway. These activities are being undertaken concurrently within the district on various prospects identified by the Company from historical work completed to date.
Importantly, the Company’s key equipment purchases allow for flexible, fast and efficient exploration which is significantly less expensive than typical contracted exploration as the only material expense is labour and maintenance.
The Afla project areas have been integrated into the Palma project plan and exploration will proceed across the new areas according to the current schedule in place. Alvo expects that the time required to complete the earn- in is sufficient assuming the first pass exploration is successful.
Click here for the full ASX Release
This article includes content from Alvo Minerals, licensed for the purpose of publishing on Investing News Australia. This article does not constitute financial product advice. It is your responsibility to perform proper due diligence before acting upon any information provided here. Please refer to our full disclaimer here.
Lundin Mining Announces Annual Meeting Voting Results
News Provided by Canada Newswire via QuoteMedia
Copper Prices Break US$10,000 as Supply Concerns Mount
Copper prices broke US$10,000 per metric ton this week, hitting highs not seen in two years. The last time they crossed the threshold was in March 2022 amid tensions following Russia's invasion of Ukraine.
Although concerns about demand from China remain, worries over dwindling global supply are heating up.
Copper has also been gaining momentum on anticipation of interest rate cuts from the US Federal Reserve.
Looking at supply, Goldman Sachs (NYSE:GS) has warned of intensifying stress, with analysts at the firm projecting a possible "stockout episode" by the fourth quarter due to growing deficits. Notably, the investment bank has boosted its year-end copper forecast to US$12,000 from US$10,000, strengthening its bullish stance.
“We continue to forecast a shift into open-ended and mounting metal deficits from 2024 onwards,” analysts including Nicholas Snowden wrote in note quoted recently by Bloomberg.
BHP's (ASX:BHP,NYSE:BHP,LSE:BHP) potential takeover of Anglo American (LSE:AAL,OTC Pink:AGPPF) has raised prospects of tighter control over global copper supply. If realized, the merger would create an entity commanding 10 percent of global copper supply, surpassing major players like Chile's Codelco and Freeport-McMoRan (NYSE:FCX).
The closure of Canadian miner First Quantum Minerals' (TSX:FM,OTC Pink:FQVLF) Cobre Panama copper mine last year has heightened concerns about supply shortages, further accelerating copper's price momentum.
Despite copper's gains, skepticism lingers, with some observers pointing to soft indicators in China, such as falling import premiums and cautious purchasing behavior among buyers.
As of the end of Thursday (May 9), three month London Metal Exchange copper was at US$9,904.50.
Don't forget to follow us @INN_Resource for real-time updates!
Securities Disclosure: I, Giann Liguid, hold no direct investment interest in any company mentioned in this article.
Forum Energy Metals to Present at the Metals Investor Forum in Vancouver, BC May 10 - 11, 2024
Join Forum Energy Metals (TSXV: FMC) (OTCQB: FDCFF) at the Metals Investor Forum being held at the Paradox Hotel in Vancouver, BC on Friday May 10 and Saturday May 11. Forum President & CEO, Richard Mazur and Dr. Rebecca Hunter, Vice President of Exploration will be in attendance both days of the conference. In addition, Dr. Rebecca Hunter will be presenting an update on Forum's high grade uranium discovery in the Thelon Basin, Nunavut in the Grand Ballroom at 3:30pm on Saturday May 11.
Investors can register at:
https://web.cvent.com/event/5341b106-50fc-4555-9191-dbb71c498240/regProcessStep1
Rick Mazur, President & CEO stated, "This is an exciting Canadian uranium discovery in the Thelon Basin, a geologic equivalent of the prolific Athabasca Basin. We are currently mobilizing materials and will be building the camp later in the month in advance of our $10 million summer drill campaign beginning in June. We are very excited to get started on this summer program where we will be mainly focussed on the Tatiggaq deposit which is adjacent to Orano's 133 million pound Kiggavik uranium development project."
Technical meetings with management and partnering inquiries on Forum's portfolio of uranium and energy metals projects in Saskatchewan, Nunavut and Idaho can be arranged by contacting: Rick Mazur, President & CEO at mazur@forumenergymetals.com or by calling 604-630-1585.
About Forum Energy Metals
Forum Energy Metals Corp.(TSXV: FMC) (OTCQB: FDCFF) is focused on the discovery of high grade unconformity-related uranium deposits in the Athabasca Basin, Saskatchewan and the Thelon Basin, Nunavut.
For further information: https://www.forumenergymetals.com.
ON BEHALF OF THE BOARD OF DIRECTORS
Richard J. Mazur, P.Geo.
President & CEO
Neither the TSX Venture Exchange nor its Regulation Services Provider (as that term is defined in the policies of the TSX Venture Exchange) accepts responsibility for the adequacy or accuracy of this release.
For further information contact:
Rick Mazur, P.Geo., President & CEO
mazur@forumenergymetals.com
Tel: 604-630-1585
To view the source version of this press release, please visit https://www.newsfilecorp.com/release/208486
News Provided by Newsfile via QuoteMedia
Ero Copper Reports First Quarter Operating and Financial Results
(all amounts in US dollars, unless otherwise noted)
Ero Copper Corp. (TSX: ERO, NYSE: ERO) ("Ero" or the "Company") is pleased to announce its operating and financial results for the three months ended March 31, 2024. Management will host a conference call tomorrow, Wednesday, May 8, 2024, at 11:30 a.m. eastern time to discuss the results. Dial-in details for the call can be found near the end of this press release.
HIGHLIGHTS
- The Tucumã Project is expected to achieve first copper concentrate production in early Q3 2024, marking a major inflection point for the Company
- Overall physical completion of approximately 97%
- Commissioning progressing ahead of schedule with major mechanical and sub- component commissioning completed during the quarter, as well as first ore through the crushing circuit and main conveyors
- Total direct project capital cost remains unchanged at $310 million
- First quarter copper production was 8,091 tonnes at C1 cash costs(*) of $2.30 per pound of copper produced. Including the benefit of realized gains on designated foreign exchange hedges, first quarter copper C1 cash costs(*) were $2.28 per pound
- Gold production during the quarter was a record 18,234 ounces at C1 cash costs (*) and All-in Sustaining Costs ("AISC") (*) of $395 and $797, respectively, per ounce of gold produced
- First quarter financial results reflect record gold production and operating margins at the Xavantina Operations as well as the sale of copper concentrate inventories carried over from Q4 2023 at the Caraíba Operations
- Net loss attributable to the owners of the Company of $7.1 million, or $0.07 per share on a diluted basis
- Adjusted net income attributable to the owners of the Company (*) of $16.8 million, or $0.16 per share on a diluted basis
- Adjusted EBITDA (*) of $43.3 million
- Available liquidity at quarter-end of $156.7 million, including $51.7 million in cash and cash equivalents plus $105.0 million of undrawn availability under the Company's senior secured revolving credit facility. Subsequent to quarter-end, to support the commencement of production and associated working capital needs at the Tucumã Project, the Company entered into a $50.0 million non-priced copper prepayment facility, which will be repaid through the delivery of copper at prevailing market prices.
- Following record operating performance at the Xavantina Operations during the quarter, the Company is increasing its 2024 gold production guidance from 55,000 to 60,000 ounces to a range of 60,000 to 65,000 ounces, and guiding towards the low end of its full-year cost guidance for the Xavantina Operations
- The Company is reaffirming all other 2024 production, cost and capital expenditure guidance ranges
(*) These are non-IFRS measures and do not have a standardized meaning prescribed by IFRS and might not be comparable to similar financial measures disclosed by other issuers. Please refer to the Company's discussion of Non-IFRS measures in its Management's Discussion and Analysis for the three months ended March 31, 2024 and the Reconciliation of Non-IFRS Measures section at the end of this press release.
"The Xavantina Operations continued to exceed our expectations during the first quarter, achieving record gold production driven by favorable grade reconciliations that have continued into the second quarter," said David Strang, Chief Executive Officer. "This trend has allowed us to increase our full-year gold production guidance, which we expect will translate to achieving the lower end of our 2024 gold cost guidance.
"Our first quarter financial results also showcase Xavantina's strong performance and reflect the sale of copper concentrate inventories carried over from the fourth quarter of 2023 at the Caraíba Operations. Combined with a strengthening gold and copper price environment, we are off to a solid start to 2024.
"I am also delighted to report that commissioning is advancing ahead of schedule at the Tucumã Project, and we expect to achieve first production early in the third quarter. With copper fundamentals stronger than ever, we are committed to maintaining our momentum and are excited as we near a significant inflection point in our growth trajectory."
FIRST QUARTER REVIEW
- Mining & Milling Operations
- The Caraíba Operations processed 853,371 tonnes of ore grading 1.08% copper, producing 8,091 tonnes of copper in concentrate for the quarter after metallurgical recoveries of 88.1%
- Mill throughput volumes increased 5.1% quarter-on-quarter following the successful completion of the Caraíba mill expansion in late 2023
- A planned decrease in mined and processed copper grades during the quarter was compounded by delays in underground development required to access scheduled high-grade stopes, resulting in a higher proportion of ore mined from lower grade stopes during the period
- The Xavantina Operations processed 37,834 tonnes of ore grading 16.38 grams per tonne ("gpt"), producing a record 18,234 ounces of gold in the quarter after metallurgical recoveries of 91.5%
- The Caraíba Operations processed 853,371 tonnes of ore grading 1.08% copper, producing 8,091 tonnes of copper in concentrate for the quarter after metallurgical recoveries of 88.1%
- Organic Growth Projects
- As construction of the Tucumã Project nears completion, commissioning is advancing ahead of schedule, and first copper concentrate production is expected to commence in early Q3 2024
- Completed mechanical and sub-component commissioning in Q1 2024, as well as first ore through the crushing circuit and main conveyors
- Commissioning of the process plant, including the ball mill, flotation circuit, and tailings and concentrate filters, remains on track for integrated commissioning in June 2024
- Sulphide ore stockpiled for process plant commissioning was approximately 36,000 tonnes with over 160,000 tonnes of ore drilled and ready to be blasted in the mine as of quarter-end
- The total direct project capital estimate remains unchanged at approximately $310 million
- To date, the Tucumã Project has recorded no lost-time injuries with over five million hours of work completed since 2022
- At the Caraíba Operations, main shaft sinking at the Pilar Mine's new external shaft is on track to achieve a projected depth of approximately 600 meters by year-end
- Reaming of the second and longest raisebore leg of the shaft, totaling 718 meters, was completed in early April 2024
- As construction of the Tucumã Project nears completion, commissioning is advancing ahead of schedule, and first copper concentrate production is expected to commence in early Q3 2024
Figure 1: The Tucumã Project's flotation circuit and tailings thickener (May 2024).
Figure 2: Tailings thickener at the Tucumã Project (May 2024).
Figure 3: Exposed sulphide ore at the Tucumã Project (May 2024).
SUBSEQUENT EVENTS
To support the commencement of production and associated working capital needs at the Tucumã Project, the Company entered into a $50.0 million non-priced copper prepayment facility in May 2024, structured by the Bank of Montreal and with participation by CIBC Capital Markets. This facility will be repaid over 27 equal monthly installments, beginning in October 2024, through the delivery of 272 tonnes of copper each month. Should any delivery exceed the monthly amortization payment of $2.1 million based on prevailing market prices, the excess value will be repaid to the Company.
Through the end of 2024, the Company has the option to increase the size of the non-priced copper prepayment facility from $50.0 million to $75.0 million.
OPERATING AND FINANCIAL HIGHLIGHTS
2024 - Q1 | 2023 - Q4 | 2023 - Q1 | ||||||||||
Operating Information | ||||||||||||
Copper (Caraíba Operations) | ||||||||||||
Ore Processed (tonnes) | 853,371 | 812,202 | 772,548 | |||||||||
Grade (% Cu) | 1.08 | 1.59 | 1.33 | |||||||||
Cu Production (tonnes) | 8,091 | 11,760 | 9,327 | |||||||||
Cu Production (000 lbs) | 17,838 | 25,926 | 20,564 | |||||||||
Cu Sold in Concentrate (tonnes) | 9,461 | 11,429 | 9,464 | |||||||||
Cu Sold in Concentrate (000 lbs) | 20,859 | 25,197 | 20,865 | |||||||||
Cu C1 cash cost (1)(2) | $ | 2.30 | $ | 1.75 | $ | 1.89 | ||||||
Gold (Xavantina Operations) | ||||||||||||
Ore Processed (tonnes) | 37,834 | 34,416 | 35,763 | |||||||||
Grade (g / tonne) | 16.38 | 17.18 | 11.85 | |||||||||
Au Production (oz) | 18,234 | 16,867 | 12,443 | |||||||||
Au C1 cash cost (1) | $ | 395 | $ | 413 | $ | 436 | ||||||
Au AISC (1) | $ | 797 | $ | 991 | $ | 946 | ||||||
Financial Highlights ($ in millions, except per share amounts) | ||||||||||||
Revenues | $ | 105.8 | $ | 116.4 | $ | 101.0 | ||||||
Gross profit | 31.2 | 41.9 | 40.1 | |||||||||
EBITDA (1) | 17.8 | 73.7 | 48.1 | |||||||||
Adjusted EBITDA (1) | 43.3 | 50.3 | 44.5 | |||||||||
Cash flow from operations | 17.2 | 49.4 | 16.4 | |||||||||
Net (loss) income | (6.8 | ) | 37.1 | 24.5 | ||||||||
Net (loss) income attributable to owners of the Company | (7.1 | ) | 36.5 | 24.2 | ||||||||
Per share (basic) | (0.07 | ) | 0.37 | 0.26 | ||||||||
Per share (diluted) | (0.07 | ) | 0.37 | 0.26 | ||||||||
Adjusted net income attributable to owners of the Company (1) | 16.8 | 20.7 | 22.5 | |||||||||
Per share (basic) | 0.16 | 0.21 | 0.24 | |||||||||
Per share (diluted) | 0.16 | 0.21 | 0.24 | |||||||||
Cash, cash equivalents, and short-term investments | 51.7 | 111.7 | 236.6 | |||||||||
Working (deficit) capital (1) | (28.6 | ) | 25.7 | 218.8 | ||||||||
Net debt (1) | 415.1 | 314.5 | 174.2 |
(1) EBITDA, adjusted EBITDA, adjusted net income (loss) attributable to owners of the Company, adjusted net income (loss) per share attributable to owners of the Company, net (cash) debt, working capital, copper C1 cash cost, copper C1 cash cost including foreign exchange hedges, gold C1 cash cost and gold AISC are non-IFRS measures. These measures do not have a standardized meaning prescribed by IFRS and might not be comparable to similar financial measures disclosed by other issuers. Please refer to the Company's discussion of Non-IFRS measures in its Management's Discussion and Analysis for the three months ended March 31, 2024 and the Reconciliation of Non-IFRS Measures section at the end of this press release.
(2) Copper C1 cash cost including foreign exchange hedges (per lb) in Q1 2024 was $2.28, compared to $1.84 in Q1 2023.
2024 PRODUCTION AND COST GUIDANCE (*)
Following record operating performance at the Xavantina Operations during the quarter, the Company is increasing its 2024 gold production guidance from 55,000 to 60,000 ounces to a range of 60,000 to 65,000 ounces. The Company expects mined and processed gold grades to remain above plan through the remainder of H1 2024, as positive grade reconciliations have continued into Q2 2024. While this trend may continue beyond Q2 2024, the Company is projecting a reversion to long-term block model grades for planned mining areas in H2 2024. As a result of higher full-year production expectations, the Company is guiding towards the low end of its full-year cost guidance for the Xavantina Operations.
Consolidated copper production of 59,000 to 72,000 tonnes in concentrate is expected to be weighted towards H2 2024, largely due to the anticipated commencement of production at the Tucumã Project in early Q3 2024. Consequently, consolidated copper C1 cash costs are projected to be lower in H2 2024 versus H1 2024.
The Company's updated cost guidance for 2024 assumes a foreign exchange rate of 5.00 BRL per USD, a gold price of $1,900 per ounce and a silver price of $23.00 per ounce.
Previous Guidance | Updated Guidance | |||
Consolidated Copper Production (tonnes) | ||||
Caraíba Operations | 42,000 - 47,000 | Unchanged | ||
Tucumã Operations | 17,000 - 25,000 | Unchanged | ||
Total | 59,000 - 72,000 | Unchanged | ||
Consolidated Copper C1 Cash Costs (1) Guidance | ||||
Caraíba Operations | $1.80 - $2.00 | Unchanged | ||
Tucumã Operations | $0.90 - $1.10 | Unchanged | ||
Total | $1.50 - $1.75 | Unchanged | ||
The Xavantina Operations | ||||
Au Production (ounces) | 55,000 - 60,000 | 60,000 - 65,000 | ||
Gold C1 Cash Cost (1) Guidance | $550 - $650 | Low End of Range | ||
Gold AISC (1) Guidance | $1,050 - $1,150 | Low End of Range |
* Guidance is based on certain estimates and assumptions, including but not limited to, mineral reserve estimates, grade and continuity of interpreted geological formations and metallurgical performance. Please refer to the Company's most recent Annual Information Form and Management of Risks and Uncertainties in the MD&A for complete risk factors.
(1) Please refer to the section titled "Alternative Performance (Non-IFRS) Measures" within the MD&A.
2024 CAPITAL EXPENDITURE GUIDANCE (*)
Full-year capital expenditures are projected to range from $299 to $349 million, including an estimated $30 to $40 million allocated to consolidated exploration programs. As the Company nears completion of the Tucumã Project, capital expenditures are expected to decrease in Q2 2024 compared to Q1 2024 and be weighted towards H1 2024.
Capital expenditure guidance assumes an exchange rate of 5.10 USD:BRL for the Tucumã Project based on designated foreign exchange hedges with a weighted average ceiling and floor of 5.10 and 5.23 USD:BRL, respectively. All other capital expenditures assume an exchange rate of 5.00 USD:BRL. Figures presented below are in USD millions.
Caraíba Operations | ||
Growth | $80 - $90 | |
Sustaining | $100 - $110 | |
Total, Caraíba Operations | $180 - $200 | |
Tucumã Project | ||
Growth | $65 - $75 | |
Capitalized Ramp-Up Costs | $4 - $6 | |
Sustaining | $2 - $5 | |
Total, Tucumã Project | $71 - $86 | |
Xavantina Operations | ||
Growth | $3 - $5 | |
Sustaining | $15 - $18 | |
Total, Xavantina Operations | $18 - $23 | |
Consolidated Exploration Programs | $30 - $40 | |
Company Total | ||
Growth | $148 - $170 | |
Capitalized Ramp-Up Costs | $4 - $6 | |
Sustaining | $117 - $133 | |
Exploration | $30 - $40 | |
Total, Company | $299 - $349 |
(*) Guidance is based on certain estimates and assumptions, including but not limited to, mineral reserve estimates, grade and continuity of interpreted geological formations and metallurgical performance. Please refer to the Company's most recent Annual Information Form and Management of Risks and Uncertainties in the MD&A for complete risk factors.
CONFERENCE CALL DETAILS
The Company will hold a conference call on Wednesday, May 8, 2024 at 11:30 am Eastern time (8:30 am Pacific time) to discuss these results.
Date: | Wednesday, May 8, 2024 |
Time: | 11:30 am Eastern time (8:30 am Pacific time) |
Dial in: | Canada/USA: 1-844-763-8274, International: +1-647-484-8814 please dial in 5-10 minutes prior and ask to join the call |
Pre-Register: | Registration link (https://dpregister.com/DiamondPassRegistration/register?confirmationNumber=10023373&linkSecurityString=f82a87e37a) (pre-register to bypass the live operator queue) |
Replay: | Canada/USA: 1-855-669-9658, International: +1-604-674-8052 |
Replay Passcode: | 0848 |
Reconciliation of Non-IFRS Measures
Financial results of the Company are presented in accordance with IFRS. The Company utilizes certain alternative performance (non-IFRS) measures to monitor its performance, including copper C1 cash cost, copper C1 cash cost including foreign exchange hedges, gold C1 cash cost, gold AISC, EBITDA, adjusted EBITDA, adjusted net income attributable to owners of the Company, adjusted net income per share, net (cash) debt, working capital and available liquidity. These performance measures have no standardized meaning prescribed within generally accepted accounting principles under IFRS and, therefore, amounts presented may not be comparable to similar measures presented by other mining companies. These non-IFRS measures are intended to provide supplemental information and should not be considered in isolation or as a substitute for measures of performance prepared in accordance with IFRS.
For additional details please refer to the Company's discussion of non-IFRS and other performance measures in its Management's Discussion and Analysis for the three months ended March 31, 2024 which is available on SEDAR+ at www.sedarplus.ca, and on EDGAR at www.sec.gov.
Copper C1 cash cost and copper C1 cash cost including foreign exchange hedges
The following table provides a reconciliation of copper C1 cash cost to cost of production, its most directly comparable IFRS measure.
Reconciliation: | 2024 - Q1 | 2023 - Q4 | 2023 - Q1 | |||||||||
Cost of production | $ | 42,227 | $ | 39,790 | $ | 36,285 | ||||||
Add (less): | ||||||||||||
Transportation costs & other | 1,252 | 1,853 | 1,339 | |||||||||
Treatment, refining, and other | 5,170 | 7,332 | 6,463 | |||||||||
By-product credits | (2,440 | ) | (3,394 | ) | (2,810 | ) | ||||||
Incentive payments | (1,199 | ) | (1,693 | ) | (1,237 | ) | ||||||
Net change in inventory | (3,893 | ) | 1,434 | (1,185 | ) | |||||||
Foreign exchange translation and other | (7 | ) | 20 | 15 | ||||||||
C1 cash costs | 41,110 | 45,342 | 38,870 | |||||||||
(Gain) loss on foreign exchange hedges | (276 | ) | (4,185 | ) | (932 | ) | ||||||
C1 cash costs including foreign exchange hedges | $ | 40,834 | $ | 41,157 | $ | 37,938 |
Mining | $ | 25,256 | $ | 26,646 | $ | 23,210 | ||||||
Processing | 7,177 | 8,177 | 6,554 | |||||||||
Indirect | 5,947 | 6,581 | 5,453 | |||||||||
Production costs | 38,380 | 41,404 | 35,217 | |||||||||
By-product credits | (2,440 | ) | (3,394 | ) | (2,810 | ) | ||||||
Treatment, refining and other | 5,170 | 7,332 | 6,463 | |||||||||
C1 cash costs | 41,110 | 45,342 | 38,870 | |||||||||
(Gain) loss on foreign exchange hedges | (276 | ) | (4,185 | ) | (932 | ) | ||||||
C1 cash costs including foreign exchange hedges | $ | 40,834 | $ | 41,157 | $ | 37,938 | ||||||
Costs per pound | ||||||||||||
Payable copper produced (lb, 000) | 17,838 | 25,926 | 20,564 | |||||||||
Mining | $ | 1.42 | $ | 1.03 | $ | 1.13 | ||||||
Processing | $ | 0.40 | $ | 0.32 | $ | 0.32 | ||||||
Indirect | $ | 0.33 | $ | 0.25 | $ | 0.27 | ||||||
By-product credits | $ | (0.14 | ) | $ | (0.13 | ) | $ | (0.14 | ) | |||
Treatment, refining and other | $ | 0.29 | $ | 0.28 | $ | 0.31 | ||||||
Copper C1 cash costs | $ | 2.30 | $ | 1.75 | $ | 1.89 | ||||||
(Gain) loss on foreign exchange hedges | $ | (0.02 | ) | $ | (0.16 | ) | $ | (0.05 | ) | |||
Copper C1 cash costs including foreign exchange hedges | $ | 2.28 | $ | 1.59 | $ | 1.84 |
Gold C1 cash cost and gold AISC
The following table provides a reconciliation of gold C1 cash cost and gold AISC to cost of production, its most directly comparable IFRS measure.
Reconciliation: | 2024 - Q1 | 2023 - Q4 | 2023 - Q1 | |||||||||
Cost of production | $ | 7,255 | $ | 7,122 | $ | 6,107 | ||||||
Add (less): | ||||||||||||
Incentive payments | (443 | ) | (386 | ) | (407 | ) | ||||||
Net change in inventory | 264 | 65 | (352 | ) | ||||||||
By-product credits | (189 | ) | (248 | ) | (176 | ) | ||||||
Smelting and refining | 90 | 113 | 76 | |||||||||
Foreign exchange translation and other | 232 | 296 | 176 | |||||||||
C1 cash costs | $ | 7,209 | $ | 6,962 | $ | 5,424 | ||||||
Site general and administrative | 1,353 | 1,492 | 1,232 | |||||||||
Accretion of mine closure and rehabilitation provision | 92 | 111 | 105 | |||||||||
Sustaining capital expenditure | 3,254 | 5,499 | 3,013 | |||||||||
Sustaining lease payments | 2,122 | 1,861 | 1,660 | |||||||||
Royalties and production taxes | 510 | 785 | 338 | |||||||||
AISC | $ | 14,540 | $ | 16,710 | $ | 11,772 |
Costs | ||||||||||||
Mining | $ | 3,820 | $ | 3,430 | $ | 2,567 | ||||||
Processing | 2,259 | 2,315 | 1,905 | |||||||||
Indirect | 1,229 | 1,352 | 1,052 | |||||||||
Production costs | 7,308 | 7,097 | 5,524 | |||||||||
Smelting and refining costs | 90 | 113 | 76 | |||||||||
By-product credits | (189 | ) | (248 | ) | (176 | ) | ||||||
C1 cash costs | $ | 7,209 | $ | 6,962 | $ | 5,424 | ||||||
Site general and administrative | 1,353 | 1,492 | 1,232 | |||||||||
Accretion of mine closure and rehabilitation provision | 92 | 111 | 105 | |||||||||
Sustaining capital expenditure | 3,254 | 5,499 | 3,013 | |||||||||
Sustaining leases | 2,122 | 1,861 | 1,660 | |||||||||
Royalties and production taxes | 510 | 785 | 338 | |||||||||
AISC | $ | 14,540 | $ | 16,710 | $ | 11,772 | ||||||
Costs per ounce | ||||||||||||
Payable gold produced (ounces) | 18,234 | 16,867 | 12,443 | |||||||||
Mining | $ | 209 | $ | 203 | $ | 206 | ||||||
Processing | $ | 124 | $ | 137 | $ | 153 | ||||||
Indirect | $ | 67 | $ | 80 | $ | 85 | ||||||
Smelting and refining | $ | 5 | $ | 7 | $ | 6 | ||||||
By-product credits | $ | (10 | ) | $ | (14 | ) | $ | (14 | ) | |||
Gold C1 cash cost | $ | 395 | $ | 413 | $ | 436 | ||||||
Gold AISC | $ | 797 | $ | 991 | $ | 946 |
Earnings before interest, taxes, depreciation and amortization (EBITDA) and Adjusted EBITDA
The following table provides a reconciliation of EBITDA and Adjusted EBITDA to net income, its most directly comparable IFRS measure.
Reconciliation: | 2024 - Q1 | 2023 - Q4 | 2023 - Q1 | |||||||||
Net (Loss) Income | $ | (6,830 | ) | $ | 37,052 | $ | 24,500 | |||||
Adjustments: | ||||||||||||
Finance expense | 4,634 | 5,284 | 6,526 | |||||||||
Finance income | (1,468 | ) | (1,989 | ) | (4,138 | ) | ||||||
Income tax (recovery) expense | (1,853 | ) | 8,415 | 4,666 | ||||||||
Amortization and depreciation | 23,296 | 24,980 | 16,506 | |||||||||
EBITDA | $ | 17,779 | $ | 73,742 | $ | 48,060 | ||||||
Foreign exchange loss (gain) | 18,996 | (24,871 | ) | (8,621 | ) | |||||||
Share based compensation | 6,545 | 477 | 5,017 | |||||||||
Unrealized (gain) loss on copper derivatives | (64 | ) | 955 | — | ||||||||
Adjusted EBITDA | $ | 43,256 | $ | 50,303 | $ | 44,456 |
Adjusted net income attributable to owners of the Company and Adjusted net income per share attributable to owners of the Company
The following table provides a reconciliation of Adjusted net income attributable to owners of the Company and Adjusted EPS to net income attributable to the owners of the Company, its most directly comparable IFRS measure.
Reconciliation: | 2024 - Q1 | 2023 - Q4 | 2023 - Q1 | |||||||||
Net (loss) income as reported attributable to the owners of the Company | $ | (7,141 | ) | $ | 36,549 | $ | 24,154 | |||||
Adjustments: | ||||||||||||
Share based compensation | 6,545 | 477 | 5,017 | |||||||||
Unrealized foreign exchange loss (gain) on USD denominated balances in MCSA | 11,257 | (10,308 | ) | (4,753 | ) | |||||||
Unrealized foreign exchange loss (gain) on foreign exchange derivative contracts | 9,304 | (9,852 | ) | (3,152 | ) | |||||||
Unrealized (gain) loss on copper derivative contracts | (64 | ) | 951 | — | ||||||||
Tax effect on the above adjustments | (3,128 | ) | 2,932 | 1,208 | ||||||||
Adjusted net income attributable to owners of the Company | $ | 16,773 | $ | 20,749 | $ | 22,474 | ||||||
Weighted average number of common shares | ||||||||||||
Basic | 102,769,444 | 98,099,791 | 92,294,045 | |||||||||
Diluted | 103,242,437 | 98,482,755 | 93,218,281 | |||||||||
Adjusted EPS | ||||||||||||
Basic | $ | 0.16 | $ | 0.21 | $ | 0.24 | ||||||
Diluted | $ | 0.16 | $ | 0.21 | $ | 0.24 |
Net (Cash) Debt
The following table provides a calculation of net (cash) debt based on amounts presented in the Company's condensed consolidated interim financial statements as at the periods presented.
March 31, 2024 | December 31, 2023 | March 31, 2023 | |||||||||
Current portion of loans and borrowings | $ | 16,059 | $ | 20,381 | $ | 9,221 | |||||
Long-term portion of loans and borrowings | 450,743 | 405,852 | 401,595 | ||||||||
Less: | |||||||||||
Cash and cash equivalents | (51,692 | ) | (111,738 | ) | (209,908 | ) | |||||
Short-term investments | — | — | (26,739 | ) | |||||||
Net debt (cash) | $ | 415,110 | $ | 314,495 | $ | 174,169 |
Working Ca pital and Available Liquidity
The following table provides a calculation for these based on amounts presented in the Company's condensed consolidated interim financial statements as at the periods presented.
March 31, 2024 | December 31, 2023 | March 31, 2023 | |||||||||
Current assets | $ | 129,960 | $ | 199,487 | $ | 331,241 | |||||
Less: Current liabilities | (158,565 | ) | (173,800 | ) | (112,448 | ) | |||||
Working (deficit) capital | $ | (28,605 | ) | $ | 25,687 | $ | 218,793 | ||||
Cash and cash equivalents | 51,692 | 111,738 | 209,908 | ||||||||
Short-term investments | — | — | 26,739 | ||||||||
Available undrawn revolving credit facilities | 105,000 | 150,000 | 150,000 | ||||||||
Available liquidity | $ | 156,692 | $ | 261,738 | $ | 386,647 |
ABOUT ERO COPPER CORP
Ero is a high-margin, high-growth, low carbon-intensity copper producer with operations in Brazil and corporate headquarters in Vancouver, B.C., Canada. The Company's primary asset is a 99.6% interest in the Brazilian copper mining company, Mineração Caraíba S.A. ("MCSA"), 100% owner of the Company's Caraíba Operations (formerly known as the MCSA Mining Complex), which are located in the Curaçá Valley, Bahia State, Brazil and include the Pilar and Vermelhos underground mines and the Surubim open pit mine, and the Tucumã Project (formerly known as Boa Esperança), an IOCG-type copper project located in Pará, Brazil. The Company also owns 97.6% of NX Gold S.A. ("NX Gold") which owns the Xavantina Operations (formerly known as the NX Gold Mine), comprised of an operating gold and silver mine located in Mato Grosso, Brazil. Additional information on the Company and its operations, including technical reports on the Caraíba Operations, Xavantina Operations and Tucumã Project, can be found on the Company's website (www.erocopper.com), on SEDAR+ (www.sedarplus.ca), and on EDGAR (www.sec.gov). The Company's shares are publicly traded on the Toronto Stock Exchange and the New York Stock Exchange under the symbol "ERO".
FOR MORE INFORMATION, PLEASE CONTACT
Courtney Lynn, SVP, Corporate Development, Investor Relations & Sustainability
(604) 335-7504
info@erocopper.com
CAUTION REGARDING FORWARD LOOKING INFORMATION AND STATEMENTS
This press release contains "forward-looking statements" within the meaning of the United States Private Securities Litigation Reform Act of 1995 and "forward-looking information" within the meaning of applicable Canadian securities legislation (collectively, "forward-looking statements"). Forward-looking statements include statements that use forward-looking terminology such as "may", "could", "would", "will", "should", "intend", "target", "plan", "expect", "budget", "estimate", "forecast", "schedule", "anticipate", "believe", "continue", "potential", "view" or the negative or grammatical variation thereof or other variations thereof or comparable terminology. Forward-looking statements may include, but are not limited to, statements with respect to the Company's expected production, operating costs and capital expenditures at the Caraíba Operations, the Tucumã Project and the Xavantina Operations; estimated completion dates for certain milestones, including the commissioning timeline and initial production at the Tucumã Project; a continuation of elevated gold grades at the Xavantina Operations; and any other statement that may predict, forecast, indicate or imply future plans, intentions, levels of activity, results, performance or achievements.
Forward-looking statements are subject to a variety of known and unknown risks, uncertainties and other factors that could cause actual results, actions, events, conditions, performance or achievements to materially differ from those expressed or implied by the forward-looking statements, including, without limitation, risks discussed in this press release and in the Company's Annual Information Form for the year ended December 31, 2023 ("AIF") under the heading "Risk Factors". The risks discussed in this press release and in the AIF are not exhaustive of the factors that may affect any of the Company's forward-looking statements. Although the Company has attempted to identify important factors that could cause actual results, actions, events, conditions, performance or achievements to differ materially from those contained in forward-looking statements, there may be other factors that cause results, actions, events, conditions, performance or achievements to differ from those anticipated, estimated or intended.
Forward-looking statements are not a guarantee of future performance. There can be no assurance that forward-looking statements will prove to be accurate, as actual results and future events could differ materially from those anticipated in such statements. Forward-looking statements involve statements about the future and are inherently uncertain, and the Company's actual results, achievements or other future events or conditions may differ materially from those reflected in the forward-looking statements due to a variety of risks, uncertainties and other factors, including, without limitation, those referred to herein and in the AIF under the heading "Risk Factors".
The Company's forward-looking statements are based on the assumptions, beliefs, expectations and opinions of management on the date the statements are made, many of which may be difficult to predict and beyond the Company's control. In connection with the forward-looking statements contained in this press release and in the AIF, the Company has made certain assumptions about, among other things: favourable equity and debt capital markets; the ability to raise any necessary additional capital on reasonable terms to advance the production, development and exploration of the Company's properties and assets; future prices of copper, gold and other metal prices; the timing and results of exploration and drilling programs; the accuracy of any mineral reserve and mineral resource estimates; the geology of the Caraíba Operations, the Xavantina Operations and the Tucumã Project being as described in the respective technical report for each property; production costs; the accuracy of budgeted exploration, development and construction costs and expenditures; the price of other commodities such as fuel; future currency exchange rates and interest rates; operating conditions being favourable such that the Company is able to operate in a safe, efficient and effective manner; work force continuing to remain healthy in the face of prevailing epidemics, pandemics or other health risks, political and regulatory stability; the receipt of governmental, regulatory and third party approvals, licenses and permits on favourable terms; obtaining required renewals for existing approvals, licenses and permits on favourable terms; requirements under applicable laws; sustained labour stability; stability in financial and capital goods markets; availability of equipment; positive relations with local groups and the Company's ability to meet its obligations under its agreements with such groups; and satisfying the terms and conditions of the Company's current loan arrangements. Although the Company believes that the assumptions inherent in forward-looking statements are reasonable as of the date of this press release, these assumptions are subject to significant business, social, economic, political, regulatory, competitive and other risks and uncertainties, contingencies and other factors that could cause actual actions, events, conditions, results, performance or achievements to be materially different from those projected in the forward-looking statements. The Company cautions that the foregoing list of assumptions is not exhaustive. Other events or circumstances could cause actual results to differ materially from those estimated or projected and expressed in, or implied by, the forward-looking statements contained in this press release. There can be no assurance that forward-looking statements will prove to be accurate, as actual results and future events could differ materially from those anticipated in such statements. Accordingly, readers should not place undue reliance on forward-looking statements.
Forward-looking statements contained herein are made as of the date of this press release and the Company disclaims any obligation to update or revise any forward-looking statement, whether as a result of new information, future events or results or otherwise, except as and to the extent required by applicable securities laws.
CAUTIONARY NOTES REGARDING MINERAL RESOURCE AND MINERAL RESERVE ESTIMATES
Unless otherwise indicated, all reserve and resource estimates included in this press release and the documents incorporated by reference herein have been prepared in accordance with National Instrument 43-101, Standards of Disclosure for Mineral Projects ("NI 43-101") and the Canadian Institute of Mining, Metallurgy and Petroleum (the "CIM") — CIM Definition Standards on Mineral Resources and Mineral Reserves, adopted by the CIM Council, as amended (the "CIM Standards"). NI 43-101 is a rule developed by the Canadian Securities Administrators that establishes standards for all public disclosure an issuer makes of scientific and technical information concerning mineral projects. Canadian standards, including NI 43-101, differ significantly from the requirements of the United States Securities and Exchange Commission (the "SEC"), and reserve and resource information included herein may not be comparable to similar information disclosed by U.S. companies. In particular, and without limiting the generality of the foregoing, this press release and the documents incorporated by reference herein use the terms "measured resources," "indicated resources" and "inferred resources" as defined in accordance with NI 43-101 and the CIM Standards.
Further to recent amendments, mineral property disclosure requirements in the United States (the "U.S. Rules") are governed by subpart 1300 of Regulation S-K of the U.S. Securities Act of 1933, as amended (the "U.S. Securities Act") which differ from the CIM Standards. As a foreign private issuer that is eligible to file reports with the SEC pursuant to the multi-jurisdictional disclosure system (the "MJDS"), Ero is not required to provide disclosure on its mineral properties under the U.S. Rules and will continue to provide disclosure under NI 43-101 and the CIM Standards. If Ero ceases to be a foreign private issuer or loses its eligibility to file its annual report on Form 40-F pursuant to the MJDS, then Ero will be subject to the U.S. Rules, which differ from the requirements of NI 43-101 and the CIM Standards.
Pursuant to the new U.S. Rules, the SEC recognizes estimates of "measured mineral resources", "indicated mineral resources" and "inferred mineral resources". In addition, the definitions of "proven mineral reserves" and "probable mineral reserves" under the U.S. Rules are now "substantially similar" to the corresponding standards under NI 43-101. Mineralization described using these terms has a greater amount of uncertainty as to its existence and feasibility than mineralization that has been characterized as reserves. Accordingly, U.S. investors are cautioned not to assume that any measured mineral resources, indicated mineral resources, or inferred mineral resources that Ero reports are or will be economically or legally mineable. Further, "inferred mineral resources" have a greater amount of uncertainty as to their existence and as to whether they can be mined legally or economically. Under Canadian securities laws, estimates of "inferred mineral resources" may not form the basis of feasibility or pre-feasibility studies, except in rare cases. While the above terms under the U.S. Rules are "substantially similar" to the standards under NI 43-101 and CIM Standards, there are differences in the definitions under the U.S. Rules and CIM Standards. Accordingly, there is no assurance any mineral reserves or mineral resources that Ero may report as "proven mineral reserves", "probable mineral reserves", "measured mineral resources", "indicated mineral resources" and "inferred mineral resources" under NI 43-101 would be the same had Ero prepared the reserve or resource estimates under the standards adopted under the U.S. Rules.
Figures accompanying this announcement are available at:
https://www.globenewswire.com/NewsRoom/AttachmentNg/513b9f06-c814-4f6b-9950-a06e33b34540
https://www.globenewswire.com/NewsRoom/AttachmentNg/c9d5ede1-7233-4061-b519-42a445637b59
https://www.globenewswire.com/NewsRoom/AttachmentNg/11f4eba4-600f-464b-ab33-9040d376868c
News Provided by GlobeNewswire via QuoteMedia
6 Copper ETFs and ETNs (Updated 2024)
There’s more than one way to invest in copper. In addition to buying shares of copper stocks, investors can gain exposure through copper exchange-traded funds (ETFs) or copper exchange-traded notes (ETNs).
For the uninitiated, ETFs are securities that trade like stocks on an exchange, but track an index, commodity, bonds or a basket of assets like an index fund. In the case of base metal copper, there are various options — an ETF can track specific groups of copper-focused companies, as well as copper futures contracts or even physical copper.
ETNs also track an underlying asset and trade like stocks on an exchange, but they differ from ETFs in some ways. Specifically, ETNs are more like bonds — they are unsecured debt notes issued by an institution, and can be held to maturity or bought and sold at will. The main disadvantage to be aware of is that investors risk total default if an ETN’s underwriter goes bankrupt.
The copper outlook is strong due to structural supply deficits and positive demand fundamentals, and many investors are wondering how to take advantage of this good news in the copper market.
Here the Investing News Network presents five copper ETFs and one copper ETN that may be worth considering. All data was current as of April 23, 2024. Read on to learn more about these vehicles.
1. Global X Copper Miners ETF (ARCA:COPX)
Assets under management (AUM): US$2.12 billion
The Global X Copper Miners ETF tracks the Solactive Global Copper Miners Index, which covers copper exploration companies, developers and producers. The fund has an expense ratio of 0.65 percent.
COPX currently has 37 holdings, of which the top companies include Ivanhoe Mines (TSX:IVN,OTCQX:IVPAF), Lundin Mining (TSX:LUN,OTC Pink:LUNMF) and Southern Copper (NYSE:SCCO).
2. United States Copper Index Fund (ARCA:CPER)
AUM: US$193.37 million
The United States Copper Index Fund aims to give investors exposure to a portfolio of copper futures without using a commodity futures account. It also has an expense ration of 0.65 percent.
The fund tracks the performance of the SummerHaven Copper Index Total Return (INDEXNYSEGIS:SCITR), which is calculated based on certain copper futures contracts selected on a monthly basis.
3. iShares Copper and Metals Mining ETF (NASDAQ:ICOP)
AUM: US$15.03 million
The iShares Copper and Metals Mining ETF tracks the STOXX Global Copper and Metals Mining Index, which is composed of public companies primarily engaged in copper and metal mining. The fund has an expense ratio of 0.47 percent.
More than 31 percent of ICOP's 35 holdings are based in Canada, while nearly 12 percent call Australia home; 11 percent are located in the US. The fund's top holdings include Freeport-McMoRan (NYSE:FCX), Southern Copper, Ivanhoe and major miner BHP (ASX:BHP,NYSE:BHP,LSE:BHP).
4. Sprott Copper Miners ETF (NASDAQ:COPP)
AUM: US$21.3 million
Sprott Asset Management bills its newly launched Copper Miners ETF as "the only pure-play ETF focused on large-, mid- and small-cap copper mining companies that are providing a critical mineral necessary for the clean energy transition." Having come to market in March 2024, this fund has an expense ration of 0.65 percent.
COPP tracks 40 constituents, with more than 33 percent based in Canada, another nearly 33 percent based in the US and about 11 percent based in Chile. The fund's top holdings include Freeport-McMoRan, Antofagasta (LSE:ANTO,OTC Pink:ANFGF) and Southern Copper.
5. Sprott Junior Copper Miners ETF (NASDAQ:COPJ)
AUM: US$8.63 million
Launched in February 2023, the Sprott Junior Copper Miners is a pure-play ETF that, as its name suggests, is focused on small copper miners. It has the largest expense ratio (0.75 percent) of the funds on this list.
Of its 40 holdings, more than 55 percent call Canada home, while another 21 percent are in Australia and 6.5 percent are based out of Peru. COPJ's top three holdings are Taseko Mines (TSX:TKO,NYSEAMERICAN:TGB), Hudbay Minerals (NYSE:HBM) and Compania de Minas Buenaventura (NYSE:BVN).
6. iPath Series B Bloomberg Copper Subindex Total Return ETN (ARCA:JJC)
AUM: US$37.97 million
The iPath Series B Bloomberg Copper Subindex Total Return ETN provides exposure to the Bloomberg Copper Subindex Total Return. According to ETF Database, "For investors seeking exposure to copper beyond physical exposure or through a mining firm, JJC is the only pure play choice available." It has the lowest expense ratio on this list, coming in at 0.45 percent.
Unlike an ETF, an ETN does not own the underlying asset. Instead, an ETN functions in the same way as an uninsured bond. Investopedia states that investors take their profits when they sell the note or it reaches maturity.
This is an updated version of an article originally published by the Investing News Network in 2015.
Don’t forget to follow us @INN_Resource for real-time updates!
Securities Disclosure: I, Melissa Pistilli, hold no direct investment interest in any company mentioned in this article.
Gidji JV Exploration Update
Miramar Resources Limited (ASX:M2R, “Miramar” or “the Company”) provides the following update on exploration activities within the Company’s strategic Eastern Goldfields project portfolio.
- RC drilling intersects “Paddington-style” dolerite at Blackfriars
- Potential bedrock structures identified in aircore assay data
As previously advised, the Company secured a drill rig at short notice and completed a single RC drill hole at the high-priority Blackfriars prospect, within the Gidji JV Project (“Gidji”).
GJRC028 was drilled beneath aircore hole GJAC627 (1m @ 11.8g/t Au and 6g/t Ag EOH) and planned to intersect the dolerite footwall contact but was abandoned at 130m due to difficult drilling conditions associated with running sands in the overlying Gidji Paleochannel.
The hole intersected a quartz-dolerite unit, similar to the >2 million ounce Paddington gold deposit along strike to the north, with significant sulphide mineralisation and quartz-carbonate stringer veins from 113m downhole (Figure 1).
Samples of the last three metres before the hole was abandoned contain anomalous gold, silver and antimony along with the increase in sulphide mineralisation (Table 2).
Figure 1. Examples of quartz-dolerite with sulphides (field of view ~20mm).
Miramar’s Executive Chairman, Mr Allan Kelly, said the Blackfriars target remained untested at this stage.
“Frustratingly, we had to abandon the hole just when it was starting to look interesting,” he said.
“The reason that the Gidji Project has remained underexplored for so long, despite its prime location on a major highway between two major gold camps, is due in large part to the presence of extensive transported cover and the Gidji Paleochannel,” Mr Kelly said.
“This makes drilling more challenging than in other parts of the Goldfields but also means that any potentially significant bedrock gold mineralisation remains undiscovered,” he said.
“Given the favourable geology and structural setting, and the amount of shallow gold we have outlined from aircore drilling so far, we still believe Gidji has the potential to host significant bedrock gold mineralisation in one or more deposits,” he added.
Click here for the full ASX Release
This article includes content from Miramar Resources Limited, licensed for the purpose of publishing on Investing News Australia. This article does not constitute financial product advice. It is your responsibility to perform proper due diligence before acting upon any information provided here. Please refer to our full disclaimer here.
Latest News
Latest Press Releases
Related News
TOP STOCKS
Investing News Network websites or approved third-party tools use cookies. Please refer to the cookie policy for collected data, privacy and GDPR compliance. By continuing to browse the site, you agree to our use of cookies.