The Conversation (0)
Oct. 16, 2015 04:33PM PST
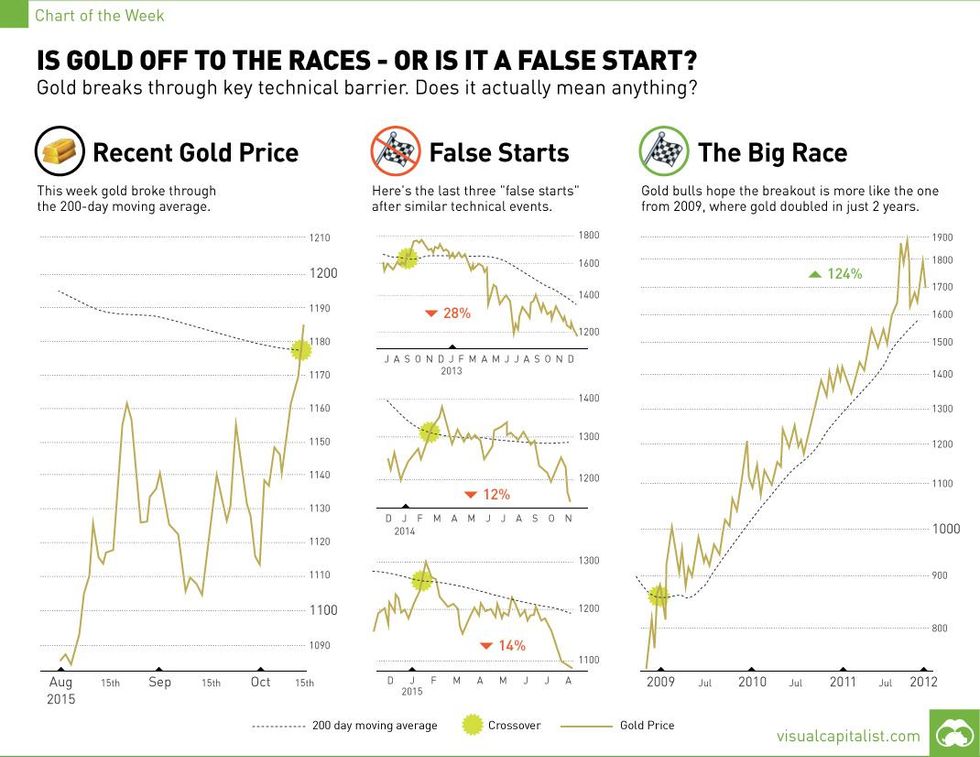
Visual Capitalist posted an infographic that looks at gold’s recent price activity. The yellow metal recently broke through its 200-day moving average, reaching its highest price in three months at just shy of $1,200 per ounce.
Visual Capitalist posted an infographic that looks at gold’s recent price activity. The yellow metal recently broke through its 200-day moving average, reaching its highest price in three months at just shy of $1,200 per ounce.
As the news outlet points out, when gold crosses its 200-day moving average, the results can sometimes be very positive. But will that be the case this time? Take a look at the infographic below for some insight.
Click here to view the infographic on Visual Capitalist’s website.