
October 06, 2024
Manuka Resources Limited (“Manuka” or the “Company”) welcomes the inclusion its 100 percent owned subsidiary Trans-Tasman Resources Limited's ("TTR") Taranaki VTM iron sands project off the coast of Taranaki in the government's Schedule 2 of the Fast Track list as released on Sunday 6 October 2024.
The project was assessed by the independent Projects Advisory Group and the responsible Ministers who consider project meets the Bill's purpose to facilitate the delivery of infrastructure and development projects with significant regional and national benefit.
The Fast Track Approvals Bill is now due for reporting back from the Select Committee on 18 October 2024 and expected to be enacted before the end of the year.
The Taranaki VTM project has the potential to significantly increase New Zealand's export earnings and produce the critical minerals required for the transition to a zero-emissions energy system.
"This is a welcome development and we recognise that this is the first step in the government's approvals process, including finalising the Fast Track enabling legislation. Once enacted we will have to then make an application to the Environmental Protection Authority to be assessed under the Bill. Our project offers huge economic development opportunities for New Zealand including hundreds of jobs in the Taranaki region." Manuka Executive Director and TTR Executive Chairman Alan Eggers says.
"It is of national significance as we have identified a world-class vanadium rich iron sands resource that has the ability to contribute $1 billion annually to export earnings, doubling the entire mining sector's current contribution to New Zealand's economy."
Mr Eggers says the Taranaki VTM project proposes to harvest iron sands in the South Taranaki Bight containing iron ore and critical minerals vanadium and titanium that are in high demand globally as countries, including New Zealand, transition from fossil fuels to renewable energy and electrification of their economies.
Furthermore, he notes the benefits to the Taranaki region include 300 Taranaki-based jobs and an additional 170 jobs in the wider region, locally a $250 million annual spend on operations and staff, new infrastructure at Port Taranaki and Whanganui Port, and the establishment of a training institute and logistics hub in Hawera with head office in New Plymouth.
Mr Eggers continues that the company's environmental obligations are incredibly important, and states "we don't for a minute believe that the Fast Track process is a way to minimise or short cut these. We have already agreed to more than 100 operating conditions and a full set of management plans with the Environmental Protection Authority to recover the resource after completing New Zealand's most comprehensive mine development environmental application ever. The project will continuously restore the seabed to its natural state within two years as we progress and, despite what our opponents say, it will have minimal impact on the South Taranaki Bight marine and coastal environment.
The project provides an opportunity for New Zealand to become a world-leader in marine mineral harvesting technologies and, in a time of geopolitical uncertainty, to potentially be the largest producer of vanadium in the western world."
About Manuka Resources Limited
Manuka Resources Limited (ASX: MKR) is an Australian mining and exploration company with key gold and silver assets located in the Cobar Basin (NSW), and offshore vanadium and titanium bearing iron sands in the South Taranaki Bight of New Zealand.
The Taranaki VTM Project (South Taranaki Bight, New Zealand) Manuka is the 100% owner of the Taranaki VTM (vanadium titanomagnetite) Iron Sands Project. The Taranaki VTM Project resource was released on ASX on 1 March 2023.
The Project is located 22 km to 36 km offshore in New Zealand's EEZ, or Exclusive Economic Zone, outside the 12 nautical limit from the shoreline, in waters ranging between 20 to 50 metres depth and has a granted mining permit, MP55581, permitting production of 5Mtpa. On granting of final government approvals to operate the Company will complete its Bankable Feasibility Study on the Project. The Project is anticipated to sit in the lowest quartile of the iron ore production cost curve.
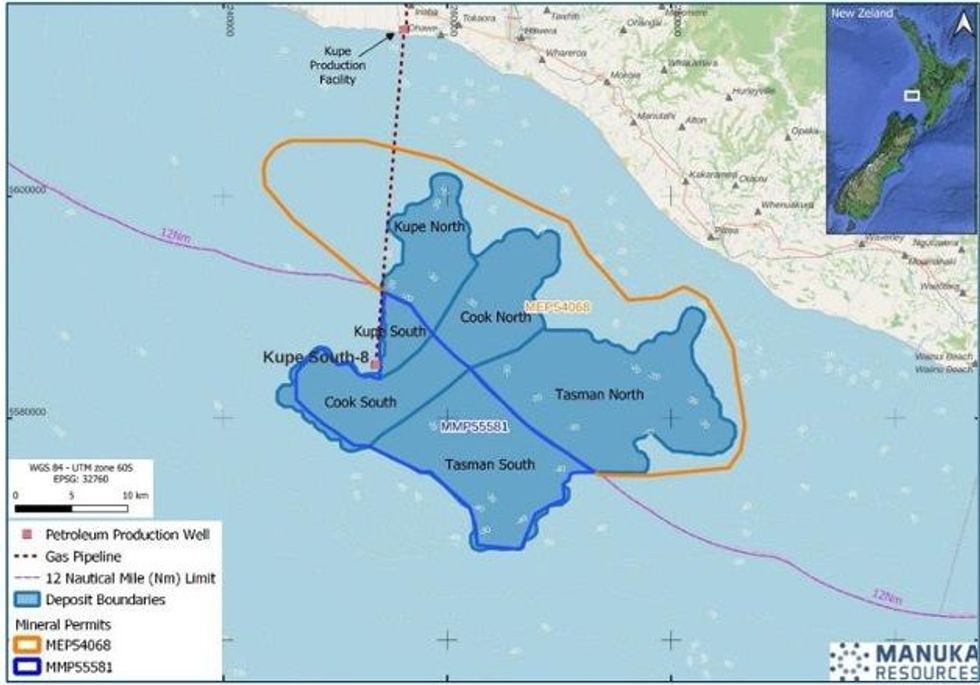
Location of Taranaki VTM Project.
Click here for the full ASX Release
This article includes content from Manuka Resources Limited, licensed for the purpose of publishing on Investing News Australia. This article does not constitute financial product advice. It is your responsibility to perform proper due diligence before acting upon any information provided here. Please refer to our full disclaimer here.
MKR:AU
Sign up to get your FREE
Manuka Resources Investor Kit
and hear about exciting investment opportunities.
- Corporate info
- Insights
- Growth strategies
- Upcoming projects
GET YOUR FREE INVESTOR KIT
The Conversation (0)
26 March
Manuka Resources
Investor Insight
Manuka Resources’ unique value proposition is focused on its three fully licenced projects, which include two precious metals assets in one of Australia’s most prolific regions for base and precious metals, and a company-making iron sands (vanadium and titanium co-products) project in New Zealand’s exclusive economic zone (EEZ) off the Taranaki bight. Manuka Resources is well-placed to deliver significant shareholder value, driven by a phased strategy that includes a clear pathway to near-term precious metals production.
Strategy Overview
Manuka Resources (ASX:MKR) is focused on bringing its precious metals assets in the Cobar Basin into production, as well as progressing its New Zealand domiciled Taranaki VTM iron sands project.
The company previously revealed a phased strategy focused on delivering maximum value to its shareholders. The first phase focused on bringing back the Mt Boppy gold mine into production and it released an optimised production plan for the mine restart. At the time, the company believed silver production would follow gold but noted it was flexible in this regard. In any event and simultaneous to this, will be the ongoing development of the Taranaki vanadium titano-magnetite (VTM) project.
The Cobar Basin located in the central-west of New South Wales, is one of the richest mining provinces in Australia, home to some of Australia’s largest mining companies and explorers.
The Mt Boppy gold mine was historically one of the richest in NSW, Australia and produced ~500,000 oz gold at an average grade of 15 grams per ton (g/t) gold. Accordingly, the company is very excited about its exploration potential.
Drone image looking South showing the main components of the Rock Dump and tailing resources in relation to the Mt. Boppy open pit.
The initial five-year mine plan is largely focused on the screening and processing of gold-bearing waste material above ground on the Mt Boppy mine site. The company had been processing these wastes from June 2023 to December 2023 at its Wonawinta plant and now will look to optimize the process.
The Wonawinta silver project will be the largest primary silver producer in Australia and expected to be back in silver production within 12 months. Manuka has released a maiden ore reserve (under its ownership) of 4.8Mt1 at 53.8g/t silver containing 8.4Moz of silver comprising proven ore reserves of 0.8Mt at 50.8g/t silver; and probable ore reserves of 4.1Mt at 54.3g/t silver. Ore Reserve is based solely on shallow (<40m deep) oxide material.
The Wonawinta 100tph Ball Mill
The gold and silver market appears to be in an upward trend, with prices for both precious metals hitting their all-time highs recently, in Australian dollar terms for silver, which bodes very positively for MKR.
Company Highlights
- Manuka Resources is an ASX-listed mining company focused on producing gold and silver from its two 100 percent owned fully permitted projects (one gold and one silver) in the Cobar Basin in New South Wales, Australia.
- In addition, MKR’s wholly owned subsidiary Trans-Tasman Resources Limited (“TTR”) is the owner of the Taranaki VTM (vanadiferous titanomagnetite) iron sands project, located in the New Zealand EEZ, off the south-west coast of the north island.
- Manuka released the details of the Taranaki VTM project’s pre-feasibility study (PFS) on 26 March 2025, which highlights the extremely robust economics of the project with an NPV10 of US$1.2B and IRR 39 percent
- TTR will also be lodging its application under New Zealand’s Fast Track Approvals Act for the Taranaki VTM project imminently. (The project was included in Schedule 2 of the Act). Successful conclusion of review under the Fast Track pathway will result in final regulatory approvals (marine discharge consent) being granted, completing the full suite of consents to operate the project for 20 years.
- The Company’s primary focus for its precious metals assets is on bringing both the fully permitted Wonawinta silver project and the Mt Boppy gold mine back into production during 2025. The Wonawinta processing plant (primarily constructed for silver production in 2012 with production capacity of 850,000-1 million tpa) has been recently used for both gold and silver processing and is on active care and maintenance for rapid restart..
- The Wonawinta silver project was previously the largest primary producer of silver in Australia, and Manuka expects this to again be the case once production restarts.
- While the substantially higher gold prices have been securing headlines over the past six months, it is worth noting that the silver price is also trading at an all time high which makes restarting the project very attractive (the all time high for silver is against the Australian dollar, currently silver is around AU$54/oz silver).
- Manuka released its maiden silver reserve in October 2024 making it the only production ready silver reserve on a project based in Australia.
- Elevated gold and silver prices should materially benefit Manuka Resources, resulting in strong profitability and cash flows once its projects move into production.
Key Projects
Mt Boppy Gold Project
The Mt Boppy gold project comprises three mining leases, four gold leases and one exploration license, spanning an area of more than 210 sq km in the prolific Cobar Basin in New South Wales, Australia. The project was acquired by Manuka in 2019 and has a current mineral resource of 4.3 Mt at 1.19 g/t gold. This includes a combination of oxidized and transitional/fresh mineralization in the ground, as well as mineralized rock dumps and tailings.
Historically, Manuka Resources has processed its stockpiles and gold mineralized waste products through its Wonawinta processing plant. However, inefficiencies associated with trucking and processing ore at the distant Wonawinta plant has led the company to revise its strategy. It is now looking to construct a processing plant at Mt Boppy so that ore from the mine can be processed on-site. Mt Boppy has excellent infrastructure including a 48-person mine camp and is fully permitted for the proposed processing plant and on-site production.
The updated mineral resource comprises 4.28 Mt at 1.19 g/t gold for 163 koz of contained gold, of which 82 percent is in the measured and indicated categories.
An on-site plant will offer significant cost savings and improve the project economics.
Manuka Resources anticipates Mt Boppy to deliver total EBITDA of >AU$90 million and cash flow of >AU$80 million over a five-year mine life.
Wonawinta Silver Mine Project
The Wonawinta plant
The Wonawinta project is fully permitted with all the necessary infrastructure, including an 850,000 to 1 million tpa processing plant. The plant has been used for processing ore from Mt Boppy. The Wonawinta silver mine is currently under care and maintenance. The company is considering the possibility of resuming operations at Wonawinta, leveraging the improved silver price environment. Manuka has released a maiden ore reserve (under its ownership):
- Ore Reserve of 4.8 Mt at 53.8 g/t silver containing 8.4 Moz of silver comprising:
- Proved Ore Reserves of 0.8 Mt at 50.8 g/t silver; and
- Probable Ore Reserves of 4.1 Mt at 54.3 g/t Ag.
The maiden silver ore reserve and the preparation of an implementation plan for Wonawinta support the potential restart of silver mining and processing operations in the near
future. The company is reviewing its silver restart plans in light of the current price increases and expects to announce a decision before the end of May 2025.
Taranaki VTM Project
The Taranaki VTM project is located within New Zealand's exclusive economic zone, approximately 22 to 36 kilometres offshore, outside the 12 nautical mile boundary from the coastline. The project boasts a JORC resource of 3.2 billion tons at 10.17 percent iron oxide, 1.03 percent titanium dioxide and 0.05 percent vanadium oxide. It holds a mining license allowing initial extraction of 50 million tons annually, resulting in 5 million tons of VTM concentrate per year for 20 years (concentrate grade of 56 to 57 percent iron, 8.5 percent titanium dioxide and 0.5 percent vanadium pentoxide). At this extraction rate, the JORC resource provides approximately 60 years of potential mining inventory.
The project was included in the New Zealand government's Schedule 2 of the Fast Track Approvals Act 2024. The next step for Manuka was to complete pre-feasibility study (“PFS”) on the project. This was released to the market on 26 March 2025 and presents an extremely robust economic outlook for the project as can be seen below.
Management Team
Dennis Karp – Executive Chairman
Dennis Karp is a former commodities trader with nearly four decades of corporate experience. He started his career in 1983 and worked in HSBC until 1997 before moving to Tennant, one of Australia’s largest physical commodities trading companies with operations in Asia and Europe. He was a principal shareholder of Tennant Metals until 2010 and a managing director until December 2014. He founded ResCap in December 2014. Since then, he has participated in diverse resource projects and investment opportunities across base metals and bulk commodities. He holds a Bachelor of Commerce from the University of Cape Town.
Alan Eggers – Executive Director
Alan Eggers has over 40 years of experience in the mining sector. He is a geologist and was the founder of Summit Resources, which became an ASX top 200 company and was acquired by Paladin Energy in 2007 for AU$1.2 billion. Throughout his career, he has held director positions at numerous companies. He holds a Bachelor of Science, Honours, and Master of Science degrees from Victoria University of Wellington. He is recognized as a fellow of the Society of Economic Geologists and holds memberships in AusIMM and the Australian Institute of Geoscientists.
John Seton – Non-executive Director
John Seton is a lawyer with extensive experience in the mineral resources sector. He has served as director in several ASX and NZX listed companies. He holds a Bachelor of Laws from Victoria University, Wellington, and a Master of Law (Honours) from the University of Auckland and is a chartered fellow of the New Zealand Institute of Directors.
Haydn Lynch – Chief Operating Officer
Haydn Lynch has over 25 years of experience in M&A, capital markets and private equity. He has been involved in executing several domestic and cross-border transactions in various sectors including metals and mining, and industrials. He has held leadership roles in global investment banks, including Bankers Trust Australia, Investec Bank, RBC Capital Markets and Southern Cross Equities. He has undergraduate degrees in mechanical engineering and economics from the University of Queensland and a Master in Commerce from the University of New South Wales.
Dieter Engelhardt – Chief Metallurgist and General Manager
Dieter Engelhardt has over 30 years of experience in the mining industry including roles as senior metallurgist at Telfer Gold Mine and Northparkes Mines, resident manager at McKinnons Gold Mine, and manager of ore processing at CSA Mine. Engelhardt was employed by Newcrest Mining (now Newmont) in various roles, including as manager of ore processing and principal metallurgist.
Phil Bentley – Chief Geologist
Phil Bentley has over 40 years of experience in the mining industry across New Zealand, South Africa, and Australia, holding senior geological roles as well as senior management and director positions. He has worked as a chief geologist at Randgold Resources and Randgold & Exploration, Global Head of Exploration at Trafigura Mining Services, and Principal Geologist Africa at CSA Global South Africa. He is a Qualified person under NI 43-101 (Canada) and JORC (Australia) and is a Fellow of the South African Geological Society. He holds a Bachelor of Science (Honours) in Geology at Victoria University of Wellington. He also has a Masters of Science in Economic Geology at Victoria University of Wellington and a Master’s of Science in Mineral Exploration from Rhodes University, Grahamstown South Africa.
Keep reading...Show less
Near-term production from both its silver and gold projects located in the Cobar Basin, Central West, New South Wales
16 April
Fast Track Application for the Taranaki VTM Project Lodged
02 April
EIA Confirms Taranaki VTM Project of National Significance
31 January
December 2024 Quarter Activities and Cash Flow Reports
Manuka Resources Limited (MKR:AU) has announced December 2024 Quarter Activities and Cash Flow Reports
28 November 2024
Manuka Strengthens Balance Sheet with Additional $1 Million
Manuka Resources Limited (MKR:AU) has announced Manuka Strengthens Balance Sheet with Additional $1 Million
7h
Analyst Spotlight: Castle Minerals' Path to Significant Gold Discovery in Ghana
A recent research report by Terra Studio highlights Castle Minerals’ (ASX:CDT) investment value proposition as a gold exploration company with significant potential in Ghana's gold-rich region. With an enterprise value of just AU$3.4 million, Terra Studio considers Castle Minerals significantly undervalued given its promising drill results, strong government support for its graphite project, and potential for continued discoveries amid record-high gold prices.
The Terra Studio report from April 14, 2025, outlines several compelling reasons why Castle Minerals presents an attractive investment opportunity.
Key Highlights from the Report:
Strategic Location and Recent Discoveries
Castle's projects are located in northern Ghana, which hosts several major gold deposits including Cardinal Resources' 5.1 Moz Namdini deposit. The company's Kpali gold project has confirmed robust mineralization with impressive drill results including 12 m at 8.29 grams per ton (g/t) gold and 9 m at 4.81 g/t gold, while the Kandia gold project has demonstrated promising continuity with results like 7 m at 3.36 g/t gold.
Geological Advantage
The report emphasizes that Castle's Kpali area sits at the convergence of two major fertile greenstone belts and three regional-scale structures that host multi-million-ounce deposits in the region – a geological setting similar to higher-valued projects in West Africa.
Strong Leadership and Financial Position
The company is led by Stephen Stone, who previously grew the nearby Black Volta gold project to 2.80 million ounces of mineral resources. Following a recent AU$3 million placement, Castle Minerals is well-funded to continue its exploration activities.
Castle also owns the Kambale graphite project, one of the highest-grade graphite projects in Africa with a mineral resource of 22.4 million tonnes at 8.6 percent total graphitic carbon. The Ghanaian government has expressed strong support, with the country's sovereign fund signing a term sheet to invest approximately US$2 million to advance the project.
For the full analyst report, click here.
This content is intended only for persons who reside or access the website in jurisdictions with securities and other applicable laws which permit the distribution and consumption of this content and whose local law recognizes the scope and effect of this Disclaimer, its limitation of liability, and the legal effect of its exclusive jurisdiction and governing law provisions [link to Governing Law section of the Disclaimer page].
Any investment information contained on this website, including third party research reports, are provided strictly for informational purposes, are general in nature and not tailored for the specific needs of any person, and are not a solicitation or recommendation to purchase or sell a security or intended to provide investment advice. Readers are cautioned to seek the advice of a registered investment advisor regarding the appropriateness of investing in any securities or investment strategies mentioned on this website.
Keep reading...Show less
17 April
US Capital Gains Tax Guide for Gold and Silver Investors
As gold and silver continue to prove their worth as sound investments, market participants should know how precious metals investments are taxed in the US.
While the majority of gold and silver investing comes with a certain degree of taxation, there are different levels of tax based on how market participants decide to invest in these precious metals, how long the investments are held for and the investors individual tax bracket.
Read on for a breakdown of the taxes associated with investing in gold and silver bullion, ETFs and stocks, as well as the forms involved with reporting precious metals investments.
In this article
How are physical gold and silver taxed?
Gold and silver bullion, coins and bars are seen as collectibles by the Internal Revenue Service (IRS) in the US. Thus, physical gold and silver, no matter the form, are subject to a higher rate of capital gains tax when they are sold. The same is true for fellow precious metals platinum and palladium.
While long-term capital gains would typically carry a top bracket of 20 percent, collectibles can be taxed at a higher 28 percent.
The total an investor will owe in capital gains tax when selling physical gold and silver is based both on their income bracket and the length of time they held the asset.
The long-term capital gains tax on physical gold and silver is equal to an investor’s marginal tax rate, up to a maximum of 28 percent due to their status as a collectible, meaning those in higher tax brackets still only have to pay 28 percent on long-term gains from physical precious metals sales.
It is worth noting that the 28 percent maximum is only for long-term capital gains, which applies to metals that an investor has held for more than one year. Short-term capital gains on precious metals held for less than one year are taxed at ordinary income rates.
For example, a person in the highest tax bracket purchased 100 ounces of physical gold at US$1,800 per ounce and two years later sold their holdings for US$2,000 per ounce. While they are in the 37 percent tax bracket, they would pay 28 percent tax on the capital gains made from these sales. As they earned US$20,000 in capital gains, that would translate to US$5,600 in income tax.
However, if the investor sold the gold at the same gain just 11 months after they purchased it, it would count as short-term capital gains, and the investor would be taxed at 37 percent and owe US$7,400.
Investors who are in one of the tax brackets below 28 percent are taxed at the standard rate of their bracket when selling their solid gold and silver assets, whether they are held short- or long-term.
Similarly to other investments, precious metals sold at a loss can be used to offset capital gains.
How are gold and silver ETFs taxed?
Like all other exchange-traded funds (ETFs), gold ETFs and silver ETFs act in the same manner as individual stocks, meaning that investing in these ETFs is similar to trading a stock on an exchange. There are two main types of gold and silver ETFs: those that track the prices of those metals and those that track gold or silver stocks.
ETFs that follow metals prices provide exposure to either physical gold or silver, or gold or silver futures contracts. It is important to keep in mind that investing in these ETF platforms does not allow investors to own any physical gold or silver — in general, even an investment in an ETF that tracks physical gold or silver cannot be redeemed for the tangible metal.
ETFs that invest in gold or silver companies provide exposure to gold- and silver-mining stocks, as well as gold- or silver-streaming stocks.
In terms of taxation, capital gain taxes from selling gold and silver ETFs is determined by the ETF's holdings, the investors tax bracket and how long they held the asset for.
Funds will often supply investors with tax forms that they can use to fill out their income tax. The webpage for a fund should have a document describing how income tax is handled for that fund, which is worth reading before investing in it.
Long-term capital gains from selling shares of gold and silver ETFs are subject to a 28 percent maximum federal income tax rate if they hold physical precious metals and 20 percent if they hold stocks. While long-term capital gains would typically be capped at 20 percent maximum rate. This is because the holdings are considered collectibles, as described in the section above. Short-term gains made from selling gold or silver ETFs are subject to a maximum federal rate of 37 percent.
Additionally, these gains could get slapped with a 3.8 percent net investment income tax for high net-worth investors, and a state income tax may also apply.
Futures-based commodity ETFs can come with their own set of rules that you can learn about here. Briefly, they are often taxed in a 60/40 hybrid, with 60 percent treated as long-term gains and 40 percent treated as short-term gains. Additionally, this is calculated at the end of each tax year, whether a sale is made or not.
ETFs that hold stocks are taxed in the same way as traditional securities, which you can read more about below.
Kevin McElligott, managing director for Franco-Nevada Australia, part of gold-focused royalty and streaming company Franco-Nevada (TSX:FNV,NYSE:FNV), has warned that these taxes, alongside management fees, can become bothersome. “ETFs actually cost you money in annual management fees,” he told the Investing News Network via email.
How are gold and silver stocks taxed?
In terms of tax on gold and silver stocks, long-term gains from selling are subject to the standard 20 percent maximum federal rate, while short-term gains will face a maximum federal rate of 37 percent. For investors in higher income brackets, there is the potential for gold and silver stock investments to also be hit with the 3.8 percent net investment income tax as well as state income tax.
Unlike physical precious metals and ETFs that hold them, precious metals stocks are not classified as collectibles, which is why the long-term capital gains tax is capped at 20 percent instead of 28 percent.
Stocks sold at a loss are important as well as they can be used to offset capital gains when filing income tax.
How to report taxes on physical gold and silver investments
Market participants who sell precious metals in the US for a profit are required to report that profit on their income tax return, regardless of whether or not the dealer has any reporting obligation.
When selling gold and silver investments in the US, there are two different sets of reporting guidelines — one applies to the dealer through which a person sells and the other applies to the investor who is selling the asset.
It is important to note that taxes on the sale of gold and silver will not be due the moment that the sale is made, and the tax bill for all of these sales is due at the same time as a standard income tax bill.
For investors selling precious metals, capital gains or losses need to be reported on Schedule D of Form 1040 when making a tax return.
Investors will first need to detail their precious metals transactions on Form 8949, including the length of time the investments were held. This form must be filed alongside Schedule D. Investors then use this information alongside the 28% Rate Gain Worksheet included in the Schedule D instructions.
Depending on the type of metal being sold, Form 1099-B may have to be submitted to the IRS by the broker when the sale closes, as such transactions are considered income. As for when a broker will need to file Form 1099-B, there are specific rules that determine which sales of precious metals require the dealer to file this form that apply to transactions over a 24 hours period.
For gold sales, reportable items include specific gold coins, including the 1 ounce Canadian Gold Maple Leaf and Gold Kruggerand, and gold bars and rounds of at least 0.995 fineness. As for quantity, only sales of more than 25 gold coins and or more than 1 kilogram in gold bars and rounds will require the form.
Sales of 0.999 fine silver bars and rounds totaling over 1,000 ounces qualify. For silver coins, US coins with above 90 percent silver are reportable, but Silver American Eagle coins are not. Sales of silver coins exceeding US$1,000 will require a form.
When it comes to selling gold and silver overseas, market participants must follow the laws as they apply to the sale of gold and silver investments in that particular country.
The information in this article does not constitute tax advice, and investors should work with a tax professional or program to help them make sure everything is reported accurately.
This is an updated version of an article first published by the Investing News Network in 2019.
Don’t forget to follow us @INN_Resource for real-time updates!
Securities Disclosure: I, Lauren Kelly, currently hold no direct investment interest in any company mentioned in this article.
Editorial Disclosure: The Investing News Network does not guarantee the accuracy or thoroughness of the information reported in the interviews it conducts. The opinions expressed in these interviews do not reflect the opinions of the Investing News Network and do not constitute investment advice. All readers are encouraged to perform their own due diligence.
Keep reading...Show less
17 April
Gold Price Hits New Record, Breaking US$3,300 for First Time
The gold price reached yet another record high on Wednesday (April 16), breaking US$3,300 per ounce.
The precious metal has gained significant momentum since the beginning of the year. In trading on Wednesday it surged past the US$3,200 mark, climbing as high as US$3,354.10 per ounce. The price retreated below the US$3,300 mark on Thursday (April 17).
The rise comes after statements from US Federal Reserve Chairman Jerome Powell made at the Economic Club of Chicago on Wednesday. In his remarks, he said that he expects US President Donald Trump's tariff policy to negatively impact US economic growth and further fuel inflation.
In addition to gold climbing to record highs, the US dollar sank to its lowest point in three years with the DXY dollar index falling to 99.3 points on Thursday.
Gold price chart, April 10, 2025, to April 17, 2025.
Gold price chart via the Investing News Network.
Gold prices have soared in recent weeks amidst the chaos caused by Donald Trump's tariff announcements on April 2.
Those measures included a 10 percent tariff on all but a handful of countries, including Canada and Mexico, with more severe reciprocal tariffs to come into effect this week. However, on April 9, Trump announced he would pause the additional tariffs for 90 days, saying more than 70 countries had contacted him to make deals.
Trump may have also been feeling pressure from economic advisors as a surge in treasury yields signaled a potential economic crisis brewing in the US bond market. Normally a safe haven during market volatility, the bond market saw a significant selloff this week as US tariffs and worries about the US economy's stability spooked traders.
Although the pause gave most countries some breathing room, tariffs against China were left on the table. After much back and forth, US tariffs levied against China have now increased to 145 percent.
The net effect of Trump's actions has been political and financial turmoil, sparking selloffs in major stock markets and pushing prices for safe-haven assets like gold to fresh records.
Additionally, China, Japan and South Korea agreed on March 30 to seek deeper free trade ties in response to the threat of tariffs from the US government. The deal marks a significant move by the three countries following decades of US diplomacy to maintain close relationships with Japan and South Korea.
Don't forget to follow us @INN_Resource for real-time updates!
Securities Disclosure: I, Dean Belder, hold no direct investment interest in any company mentioned in this article.
Keep reading...Show less
17 April
What Was the Highest Price for Gold?
Gold has long been considered a store of wealth, and the price of gold often makes its biggest gains during turbulent times as investors look for cover in this safe-haven asset.
The 21st century has so far been heavily marked by episodes of economic and sociopolitical upheaval. Uncertainty has pushed the precious metal to record highs as market participants seek its perceived security. And each time the gold price rises, there are calls for even higher record-breaking levels.
Gold market gurus from Lynette Zang to Chris Blasi to Jordan Roy-Byrne have shared eye-popping predictions on the gold price that would intrigue any investor — gold bug or not.
Some have posited that the gold price may rise as high as US$4,000 or US$5,000 per ounce, and there are even those who believe that US$10,000 gold or even US$40,000 gold could become a reality.
These impressive price predictions have investors wondering, what is gold's all-time high (ATH)?
In the past year, gold has reached a new all-time high dozens of times. Find out what has driven it to these levels, plus how the gold price has moved historically and what has driven its performance in recent years.
In this article
How is gold traded?
Before discovering what the highest gold price ever was, it’s worth looking at how the precious metal is traded. Knowing the mechanics behind gold's historical moves can help illuminate why and how its price changes.
Gold bullion is traded in dollars and cents per ounce, with activity taking place worldwide at all hours, resulting in a live price for the metal. Investors trade gold in major commodities markets such as New York, London, Tokyo and Hong Kong. London is seen as the center of physical precious metals trading, including for silver. The COMEX division of the New York Mercantile Exchange is home to most paper trading.
There are many popular ways to invest in gold. The first is through purchasing gold bullion products such as bullion bars, bullion coins and rounds. Physical gold is sold on the spot market, meaning that buyers pay a specific price per ounce for the metal and then have it delivered. In some parts of the world, such as India, buying gold in the form of jewelry is the largest and most traditional route to investing in gold.
Another path to gold investment is paper trading, which is done through the gold futures market. Participants enter into gold futures contracts for the delivery of gold in the future at an agreed-upon price.
In such contracts, two positions can be taken: a long position under which delivery of the metal is accepted or a short position to provide delivery of the metal. Paper trading as a means to invest in gold can provide investors with the flexibility to liquidate assets that aren’t available to those who possess physical gold bullion.
One significant long-term advantage of trading in the paper market is that investors can benefit from gold’s safe-haven status without needing to store it. Furthermore, gold futures trading can offer more financial leverage in that it requires less capital than trading in the physical market.
Interestingly, investors can also purchase physical gold via the futures market, but the process is complicated and lengthy and comes with a large investment and additional costs.
Aside from those options, market participants can invest in gold through exchange-traded funds (ETFs). Investing in a gold ETF is similar to trading a gold stock on an exchange, and there are numerous gold ETF options to choose from. For instance, some ETFs focus solely on physical gold bullion, while others focus on gold futures contracts. Other gold ETFs center on gold-mining stocks or follow the gold spot price.
It is important to understand that you will not own any physical gold when investing in an ETF — in general, even a gold ETF that tracks physical gold cannot be redeemed for tangible metal.
With regards to the performance of gold versus trading stocks, gold has an interesting relationship with the stock market. The two often move in sync during “risk-on periods” when investors are bullish. On the flip side, they tend to become inversely correlated in times of volatility. There are a variety of options for investing in stocks, including gold mining stocks on the TSX and ASX, gold juniors, precious metals royalty companies and gold stocks that pay dividends.
According to the World Gold Council, gold's ability to decouple from the stock market during periods of stress makes it “unique amongst most hedges in the marketplace.” It is often during these times that gold outperforms the stock market. For that reason, it is often used as a portfolio diversifier to hedge against uncertainty.
What was the highest gold price ever?
Gold price chart, December 31, 2024, to April 14, 2025.
Chart via the Investing News Network.
The gold price peaked at US$3,354.10 per ounce, its all-time high, during trading on April 16, 2025.
What drove it to set this new ATH? Gold set its latest high price of 2025 on April 16 as markets and the US dollar fell and gold purchasing in China continued to ramp up significantly in response to US tariffs on the country.
The gold price has set a string of new highs this month alone amid high market volatility as markets react to the latest tariff decisions from US President Donald Trump and the escalating trade war between the US and China. As of April 11, Trump has now raised US tariffs on Chinese imports to 145 percent and China has raised its tariffs on US products to 125 percent.
Two days earlier, Trump paused his higher "Liberation Day" tariffs on any countries that did not reciprocate in response. However, the blanket 10 percent tariffs still stand, as do the 25 percent tariffs on the automotive sector.
Why is the gold price setting new highs in 2025?
This string of record-breaking highs this year are caused by several factors.
Increased economic and geopolitical turmoil caused by the new Trump administration has been a tailwind for gold this year, as well as a weakening US dollar, sticky inflation in the country and increased safe haven gold demand.
Since coming into office in late January, Trump has threatened or enacted tariffs on many countries, including currently paused blanket tariffs on long-time US allies Canada and Mexico and tariffs on the European Union. Trump has also implemented 25 percent tariffs on all steel and aluminum imports.
As for the effect of these wide-spread tariffs raising prices for the American populace, Trump has reiterated his sentiment that the US may need to go through a period of economic pain to enter a new "golden age" of economic prosperity. Elon Musk's call to audit the gold holdings in Fort Knox has also brought attention to the yellow metal.
What factors have driven the gold price in the last five years?
Five year gold price chart, April 13, 2020, to April 14, 2025.
Chart via the Investing News Network.
Despite these recent runs, gold has seen its share of both peaks and troughs over the last decade. After remaining rangebound between US$1,100 and US$1,300 from 2014 to early 2019, gold pushed above US$1,500 in the second half of 2019 on a softer US dollar, rising geopolitical issues and a slowdown in economic growth.
Gold’s first breach of the significant US$2,000 price level in mid-2020 was due in large part to economic uncertainty caused by the COVID-19 pandemic. To break through that barrier and reach what was then a record high, the yellow metal added more than US$500, or 32 percent, to its value in the first eight months of 2020.
The gold price surpassed that level again in early 2022 as Russia's invasion of Ukraine collided with rising inflation around the world, increasing the allure of safe-haven assets and pulling the yellow metal up to a price of US$2,074.60 on March 8, 2022. However, it fell throughout the rest of 2022, dropping below US$1,650 in October.
Although it didn't quite reach the level of volatility as the previous year, the gold price experienced drastic price changes in 2023 on the back of banking instability, high interest rates and the breakout of war in the Middle East.
After central bank buying pushed the gold price up to the US$1,950.17 mark by the end of January, the US Federal Reserve’s 0.25 percent rate hike on February 1 sparked a retreat as the dollar and Treasury yields saw gains. The precious metal went on to fall to its lowest price level of the year at US$1,809.87 on February 23.
The banking crisis that hit the US in early March caused a domino effect through the global financial system and led to the mid-March collapse of Credit Suisse, Switzerland’s second-largest bank. The gold price jumped to US$1,989.13 by March 15. The continued fallout in the global banking system throughout the second quarter of the year allowed gold to break above US$2,000 on April 3, and go on to flirt with a near-record high of US$2,049.92 on May 3.
Those gains were tempered by the Fed’s ongoing rate hikes and improvements in the banking sector, resulting in a downward trend in the gold price throughout the remainder of the second quarter and throughout Q3. By October 4, gold had fallen to a low of US$1,820.01 and analysts expected the precious metal to drop below US$1,800.
That was before the October 7 attacks by Hamas on Israel ignited legitimate fears of a much larger conflict erupting in the Middle East. Reacting to those fears, and to rising expectations that the Fed would begin to reverse course on interest rates, gold broke through the important psychological level of US$2,000 and closed at US$2,007.08 on October 27. As the Israel-Hamas fighting intensified, gold reached a then new high of US$2,152.30 during intraday trading on December 3.
That robust momentum in the spot gold price has continued into 2024, chasing new highs on fears of a looming US recession, the promise of Fed rate cuts on the horizon, the worsening conflict in the Middle East and the tumultuous US presidential election year. By mid-March, gold was pushing up against the US$2,200 level.
That record-setting momentum continued into the second quarter of 2024 when gold broke through US$2,400 in mid-April on strong central bank buying, sovereign debt concerns in China and investors expecting the Fed to start cutting interest rates. The precious metal went on to hit US$2,450.05 on May 20.
Throughout the summer, the hits have just kept on coming.
The global macro environment is highly bullish for gold in the lead up to the US election. Following the failed assassination attempt on Trump and a statement about coming interest rate cuts by Fed Chair Jerome Powell, the gold spot price hit a new all-time high on July 16 at US$2,469.30. One week later, news that President Joe Biden would not seek re-election and would instead pass the baton to Vice President Kamala Harris eased some of the tension in the stock markets and strengthened the US dollar. This also pushed the price of gold down to US$2,387.99 on July 22.
However, the bullish factors supporting gold over the past year remain in play, and the spot price for gold went on to breach US$2,500 on August 2 on a less than stellar US jobs report; it closed just above the US$2,440 level. A few weeks later, gold pushed past US$2,500 once again on August 16, closing above that level for the first time ever after the US Department of Commerce released data showing a fifth consecutive monthly decrease in a row for homebuilding.
The news that the Chinese government issued new gold import quotas to banks in the country following a two month pause also helped fuel the gold price rally. Central bank gold buying has been a significant tailwind for the gold price this year, and China's central bank has been one of the strongest buyers.
Market watchers expected the Fed to cut interest rates by a quarter point at their September meeting, but news on September 12 that the regulators were still deciding between the expected cut or a larger half-point cut led gold prices on a rally that carried through into the next day, bringing gold prices near US$2,600.
At the September 18 Fed meeting, the committee ultimately made the decision to cut rates by half a point, news that sent gold even higher. By Friday, September 20, it moved above US$2,600 and held above US$2,620.
In October, gold breached the US$2,700 level and continued to set new highs on a variety of factors, including further rate cuts and economic data anticipation, the escalating conflict in the Middle East between Israel and Hezbollah, and economic stimulus in China — not to mention the very close race between the US presidential candidates.
While the gold price fell following Trump's win in early November and largely held under US$2,700 through the end of the year, it began trending upwards in 2025 to the new all-time high discussed earlier in the article.
Gold has seen upward momentum in the last year on a variety of factors.
In 2025, the gold price was on the rise early in the new year as Trump and his team began to talk seriously about a wide-ranging set of tariffs on several countries in the run up and following his inauguration on January 20.
On January 29, the Bank of Canada shaved 25 basis points off its policy interest rate, marking its sixth consecutive decrease, and announced plans to end quantitative tightening.
On the same day, the Fed opted to leave interest rates unchanged. The following day, Trump said he would very likely be placing 25 percent tariffs on Mexico and Canada as of February 1, alongside tariffs on the EU and China.
Gold price set new highs in all currencies alongside a weakening US dollar, the Fed leaving interest rates unchanged, a rush to safe haven assets and the looming threat of Trump's tariffs on February 1.
Additionally, new US economic data showed inflation-adjusted gross domestic product in the country increased an annualized 2.3 percent in the fourth quarter of 2024 after rising 3.1 percent in the third quarter.
Some other factors supporting gold to new highs include Trump threatening to annex Greenland, Canada and the Panama Canal, Trump's proposed resettlement of Palestinians out of the Gaza Strip to develop it into "the Riviera of the Middle East," a suggestion that has been condemned globally, and him appearing to side with Putin against Ukrainian President Volodymyr Zelenskyy regarding Russia's invasion of Ukraine.
What's next for the gold price?
What's next for the gold price is never an easy call to make. There are many factors that affect the gold price, but some of the most prevalent long-term drivers include economic expansion, market risk, opportunity cost and momentum.
Economic expansion is one of the primary gold price contributors as it facilitates demand growth in several categories, including jewelry, technology and investment. As the World Gold Council explains, “This is particularly true in developing economies where gold is often used as a luxury item and a means to preserve wealth.”
Market risk is also a prime catalyst for gold values as investors view the precious metal as the “ultimate safe haven,” and a hedge against currency depreciation, inflation and other systemic risks.
Going forward, in addition to the Fed, inflation and geopolitical events, experts will be looking for cues from factors like supply and demand. In terms of supply, the world’s five top gold producers are China, Australia, Russia, Canada and the US. The consensus in the gold market is that major miners have not spent enough on gold exploration in recent years. Gold mine production has fallen from around 3,200 to 3,300 metric tons each year between 2018 and 2020 to around 3,000 to 3,100 metric tons each year between 2021 and 2023.
On the demand side, China and India are the biggest buyers of physical gold, and are in a perpetual fight for the title of world’s largest gold consumer. That said, it's worth noting that the last few years have brought a big rebound in central bank gold buying, which dropped to a record low in 2020, but reached a 55 year high of 1,136 metric tons in 2022.
The World Gold Council has reported that central bank gold purchases in 2023 came to 1,037 metric tons, marking the second year in a row above 1,000 MT. In the first half of 2024, the organization says gold purchases from central banks reached a record 483 metric tons.
“I expect the Fed’s rate-cutting cycle to be good for gold, but central bank buying has been and remains a major factor," Lobo Tiggre, CEO of IndependentSpeculator.com, said in an email to the Investing News Network (INN) at the beginning of Q4.
David Barrett, CEO of the UK division of global brokerage firm EBC Financial Group, is also keeping an eye on central bank purchases of gold.
“I still see the global central bank buying as the main driver — as it has been over the last 15 years,” he said in an email to INN. "This demand removes supply from the market. They are the ultimate buy-and-hold participants and they have been buying massive amounts."
In addition to central bank moves, analysts are also watching for escalating tensions in the Middle East, a weakening US dollar, declining bond yields, and further interest rate cuts as factors that could push gold higher as investors look to secure their portfolios.
“When it comes to outside factors that affect the market, it’s just tailwind after tailwind after tailwind. So I don’t really see the trend changing,” Coffin said.
Randy Smallwood of Wheaton Precious Metals (TSX:WPM,NYSE:WPM) told INN in March 2025 that gold is seeing support from many factors, including central bank buying, nervousness around the US dollar and stronger institutional interest. According to Smallwood, he is seeing an influx of fund managers wanting to learn about precious metals.
Check out more of INN's interviews to find out what experts have said about the gold price during its 2025 bull run and where it could go next.
Should you beware of gold price manipulation?
As a final note on the price of gold and buying gold bullion, it’s important for investors to be aware that gold price manipulation is a hot topic in the industry.
In 2011, when gold hit what was then a record high, it dropped swiftly in just a few short years. This decline after three years of impressive gains led many in the gold sector to cry foul and point to manipulation.
Early in 2015, 10 banks were hit in a US probe on precious metals manipulation. Evidence provided by Deutsche Bank (NYSE:DB) showed “smoking gun” proof that UBS Group (NYSE:UBS), HSBC Holdings (NYSE:HSBC), the Bank of Nova Scotia (NYSE:BNS) and other firms were involved in rigging gold and silver rates in the market from 2007 to 2013.
Not long after, the long-running London gold fix was replaced by the LBMA gold price in a bid to increase gold price transparency. The twice-a-day process, operated by the ICE Benchmark Administration, still involves a variety of banks collaborating to set the gold price, but the system is now electronic.
Still, manipulation has by no means been eradicated, as a 2020 fine on JPMorgan (NYSE:JPM) shows. The next year, chat logs were released in a spoofing trial for two former precious metals traders from the Bank of America’s (NYSE:BAC) Merrill Lynch unit. They show a trader bragging about how easy it is to manipulate the gold price.
Gold market participants have consistently spoken out about manipulation. In mid-2020, Chris Marcus, founder of Arcadia Economics and author of the book “The Big Silver Short,” said that when gold fell back below the US$2,000 mark after hitting close to US$2,070, he saw similarities to what happened with the gold price in 2011.
Marcus has been following the gold and silver markets with a focus specifically on price manipulation for nearly a decade. His advice? “Trust your gut. I believe we’re witnessing the ultimate ’emperor’s really naked’ moment. This isn’t complex financial analysis. Sometimes I think of it as the greatest hypnotic thought experiment in history.”
Investor takeaway
While we have the answer to what the highest gold price ever is as of now, it remains to be seen how high gold can climb, and if the precious metal can reach as high as US$5,000, US$10,000 or even US$40,000.
Even so, many market participants believe gold is a must have in any investment profile, and there is little doubt investors will continue to see gold price action making headlines this year and beyond.
This is an updated version of an article first published by the Investing News Network in 2020.
Don’t forget to follow us @INN_Resource for real-time updates!
Securities Disclosure: I, Lauren Kelly, hold no direct investment interest in any company mentioned in this article.
Editorial Disclosure: The Investing News Network does not guarantee the accuracy or thoroughness of the information reported in the interviews it conducts. The opinions expressed in these interviews do not reflect the opinions of the Investing News Network and do not constitute investment advice. All readers are encouraged to perform their own due diligence.
Keep reading...Show less
17 April
Maritime Drills 5.5 gpt Gold over 29.8 metres, Including 73.0 gpt Gold over 1.5 metres at the Hammerdown Gold Project
Maritime Resources Corp. (TSXV: MAE) (OTC Pink: MRTMF) ("Maritime" or the "Company") is pleased to announce additional drill results from a grade control drill program at the Hammerdown Gold Project. Hammerdown is located in the Baie Verte mining district of Newfoundland and Labrador, near the towns of King's Point and Springdale.
Highlights:
- 5.5 grams per tonne ("gpt") gold ("Au") over 29.8 metres ("m"), including 73.0 gpt Au over 1.5 m in drill hole HDGC-25-177
- 16.9 gpt Au over 2.5 m in drill hole HDGC-25-181
- 7.7 gpt Au over 5.6 m in drill hole HDGC-25-160
- 67.1 gpt Au over 0.9 m in drill hole HDGC-25-188
- 14.8 gpt Au over 5.9 m and 17.0 gpt Au over 4.4 m in historical underground mining backfill in drill holes HDGC-25-189 and HDGC-25-175, respectively
- 151 historical underground mining backfill samples collected during the grade control program representing 274 linear meters of drilling returned an average grade of 3.3 gpt Au
Discussion of Results
The latest drill results cover the central portion of the proposed first year of open pit mining at Hammerdown. The grade control program continues to confirm the vein model and location of the historic underground workings while identifying additional mineralization between the high-grade veins, mine backfill material and remnant pillars. Notable assay results include drill hole HDGC-25-177 which intersected 5.5 gpt Au over 29.8 m, including 73.0 gpt Au over 1.5 m related to a group of mineralized quartz veins and altered mineralized quartz feldspar porphyry (QFP) within the unmined crown pillar. Drill hole HDGC-25-160 was drilled 20 m south of drill hole HDGC025-177 and returned 7.7 gpt Au over 5.6 m. Drill hole HDGC-25-188, located 20 m north of previously reported HDGC-25-118 (27.9 gpt Au over 1.0 m; see Maritime press release dated March 14, 2025), returned several high-grade gold intercepts. Highlights include 15.0 gpt Au over 1.4 m, 67.1 gpt Au over 0.9 m, and 14.6 gpt Au over 0.2 m.
The Hammerdown grade control program has identified high grade gold mineralization within the historic backfilled stopes. Drill hole HDGC-25-189 returned 14.8 gpt Au over 5.9 m and HDGC-25-175 returned 17.0 gpt Au over 4.4 m. These results enhance the confidence in the mineralization surrounding and inside the previously mined out stopes at Hammerdown. All backfill intervals drilled during the grade control program were sampled and resulted in the collection of 151 samples representing 274 linear metres of drilling with a weighted average of 3.3 gpt Au across a 1 m composite length. The backfill gold content is believed to be the result of a combination of the high historic mine cut-off grade as well as high grade loss on mining material remaining during the cut and fill mining process. The potential quantity and grade of the backfill material are conceptual in nature and there has been insufficient sampling to define a mineral resource. It is uncertain whether further sampling would result in the backfill material being delineated as a mineral resource.
Grade Control Drilling
The grade control drill program completed 8,460 metres of diamond drilling in 273 drill holes. The program was designed to intersect the sub vertical mineralization on a 10 m x 10 m staggered pattern to maximize future ore extraction while minimizing ore losses and dilution. Assay results will be released as they become available.
Figure 1. Plan View
Figure 2. Hammerdown Deposit Cross Section
Table 1. Significant Assay Results
Lengths reported relative to core access are estimated to be approximately 70% true thickness.
Table 2. Drill Hole Data
Qualified Person
Exploration activities at the Hammerdown Gold Project are administered on site by the Company's Exploration Manager, Larry Pilgrim, P.Geo. In accordance with National Instrument 43-101 Standards of Disclosure for Mineral Projects, Larry Pilgrim, P.Geo. Exploration Manager, is the Qualified Person for the Company and has prepared, validated and approved the technical and scientific content of this news release. The Company strictly adheres to CIM Best Practices Guidelines in conducting, documenting, and reporting its exploration activities on its exploration projects.
Analytical Procedures
All samples assayed and pertaining to this press release were completed by Eastern Analytical Limited (EAL) located at Springdale, Newfoundland and Labrador. EAL is an ISO 17025:2005 accredited laboratory for a defined scope of procedures. EAL has no relationship to Maritime Resources. Drill core samples are collected from NQ sized diamond drill core and sawn in half. The half core samples are delivered in sealed plastic bags to EAL by Maritime field crews where they are dried, crushed, and pulped. Samples are crushed to approximately 80% passing a minus 10 mesh and split using a riffle splitter to approximately 250 grams. A ring mill is used to pulverize the sample split to 95% passing a minus 150 mesh. Sample rejects are securely stored at the EAL site for future reference. A 30-gram representative sample is selected for analysis from the 250 grams after which EAL applies a fire assay fusion followed by acid digestion and analysis by atomic absorption for gold analysis. Other metals were analyzed by applying an acid digestion and 34 element ICP analysis finish. EAL runs a comprehensive QA/QC program of standards, duplicates and blanks within each sample stream.
About Maritime Resources Corp.
Maritime (TSXV: MAE) (OTC Pink: MRTMF) is a gold exploration and development company focused on advancing the Hammerdown Gold Project in the Baie Verte District of Newfoundland and Labrador, a top tier global mining jurisdiction. Maritime holds a 100% interest directly and subject to option agreements entitling it to earn 100% ownership in the Green Bay Property which includes the former Hammerdown gold mine and the Orion gold project. Maritime controls over 439 km2 of exploration land including the Green Bay, Whisker Valley, Gull Ridge and Point Rousse projects. Mineral processing assets owned by Maritime in the Baie Verte mining district include the Pine Cove mill and the Nugget Pond gold circuit.
On Behalf of the Board:
MARITIME RESOURCES CORP.
Garett Macdonald, MBA, P.Eng.
President and CEO
Phone: (416) 365-5321
info@maritimegold.com
www.maritimeresourcescorp.com
Twitter
Facebook
LinkedIn
YouTube
Caution Regarding Forward Looking Statements:
Certain of the statements made and information contained herein is "forward-looking information" within the meaning of National Instrument 51-102 - Continuous Disclosure Obligations. Forward-looking statements are often identified by terms such as "will", "may", "should", "anticipate", "expects", "intends", "indicates" "plans" and similar expressions. Forward-looking statements include, but are not limited to, statements concerning the Hammerdown mineralization, its' metallurgical response, precious metal extraction based on the ongoing metallurgical testwork, sampling programs, the grade control drilling program, location and grade of underground workings and backfill material, amongst other things, which involve known and unknown risks, uncertainties and other factors which may cause the actual results, performance or achievements of the Company, or industry results, to be materially different from any future results, performance or achievements expressed or implied by such forward-looking information. All forward-looking statements and forward-looking information are based on reasonable assumptions that have been made by the Company in good faith as at the date of such information. Such assumptions include, without limitation, the price of and anticipated costs of recovery of, base metal concentrates, gold and silver, the presence of and continuity of such minerals at modeled grades and values, the capacities of various machinery and equipment, the use of ore sorting technology will produce positive results, the availability of personnel, machinery and equipment at estimated prices, mineral recovery rates, and others. Forward-looking information is subject to a variety of risks and uncertainties which could cause actual events or results to differ from those reflected in the forward-looking information, including, without limitation, the ability of the Company to continue to be able to access the capital markets for the funding necessary to acquire, maintain and advance exploration properties or business opportunities; global financial conditions, including competition within the industry to acquire properties of merit or new business opportunities, and competition from other companies possessing greater technical and financial resources; difficulties in advancing towards a development decision and executing exploration programs on the Company's proposed schedules and within its cost estimates, whether due to weather conditions, availability or interruption of power supply, mechanical equipment performance problems, natural disasters or pandemics in the areas where it operates; increasingly stringent environmental regulations and other permitting restrictions or maintaining title or other factors related to exploring of its properties, such as the availability of essential supplies and services; factors beyond the capacity of the Company to anticipate and control, such as the marketability of mineral products produced from the Company's properties; uncertainty as to whether mineral resources will ever be converted into mineral reserves once economic considerations are applied; uncertainty as to whether inferred mineral resources will be converted to the measured and indicated categories through further drilling, or into mineral reserves, once economic considerations are applied; government regulations relating to health, safety and the environment, and the scale and scope of royalties and taxes on production; and the availability of experienced contractors and professional staff to perform work in a competitive environment and the resulting adverse impact on costs and performance and other risks and uncertainties, including those described in each MD&A of financial condition and results of operations. In addition, forward-looking information is based on various assumptions including, without limitation, assumptions associated with exploration results and costs and the availability of materials and skilled labour. Should one or more of these risks and uncertainties materialize, or should underlying assumptions prove incorrect, actual results may vary materially from those described in forward-looking statements. Accordingly, readers are advised not to place undue reliance on forward-looking information. Except as required under applicable securities legislation, Maritime undertakes no obligation to publicly update or revise forward-looking information, whether as a result of new information, future events or otherwise.
Neither the TSX Venture Exchange ("TSX-V") nor its Regulation Services Provider (as that term is defined in the policies of the TSX-V) accepts responsibility for the adequacy or accuracy of this release.
Keep reading...Show less
17 April
Advancing Monument Gold Project - Exploration Update
Verity Resources Limited (ASX:VRL) (Verity or the Company) is pleased to provide an update on exploration activities and strategy at its 100%-owned Monument Gold Project, located in the prolific Laverton gold district of Western Australia. The Company is advancing a pipeline of highly prospective gold targets across the Monument Project as part of its strategy to define a larger, higher-confidence gold resource base in one of Australia’s most active gold belts. The Monument Gold Project comprises 195km2 of highly prospective greenstone, along strike of Genesis Minerals (GMD:ASX) 3.3Moz Laverton Gold Project
.
Verity’s exploration strategy is underpinned by a dual focus on upgrading and expanding the existing Mineral
Resource Estimate while systematically testing high-potential greenfields targets. The Monument Project
provides an opportunity to delineate a district-scale gold system supported by:
• a strategic location within a Tier 1 gold district;
• 20km of prospective BIF strike, largely untested;
• proximity to major gold deposits and infrastructure; and
• a growing pipeline of advanced and early-stage targets.
Upcoming exploration programs will be funded through a combination of existing cash reserves and funds
raised via the renounceable Rights Issue (partially underwritten) scheduled to close on 2 May 2025 (Refer
Prospectus released to ASX on 4 April 2024 for further information).
Click here for the full ASX Release
This article includes content from Verity Resources Limited, licensed for the purpose of publishing on Investing News Australia. This article does not constitute financial product advice. It is your responsibility to perform proper due diligence before acting upon any information provided here. Please refer to our full disclaimer here.
Keep reading...Show less
Latest News
Sign up to get your FREE
Manuka Resources Investor Kit
and hear about exciting investment opportunities.
- Corporate info
- Insights
- Growth strategies
- Upcoming projects
GET YOUR FREE INVESTOR KIT
Latest Press Releases
Related News
TOP STOCKS
American Battery4.030.24
Aion Therapeutic0.10-0.01
Cybin Corp2.140.00
Investing News Network websites or approved third-party tools use cookies. Please refer to the cookie policy for collected data, privacy and GDPR compliance. By continuing to browse the site, you agree to our use of cookies.