Tartisan Nickel Corp. (CSE: TN) (OTCQX: TTSRF) (FSE: A2D) ("Tartisan" or the "Company") is pleased to announce that the Company has closed $1,797,000.00 in flow-through financing. This was comprised of 5,615,625 flow-through units of the Company at the price of $0.32 per unit for an aggregate subscription price of $1,798.000. Each unit comprises one flow-through share and one-half of one warrant. Each full warrant will entitle the holder thereof to acquire one additional common share of the Company exercisable at a price of $0.70 per warrant share for a period of 18 months from the Closing date. A finder's commission of 6% cash and 6% brokers warrants was paid to eligible agents including but not limited to GloRes Securities Limited. The units issued under the flow-through financing are subject to a hold period expiring four months and one day from the closing date.
- AustraliaNorth AmericaWorld
Investing News NetworkYour trusted source for investing success
- Lithium Outlook
- Oil and Gas Outlook
- Gold Outlook Report
- Uranium Outlook
- Rare Earths Outlook
- All Outlook Reports
- Top Generative AI Stocks
- Top EV Stocks
- Biggest AI Companies
- Biggest Blockchain Stocks
- Biggest Cryptocurrency-mining Stocks
- Biggest Cybersecurity Companies
- Biggest Robotics Companies
- Biggest Social Media Companies
- Biggest Technology ETFs
- Artificial Intellgience ETFs
- Robotics ETFs
- Canadian Cryptocurrency ETFs
- Artificial Intelligence Outlook
- EV Outlook
- Cleantech Outlook
- Crypto Outlook
- Tech Outlook
- All Market Outlook Reports
- Cannabis Weekly Round-Up
- Top Alzheimer's Treatment Stocks
- Top Biotech Stocks
- Top Plant-based Food Stocks
- Biggest Cannabis Stocks
- Biggest Pharma Stocks
- Longevity Stocks to Watch
- Psychedelics Stocks to Watch
- Top Cobalt Stocks
- Small Biotech ETFs to Watch
- Top Life Science ETFs
- Biggest Pharmaceutical ETFs
- Life Science Outlook
- Biotech Outlook
- Cannabis Outlook
- Pharma Outlook
- Psychedelics Outlook
- All Market Outlook Reports
Tartisan Nickel Corp. Completes High Resolution Airborne MAG Survey at Its Sill Lake Lead-Silver Property, Sault Ste. Marie, Ontario
Tartisan Nickel Corp. (CSE: TN) (OTCQX: TTSRF) (FSE: 8TA)("Tartisan", or the "Company") is pleased to report the airborne high resolution MAG Survey for the Company's 100% owned Sill Lake Lead-Silver Property has been completed. The high-res MAG survey covered approximately 297-line kms and used a 50-meter line spacing. The Sill Lake Project is in Van Koughnet Township, about 30 km north of Sault Ste. Marie, Ontario and consists of 57 single cell mining claims covering some 1260.77 hectares.
Tartisan CEO Mark Appleby, states, "We are pleased with the results of the high resolution airborne magnetic survey. The Sill Lake Deposit is associated with a northwest-southeast trending magnetic low feature in the survey data. Interpretation of the data suggests the structure which hosts the known Sill Lake Ag-Pb resource extends approximately 2 kilometers to the southeast and appears to be extending to the northeast offset by a series of interpreted faults. A two-kilometer extension is exciting and worthy of follow up and potentially a new exploration and drill program." (See Figures 1 and 2).
Lead-silver mineralization was originally discovered at Sill Lake in 1892, when a 30m adit was driven to a 17m internal shaft, with approximately 40m of lateral development to exploit a lead-silver vein. The Sill Lake Lead-Silver Property was later defined by explorers who conducted a 3750-meter diamond drill program along a defined steeply dipping mineralized trend some 850m in length, with mineralized widths varying between 1.5m and 4.5m. The Sill Lake Lead-Silver Property has seen two distinct periods of underground development and production and it is estimated that 7,000 tonnes of ore containing lead and silver were mined. In 2010, a historical NI 43-101 Technical Report gave a measured and indicated mineral resource of 112,751 tonnes at 134 g/t silver; 0.62% lead, and 0.21% zinc. The historical resource estimate used a silver cutoff grade of 60 g/t; but no cutoff grade for the base metal content was used.
An updated Technical NI 43-101 Report dated May 9, 2021, was prepared for Tartisan Nickel Corp. by SMX International Corporation (SMX) as an update to work previously done by Chemrox Technologies LLC from 2008-2010, an SMX predecessor company. The Sill Lake Lead-Silver Property NI 43-101 Technical Report is on SEDAR.
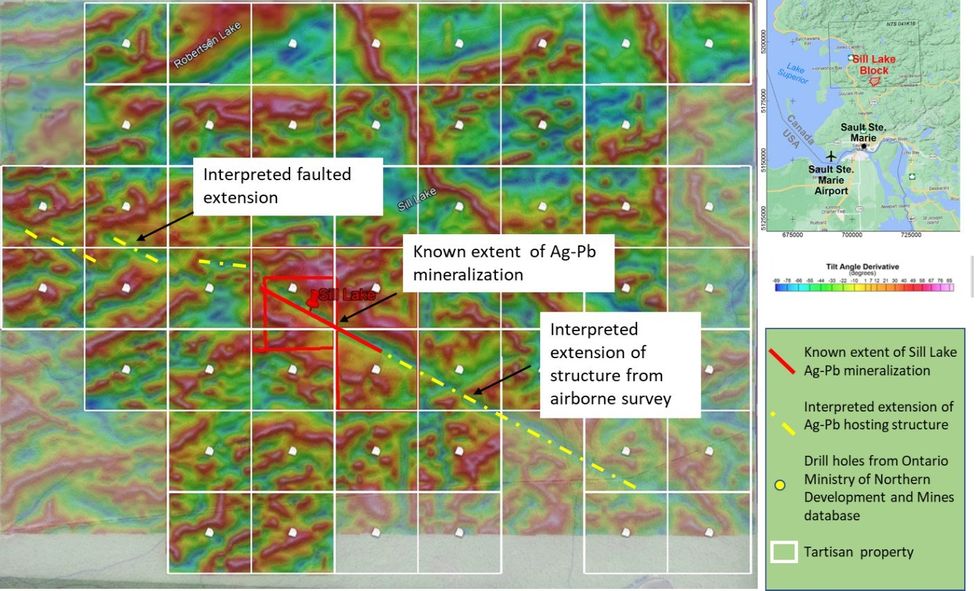
Fig 1: Tartisan property position over the Sill Lake area outlining extent of high resolution airborne magnetic survey. First Vertical Derivative and Tilt processing of the data highlights an extension of the structure hosting Sill Lake Ag-Pb for approximately 2 km to the southeast. Possible faulted extension is also interpreted to the northwest.
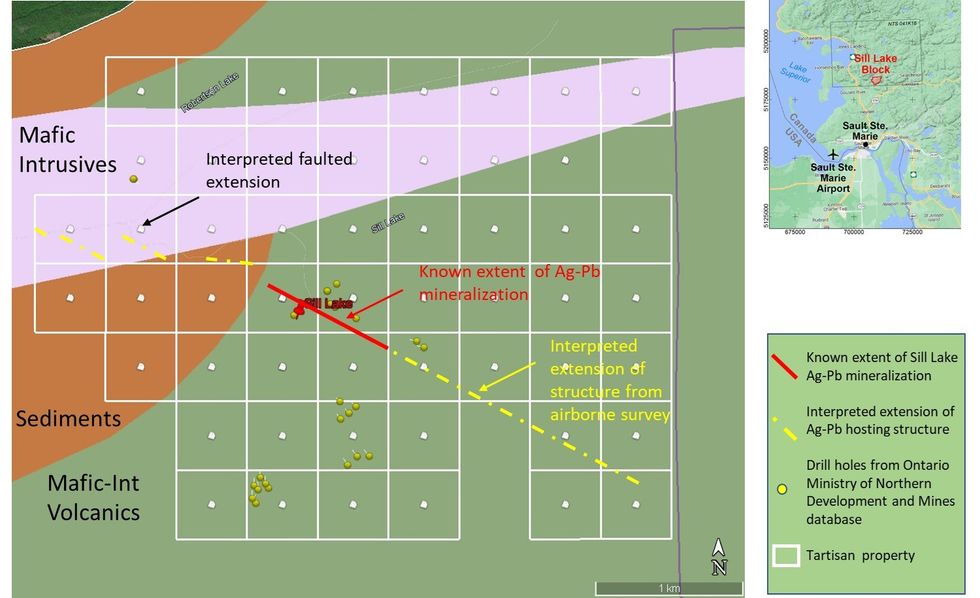
Fig 2: Tartisan property position illustrating general geology and location of historical diamond drill holes (source MNDM drill hole database).
Dean MacEachern P.Geo. is the Qualified Person under NI 43-101 and has read and approved the technical content of this News Release.
About Tartisan Nickel Corp.
Tartisan Nickel Corp. is a Canadian based battery metals and mine development company whose flagship asset is the Kenbridge Nickel Deposit located in northwestern Ontario. Tartisan also owns; the Sill Lake Lead- Silver Property in Sault St. Marie, Ontario, and the Don Pancho Manganese-Zinc-Lead-Silver Project in Peru. Tartisan Nickel Corp. owns equity stakes in: Class 1 Nickel & Technologies Corp. and Peruvian Metals Corp.
Tartisan Nickel Corp. common shares are listed on the Canadian Securities Exchange (CSE: TN) (OTCQX: TTSRF) (FSE: 8TA). There are currently 113,105,328 shares outstanding (126,147,159 fully diluted).
For further information, please contact Mark Appleby, President & CEO, and a Director of the Company, at 416-804-0280 (info@tartisannickel.com). Additional information about Tartisan can be found at the Company's website at www.tartisannickel.com or on SEDAR at www.sedar.com.
This news release may contain forward-looking statements including but not limited to comments regarding the timing and content of upcoming work programs, geological interpretations, receipt of property titles, potential mineral recovery processes, etc. Forward-looking statements address future events and conditions and therefore involve inherent risks and uncertainties. Actual results may differ materially from those currently anticipated in such statements.
The Canadian Securities Exchange (operated by CNSX Markets Inc.) has neither approved nor disapproved of the contents of this press release.
Tartisan Nickel Corp. Closes $1,798,000 Flow-Through Financing at $0.32 per Unit
The proceeds from the flow-through financing are being used to fund the exploration, development, advancement and feasibility of the Company's flagship Kenbridge Nickel Project, Atikwa Lake Area, Kenora Mining District, Ontario. The Company has commenced the work program as outlined in the July 2022 P.E.A (SEDAR).
About Tartisan Nickel Corp.
Tartisan Nickel Corp. is a Canadian based mineral exploration and development company which owns; the Kenbridge Nickel Project in northwestern Ontario; the Sill Lake Silver Property in Sault Ste. Marie, Ontario as well as the Don Pancho Manganese-Zinc-Lead-Silver Project in Peru. The Company has an equity stake in; Eloro Resources Limited, Class 1 Nickel and Technologies Limited, Peruvian Metals Corp. and Silver Bullet Mines Inc.
Tartisan Nickel Corp. common shares are listed on the Canadian Securities Exchange (CSE: TN) (OTCQX: TTSRF) (FSE: A2D). There are 114,538,128 shares outstanding after this current issuance.
For further information, please contact Mark Appleby, President & CEO, and a Director of the Company, at 416-804-0280 (info@tartisannickel.com). Additional information about Tartisan Nickel Corp. can be found at the Company's website at www.tartisannickel.com or on SEDAR at www.sedar.com.
This news release may contain forward-looking statements including but not limited to comments regarding the timing and content of upcoming work programs, geological interpretations, receipt of property titles, potential mineral recovery processes, etc. Forward-looking statements address future events and conditions and therefore, involve inherent risks and uncertainties. Actual results may differ materially from those currently anticipated in such statements.
The Canadian Securities Exchange (operated by CNSX Markets Inc.) has neither approved nor disapproved of the contents of this press release.
To view the source version of this press release, please visit https://www.newsfilecorp.com/release/146020
News Provided by Newsfile via QuoteMedia
Tartisan Nickel Corp. Files Preliminary Economic Assessment of the Kenbridge Nickel Project, Northwestern Ontario, on SEDAR
Tartisan Nickel Corp. (CSE: TN) (OTCQX: TTSRF) (FSE: 8TA) ("Tartisan", or the "Company") is pleased to announce the completion and filing of the Preliminary Economic Assessment(" PEA") for the 100% owned Kenbridge Nickel Project, Northwestern Ontario (SEDAR August 26, 2022). The Kenbridge Nickel Project is in the Kenora Mining District, Northwestern Ontario. The property is covered by patented and unpatented mining claims totalling 4,108.42 ha. Since 1937, 665 surface and underground drill holes totalling 99,741 meters have been completed on the property. Kenbridge has an existing shaft to a depth of 2,042 ft (622 m), with 13 level stations at 150 ft. (46 m) intervals below the shaft collar and two levels developed at 350 ft (107 m) and 500 ft (152 m) below the shaft collar.
The PEA was independently prepared by P&E Mining Consultants Inc. ("P&E") of Brampton, Ontario under the supervision of Eugene J. Puritch, P.Eng., FEC, CET.
Highlights of the PEA (All currency is $CDN unless stated otherwise)
This PEA is focused solely on underground mining of the Mineral Resources at the Kenbridge Nickel Project and provides a solid base case for moving the Kenbridge Nickel Project forward. The PEA indicates a 9-year mine plan based on a 1,500 tonne per day underground mining and processing operation, which would have the capacity and could potentially accelerate to 2,000 t.p.d. The mine plan assumes the potentially extractable tonnage of Measured, Indicated and Inferred Mineral Resources which assumes overall dilution of 47% (18% internal dilution from stope designs plus 29% external dilution) and a 94% mine recovery factor. Measured and Indicated Mineral Resources represent 3,445,000 tonnes at 0.97% Ni, 0.52% Cu and 0.013% Co (74 Mlb Ni, 39.1 Mlb Cu). Inferred Mineral Resources represent 1,014,000 tonnes at 1.47% Ni, 0.67% Cu and 0.011% Co (32.7 Mlb Ni, 14.9 Mlb Cu). Metal prices are based on long-term industry consensus forecast with nickel representing the primary contribution to revenues. USD metal prices used in the PEA were USD$10/lb Ni, USD$4/lb Cu and USD$26/lb Co. A $USD:$CDN exchange rate of 0.78 is applied.
LOM revenues from net smelter returns are estimated at $837 million. LOM operating costs are estimated at $292 million. Mining costs are estimated at $38.93per tonne mined, processing costs are $17.74 per tonne and G&A costs are $7.96 per tonne. Cash operating costs are estimated at US$3.76/lb NiEq and all-in sustaining costs ("AISC") are US$4.99/lb NiEq. LOM capital costs are estimated at $227 million and include pre-production capital costs of $133.7-million. Pre-tax Net Present Value ("NPV") is estimated at $182.5 million using a 5% discount rate. Pre-tax Internal Rate of Return ("IRR") is 26%. Payback period is 3.5 years on an after-tax basis.
Mark Appleby President and CEO of Tartisan states: "The Kenbridge Nickel Project PEA is focused solely on the current underground Mineral Resource. There is excellent potential to increase and upgrade the quality of the near surface mineralization at Kenbridge thereby adding additional years of production or providing the basis for an increase in annual throughput. The PEA provides compelling evidence to move into Pre-Feasibility and for the Kenbridge Nickel Project to move into a production scenario. The Company has commenced the necessary baseline studies and has undertaken additional studies which are essential and necessary in Project Permitting. The Company continues to upgrade the access road to site with completion anticipated in late September, October 2022.
Cautionary Statement - The reader is advised that the PEA summarized in this news release is intended to provide only an initial, high-level review of the project potential and design options. The PEA mine plan and economic model include numerous assumptions and the use of Inferred Mineral Resources. Inferred Mineral Resources are considered to be too speculative to be used in an economic analysis except as allowed by NI 43-101 in PEA studies. There is no guarantee the project economics described herein will be achieved.
About Tartisan Nickel Corp.
Tartisan Nickel Corp. is a Canadian based mineral exploration and mine development company whose flagship asset is the Kenbridge Nickel-Copper Project located in the Kenora Mining District, Northwestern Ontario. Tartisan also owns; the Sill Lake Silver Property in Sault St. Marie, Ontario as well as the Don Pancho Manganese-Zinc-Lead-Silver Project in Peru.
Tartisan Nickel Corp. common shares are listed on the Canadian Securities Exchange (CSE: TN) (OTCQX: TTSRF) (FSE: 8TA). Currently, there are 108,922,503 shares outstanding (120,218,018 fully diluted).
Dean MacEachern P.Geo. and Eugene Puritch, P.Eng, FEC, CET are the respective Company and independent Qualified Persons under NI 43-101 and have read and approved the technical content of this News Release.
The Company has filed the PEA on SEDAR at www.sedar.com in accordance with NI 43-101.
For further information, please contact Mark Appleby, President & CEO, and a Director of the Company, at 416-804-0280 (info@tartisannickel.com). Additional information about Tartisan Nickel Corp. can be found at the Company's website at www.tartisannickel.com or on SEDAR at www.sedar.com.
This news release may contain forward-looking statements including but not limited to comments regarding the timing and content of upcoming work programs, geological interpretations, receipt of property titles, potential mineral recovery processes, etc. Forward-looking statements address future events and conditions and therefore, involve inherent risks and uncertainties. Actual results may differ materially from those currently anticipated in such statements.
The Canadian Securities Exchange (operated by CNSX Markets Inc.) has neither approved nor disapproved of the contents of this press release.
To view the source version of this press release, please visit https://www.newsfilecorp.com/release/135205
News Provided by Newsfile via QuoteMedia
VOX PROVIDES GOLD ROYALTY DEVELOPMENTS AND EXPLORATION UPDATES
Vox Royalty Corp. (TSXV: VOX) (OTCQX: VOXCF) (" Vox " or the " Company ") a returns focused precious metals royalty company, is pleased to provide recent development and exploration updates from royalty operating partners Norton Gold Fields Pty Ltd. (" Norton Gold "), Northern Star Resources Limited (ASX: NST) (" Northern Star "), Black Cat Syndicate Limited (ASX: BC8) (" Black Cat "), Norwest Minerals Limited (ASX: NWM) (" Norwest "), and Tartisan Nickel Corp. (CSE: TN) (" Tartisan ").
Kyle Floyd , Chief Executive Officer stated: "The past two months have seen material progress on certain Vox gold royalty assets, with the opening of the Binduli North gold mine, ongoing construction at the Otto Bore gold mine by Northern Star and meaningful pre-production planning at the Bulong and Bulgera gold toll-treatment projects. This progress continues to support Vox management expectations of organic growth from 6 to 10 or more producing royalties by late 2023 and further revenue growth."
- Official opening of the Binduli North heap leach mine covered by the Janet Ivy gold royalty, released by Zijin Mining Group Co., Ltd.'s (HKSE: 2899) (" Zijin Mining ") subsidiary, Norton Gold ;
- Construction update for the Otto Bore gold mine by Northern Star;
- Final high grade drilling results at the Myhree gold deposit by Black Cat, which is covered by the Bulong royalty;
- Development of pit designs, completion of a potential site layout and preparations for Mining Lease application at the Bulgera gold deposit by Norwest; and
- Completion of a Preliminary Economic Assessment (" PEA ") and permitting update on the Kenbridge nickel project by Tartisan, indicating a potential 9-year mine life with a goal of production in approximately 3 years.
- Vox holds an uncapped A$0.50 /tonne production royalty over the Janet Ivy gold mine in Western Australia ;
- In March 2022 , Zijin Mining filed a mining proposal for the Binduli North 5Mtpa heap leach gold project, which was further described in Vox's operator update released on June 9, 2022 ;
- On July 8, 2022 , the Western Australian State Government announced :
- "The McGowan Government has congratulated Norton Gold Fields for officially opening its A$278 million Binduli North heap leach project;
- The project created 300 jobs during construction and will employ 200 workers during production; and
- The operation has an estimated 10-year life span and is expected to produce an average of 75,000 ounces of gold per year."
- Vox Management Summary: The official opening of the Binduli North mine is a major growth milestone for Vox and expected to unlock annual royalty revenues of A$2M – A$2.5M over the mine's ~10-year life. This expansion was the key potential catalyst that supported Vox management's decision to acquire the Janet Ivy royalty for ~A$5.5M in March 2021 .
- Vox holds a 2.5% net smelter return royalty (between 42koz – 100koz cumulative production) over the Otto Bore gold project in Western Australia , acquired in conjunction with the producing Janet Ivy / Binduli North gold royalty in March 2021 ;
- On July 20, 2022 , Northern Star announced :
- At Thunderbox, open pit mining continued with D Zone pre-strip and the installation of key infrastructure at Otto Bore to support open pit mining operation;
- 12% of Northern Star's A$650M group growth capex in FY23 is to be spent at Yandal hub on:
- Completion of the Thunderbox mill expansion, which is on track and on budget for commissioning and ramp up in the first half of 2023;
- Establishment of the Otto Bore mine; and
- New tailings dam.
- Vox Management Summary: Otto Bore is expected to become Vox's seventh producing royalty asset, commencing in the second half of 2022. Northern Star are developing this new gold mine as a feed source for the low-cost Thunderbox mill ahead of Vox management expectations.
- Vox holds an uncapped 1% net smelter royalty over part of the Bulong gold project in Western Australia ;
- On July 29, 2022 , Black Cat announced :
- Final Reverse Circulation (" RC ") grade control drilling at Myhree was undertaken in June 2022 . The first half of assay results have been returned and reinforced the high-grade open pit Ore Reserve of 0.6Mt @ 2.4 g/t Au for 46koz (1) ;
- Results include:
- 5m @ 19.63 g/t Au from 33m (22MYGC037);
- 7m @ 7.36 g/t Au from 30m (22MYGC038);
- 3m @ 7.29 g/t Au from 18m and 6m @ 13.91 g/t Au from 32m (22MYGC022);
- 4m @ 12.38 g/t Au from 37m (22MYGC036);
- 7m @ 4.89 g/t Au from 8m (22MYGC031);
- 3m @ 8.21 g/t Au from 6m (22MYGC032);
- 2m @ 10.24 g/t Au from 5m (22MYGC033);
- 4m @ 6.36 g/t Au from 27m (22MYGC039);
- 3m @ 11.12 g/t Au from 27m (22MYGC040);
- All grade control drilling at Myhree is now complete and remaining assays are expected in August 2022 ;
- Myhree open pit is fully approved and mining can commence once an ore processing solution is secured, discussions with interested parties are ongoing; and
- Black Cat's Managing Director, Gareth Solly , said, "Myhree was Black Cat's first discovery in 2018 and it is satisfying to know it has the potential to be our first producing mine. With the final results due within weeks, Myhree is now ready for production, subject to securing a processing solution for the high-grade ore."
- Vox Management Summary: Since Vox acquired the Bulong gold royalty from an Australian automotive group in September 2020 , the project has been aggressively advanced by Black Cat and is progressing closer to production. Black Cat is guiding towards potential commencement of toll-treated production from October 2022 onwards.
- Vox acquired the uncapped 1% NSR royalty over the Bulgera gold project in Western Australia for A$225k in March 2021 ;
- On July 29, 2022 , Norwest announced :
- Economic pit optimisation shells were developed into proper pit designs for the Bulgera, Mercuiri and Price deposits and a site layout completed;
- The company is compiling information and taking steps required to lodge an application for converting the project exploration license to a mining license;
- The application is currently being compiled and submission to the Department of Mines, Industry Regulation and Safety (DMIRS) in Western Australia is expected next quarter;
- Discussions to toll treat Bulgera gold resources continue with the local gold plant operator; and
- A program of drilling 15 x 200m RC holes to the west and east along strike from the Bulgera open cut has been approved and the commencement of this drill program is planned for 2023.
- Vox Management Summary: The Bulgera royalty was acquired for A$225k less than 18 months ago and is rapidly being fast-tracked towards a development decision with a mining license application expected next quarter. We look forward to the outcomes of ongoing discussions with the local gold plant operator regarding potential toll treatment.
- Vox holds an uncapped 1% net smelter return royalty on part of the Kenbridge nickel-copper project in Canada , which is subject to a full buyback right for C$1.5M in favour of Tartisan. Vox's 1% NSR royalty was originally created in January 2018 as part of a debt settlement between former Kenbridge project operator Canadian Arrow Mines Limited and Breakwater Resources Limited (as a subsidiary of Nyrstar);
- On July 12, 2022 , Tartisan announced the completion of a positive PEA for the Kenbridge Nickel Project (2) , with the following highlights:
- A 9-year mine plan based on a 1,500 tonne per day underground mining and processing operation;
- Life of mine revenues from net smelter returns are estimated at C$837 million (assuming USD metal prices of USD$10 /lb Ni, USD$4 /lb Cu and USD$26 /lb Co and a USD:CAD exchange rate of 0.78);
- Measured and Indicated mineral resources represent 3,508,000 tonnes at 0.70% Ni, 0.35% Cu and 0.01% Co (54 Mlb Ni, 27 Mlb Cu); and
- Inferred mineral resources represent 1,013,000 tonnes at 1.21% Ni, 0.56% Cu and 0.01% Co (27 Mlb Ni, 13 Mlb Cu).
- On August 16, 2022 , Tartisan announced that:
- Initial environmental baseline studies have concluded;
- "Phase 2" environmental baseline studies have commenced and are outlined as follows:
- Bathymetry for receiving waterbodies/Lakes surrounding the project;
- Fisheries Studies on creeks and lakes surrounding the project;
- Surface water quality sampling, stream flow monitoring and data download, and groundwater quality sampling from spring 2022 installed monitoring stations;
- Water Quality Profiling and Sampling from receiving waterbodies;
- Stage 1 Archeology Assessment;
- Stage 1 Geochemistry Assessment; and
- Tartisan's CEO Mark Appleby commented, " Baseline studies continue at the Kenbridge Nickel Project and signify the Company's commitment to an approximate three years to production timeline. The Company is continuing to review and implement all necessary steps in the permitting and mining approval process. The recently announced PEA results outlined robust economics and significant value of the Kenbridge Nickel Project. The full PEA Report will be available on SEDAR shortly ".
- Vox Management Summary: The Kenbridge royalty rights were acquired as part of the Nyrstar/Breakwater Resources portfolio of royalties in January 2021 and the project operator is now guiding towards potential first production in approximately three years. As a past-producing underground nickel-copper mine with an existing 609m shaft, this project has potential to be fast-tracked back into production.
Timothy J. Strong , MIMMM, of Kangari Consulting LLC and a "Qualified Person" under NI 43-101, has reviewed and approved the scientific and technical disclosure contained in this press release.
Vox is a returns focused precious metals royalty company with a portfolio of over 50 royalties and streams spanning eight jurisdictions. The Company was established in 2014 and has since built unique intellectual property, a technically focused transactional team and a global sourcing network which has allowed Vox to target the highest return on invested capital in the royalty sector. Since the beginning of 2020, Vox has announced over 20 separate transactions to acquire over 50 royalties.
Further information on Vox can be found at www.voxroyalty.com .
This news release contains certain forward-looking statements. Any statements that express or involve discussions with respect to predictions, expectations, beliefs, plans, projections, objectives, assumptions or future events or performance (often, but not always, using words or phrases such as "expects" or "does not expect", "is expected", "anticipates" or "does not anticipate" "plans", "estimates" or "intends" or stating that certain actions, events or results " may", "could", "would", "might" or "will" be taken, occur or be achieved) are not statements of historical fact and may be "forward-looking statements".
The forward-looking statements and information in this press release include, but are not limited to, summaries of operator updates provided by management and the potential impact on the Company of such operator updates, statements regarding expectations for the timing of commencement of development, construction at and/or resource production from various mining projects, expectations regarding the size, quality and exploitability of the resources at various mining projects, future operations and work programs of Vox's mining operator partners, the receipt of future royalty payments derived from various royalty assets of Vox, anticipated future cash flows and future financial reporting by Vox, and requirements for and operator ability to receive regulatory approvals.
Forward-looking statements and information are based on forecasts of future results, estimates of amounts not yet determinable and assumptions that, while believed by management to be reasonable, are inherently subject to significant business, economic and competitive uncertainties and contingencies. Forward-looking statements and information are subject to various known and unknown risks and uncertainties, many of which are beyond the ability of Vox to control or predict, that may cause Vox's actual results, performance or achievements to be materially different from those expressed or implied thereby, and are developed based on assumptions about such risks, uncertainties and other factors set out herein, including but not limited to: the requirement for regulatory approvals and third party consents, the impact of general business and economic conditions, the absence of control over the mining operations from which Vox will receive royalties, including risks related to international operations, government relations and environmental regulation, the inherent risks involved in the exploration and development of mineral properties; the uncertainties involved in interpreting exploration data; the potential for delays in exploration or development activities; the geology, grade and continuity of mineral deposits; the impact of the COVID-19 pandemic; the possibility that future exploration, development or mining results will not be consistent with Vox's expectations; accidents, equipment breakdowns, title matters, labor disputes or other unanticipated difficulties or interruptions in operations; fluctuating metal prices; unanticipated costs and expenses; uncertainties relating to the availability and costs of financing needed in the future; the inherent uncertainty of production and cost estimates and the potential for unexpected costs and expenses, commodity price fluctuations; currency fluctuations; regulatory restrictions, including environmental regulatory restrictions; liability, competition, loss of key employees and other related risks and uncertainties.
Vox has assumed that the material factors referred to in the previous paragraph will not cause such forward looking statements and information to differ materially from actual results or events. However, the list of these factors is not exhaustive and is subject to change and there can be no assurance that such assumptions will reflect the actual outcome of such items or factors. The forward-looking information contained in this press release represents the expectations of Vox as of the date of this press release and, accordingly, is subject to change after such date. Readers should not place undue importance on forward looking information and should not rely upon this information as of any other date. While Vox may elect to, it does not undertake to update this information at any particular time except as required in accordance with applicable laws.
Neither the TSX Venture Exchange nor its Regulation Services Provider (as that term is defined in policies of the TSX Venture Exchange) accepts responsibility for the adequacy or accuracy of this release.
Except where otherwise stated, the disclosure in this press release is based on information publicly disclosed by project operators based on the information/data available in the public domain as at the date hereof and none of this information has been independently verified by Vox. Specifically, as a royalty investor, Vox has limited, if any, access to the royalty operations. Although Vox does not have any knowledge that such information may not be accurate, there can be no assurance that such information from the project operators is complete or accurate. Some information publicly reported by the project operators may relate to a larger property than the area covered by Vox's royalty interests. Vox's royalty interests often cover less than 100% and sometimes only a portion of the publicly reported mineral reserves, mineral resources and production from a property.
(1) | The Myhee drilling results and information in Black Cat's 29 July 2022 announcement that relates to geology, and planning was complied by Mr. Iain Levy, who is a Member of the Australian Institute of Geoscientists. See https://www.asx.com.au/asxpdf/20220729/pdf/45c9knjl083f5m.pdf . |
(2) | Tartisan's press release titled, "Tartisan Nickel Corp. Provides Positive Preliminary Economic Assessment For The Kenbridge Nickel Project, Kenora Mining District, Northwestern Ontario" dated 12 July 2022. Dean MacEachern, P.Geo. and Eugene Puritch, P.Eng, FEC, CET are the respective Tartisan and independent Qualified Persons under NI 43-101. See https://tartisannickel.com/tartisan-nickel-corp-provides-positive-preliminary-economic-assessment-for-the-kenbridge-nickel-project-kenora-mining-district-northwestern-ontario/ . |
SOURCE Vox Royalty Corp.
View original content to download multimedia: https://www.newswire.ca/en/releases/archive/August2022/18/c7341.html
News Provided by Canada Newswire via QuoteMedia
Tartisan Nickel Corp.: Environmental Baseline Studies Enter Second Phase at the Kenbridge Nickel Project, Northwestern Ontario
Tartisan Nickel Corp. (CSE: TN) (OTCQX: TTSRF) (FSE: 8TA) ("Tartisan", or the "Company") is pleased to announce that the initial environmental baseline studies have concluded, and that "Phase 2" environmental baseline studies have commenced at the Kenbridge Nickel Project, Kenora Mining District, Northwestern Ontario.
Tartisan had previously announced that Knight Piesold Consulting ("KP") and Blue Heron Environmental ("BH") have been retained to carry out these various time sensitive environmental baseline studies (SEDAR). Environmental baseline studies are critical in the permitting and approvals process and overall advancement of the Kenbridge Nickel Project. The Company is taking the necessary steps to advance the Kenbridge Nickel Project with the goal of nickel-copper production in approximately three years.
Work in "Phase 2" is outlined as follows:
- - Bathymetry for receiving waterbodies/Lakes surrounding the project
- - Fisheries Studies on creeks and lakes surrounding the project
- - Surface Water Quality Sampling from spring 2022 installed monitoring stations
- - Water Quality Profiling and Sampling from receiving waterbodies
- - Stream Flow Monitoring and data download from spring 2022 installed monitoring stations
- - Groundwater Quality Sampling from spring 2022 installed monitoring stations
- - Stage 1 Archeology Assessment
- - Stage 1 Geochemistry Assessment
Tartisan Nickel Corp. CEO Mark Appleby commented, "Baseline studies continue at the Kenbridge Nickel Project and signify the Company's commitment to an approximate three years to production timeline. The Company is continuing to review and implement all necessary steps in the permitting and mining approval process. The recently announced PEA results outlined robust economics and significant value of the Kenbridge Nickel Project. The full PEA Report will be available on SEDAR shortly."
The Kenbridge Nickel Project is located via the Trans-Canada Highway, 10.2 km from the township of Sioux Narrows. The Kenbridge Nickel Project has a Mineral Resource Estimate (SEDAR: June 1, 2021), a 622-meter three compartment shaft with two underground level workstations and has never been mined. As previously announced, Tartisan has retained P & E Mining Consultants Inc. to update the historic Preliminary Economic Assessment ("PEA") on the Kenbridge Nickel Project. The full Kenbridge Nickel Project PEA Report will be filed on SEDAR.
About Tartisan Nickel Corp.
Tartisan Nickel Corp. is a Canadian based mineral exploration and mine development company whose flagship asset is the Kenbridge Nickel Deposit located in northwestern Ontario. Tartisan also owns; the Sill Lake Silver Property in Sault St. Marie, Ontario as well as the Don Pancho Manganese-Zinc-Lead-Silver Project in Peru amongst other assets.
Tartisan Nickel Corp. common shares are listed on the Canadian Securities Exchange (CSE: TN) (OTCQX: TTSRF) (FSE: 8TA). Currently, there are 108,922,503 shares outstanding (120,218,018 fully diluted).
Dean MacEachern P. Geo. is the Qualified Person under NI 43-101 and has read and approved the technical content of this News Release.
For further information, please contact Mark Appleby, President & CEO, and a Director of the Company, at 416-804-0280 (info@tartisannickel.com). Additional information about Tartisan Nickel Corp. can be found at the Company's website at www.tartisannickel.com or on SEDAR at www.sedar.com.
This news release may contain forward-looking statements including but not limited to comments regarding the timing and content of upcoming work programs, geological interpretations, receipt of property titles, potential mineral recovery processes, etc. Forward-looking statements address future events and conditions and therefore, involve inherent risks and uncertainties. Actual results may differ materially from those currently anticipated in such statements. The Canadian Securities Exchange (operated by CNSX Markets Inc.) has neither approved nor disapproved of the contents of this press release.
To view the source version of this press release, please visit https://www.newsfilecorp.com/release/133963
News Provided by Newsfile via QuoteMedia
Tartisan Nickel Corp. Provides Positive Preliminary Economic Assessment for the Kenbridge Nickel Project, Kenora Mining District, Northwestern Ontario
Tartisan Nickel Corp. (CSE: TN) (OTCQX: TTSRF) (FSE: 8TA) ("Tartisan", or the "Company") is pleased to announce the completion of a positive Preliminary Economic Assessment(" PEA") for the 100% owned Kenbridge Nickel Project. The Kenbridge Nickel Project is in the Kenora Mining District, Northwestern Ontario. Kenbridge has an existing shaft to a depth of 2,042 ft (622 m), with level stations at 150 ft. (45 m) intervals below the shaft collar and two levels developed at 350 ft (107 m) and 500 ft (152 m) below the shaft collar.
The PEA was independently prepared by P&E Mining Consultants Inc. ("P&E") of Brampton, Ontario under the supervision of Eugene J. Puritch, P.Eng., FEC, CET.
Highlights of the PEA (All currency is $CDN unless stated otherwise)
This PEA is focused solely on mining of the Mineral Resources at the Kenbridge Nickel Project underground mine and provides a solid base case for moving the Kenbridge Project forward. The PEA indicates a 9-year mine plan based on a 1,500 tonne per day underground mining and processing operation. The mine plan assumes the potentially extractable tonnage of Measured, Indicated and Inferred Mineral Resources which assumes overall dilution of 47% (18% internal dilution from stope designs plus 29% external dilution) and a 94% mine recovery factor. Measured and Indicated Mineral Resources represent 3,508,000 tonnes at 0.70% Ni, 0.35% Cu and 0.01% Co (54 Mlb Ni, 27 Mlb Cu). Inferred Mineral Resources represent 1,013,000 tonnes at 1.21% Ni, 0.56% Cu and 0.01% Co (27 Mlb Ni, 13 Mlb Cu). Metal prices are based on long-term industry consensus forecast with nickel representing the primary contribution to revenues. USD metal prices used in the PEA were USD$10/lb Ni, USD$4/lb Cu and USD$26/lb Co. A $USD:$CDN exchange rate of 0.78 is applied. Life of mine ("LOM") processing recovers 200,900 tonnes of nickel concentrate at 15% Ni and 66,900 tonnes of copper concentrate at 24% Cu. This results in 52.6 million lbs of payable Ni and 30.7 million lbs of payable Cu.
LOM revenues from net smelter returns are estimated at $837 million. LOM operating costs are estimated at $292 million. Mining costs are estimated at $38.94 per tonne mined, processing costs are $17.74 per tonne and G&A costs are $7.96 per tonne. Cash operating costs are estimated at US$3.76/lb NiEq and all-in sustaining costs ("AISC") are US$4.99/lb NiEq. LOM capital costs are estimated at $227 million and include pre-production capital costs of $134 million. Pre-tax Net Present Value ("NPV") is estimated at $183 million using a 5% discount rate. Pre-tax Internal Rate of Return ("IRR") is 26%.
Net cash flow of $837 million less operating costs of $292 million less royalties of $22 million less closure costs of $10 million less capital expenditures of $227 million less taxes of $105 million results in an after-tax cash flow of $180 million. After-tax NPV using a 5% discount rate is estimated at $109 million and after-tax IRR is estimated at 20%. Financial highlights are shown in Tables 1 and 2 below.
Mark Appleby, President and CEO of Tartisan, states: "We are extremely pleased with the results of the PEA which is focused solely on the current underground Mineral Resource. There remains excellent potential to increase and upgrade the quality of the near surface mineralization at Kenbridge thereby adding additional years of production or providing the basis for an increase in annual throughput. By adjusting the mining plan to be an underground operation it allows Tartisan to utilize the existing shaft infrastructure thereby accessing higher grades of mineralization early in the proposed mine life. The PEA provides compelling evidence to move towards Feasibility and for the Kenbridge Nickel Project to move into production. The Company has commenced the necessary baseline studies which are essential and necessary in Project Permitting and is upgrading the access road to site with completion anticipated in September 2022. Tartisan continues to develop positive relationships with its surrounding First Nations through its First Nation consulting partner Talon Resources and Community development Inc. Every effort is being made for the Tartisan Kenbridge Project to become a part of the nickel supply chain this decade!"
Table 1: Net Present Value and Internal Rate of Return Calculations
Pre-Tax | After Tax | |
Undiscounted NPV ($M) | 286 | 181 |
NPV (5%) ($M) | 183 | 109 |
IRR (%) | 26 | 20 |
Payback (years) | 3.4 | 3.5 |
Table 2: PEA Financial Highlights
General | Value | |
Nickel Price (US$/lb) | 10 | |
Copper Price (US$/lb) | 4 | |
Cobalt Price (US$/lb) | 26 | |
Exchange Rate (US$:C$) | 0.78 | |
LOM (years) | 9.0 | |
Production | ||
Ni Production (Mlb) | 52.6 | |
Cu Production (Mlb) | 30.7 | |
NiEq Mine Production (Mlb) | 65.3 | |
Average NiEq Annual Production (Mlb) | 7.3 | |
Operating Costs | ||
Mining Cost ($/t Mined) | 38.93 | |
Processing Cost ($/t Processed) | 17.74 | |
G&A Cost ($/t Processed) | 7.96 | |
Total Operating Costs ($/t Processed) | 64.64 | |
NSR Royalty after 1.5% buyback (%) | 2.50 | |
Cash Costs (US$/lb NiEq) | 3.76 | |
AISC (US$/lb NiEq) | 4.99 | |
Capital Costs | ||
Initial Capital ($M) | 133.7 | |
Sustaining Capital ($M) | 93.1 | |
Closure Costs ($M) | 10.0 | |
Financials | Pre-Tax | After-Tax |
NPV (5%) ($M) | 182.5 | 109.1 |
IRR (%) | 26 | 20 |
Payback (years) | 3.4 | 3.5 |
The previous Mineral Resource Estimate on the Kenbridge Project was disclosed on September 2, 2020, and was based on a combination of pit-constrained and out-of-pit Mineral Resources. There has since been 10 holes drilled in 2021. Updated engineering studies have indicated that potential pit-constrained Mineral Resources are less economic than out-of-pit Mineral Resources. Therefore, the new drill holes have been incorporated into an updated Mineral Resource Estimate based on a potential underground mining operation, as presented in Table 3 below. The effective date of the Mineral Resource is July 6, 2022.
Table 3 Mineral Resource Estimate(1-4) | |||||||||
Class | Cut-off NSR C$/t | Tonnes (k) | Ni (%) | Ni (Mlb) | Cu (%) | Cu (Mlb) | Co (%) | Co (Mlb) | NSR (C$/t) |
Measured | 100 | 1,867 | 0.99 | 41.0 | 0.50 | 20.6 | 0.017 | 0.7 | 184.40 |
Indicated | 100 | 1,578 | 0.95 | 33.0 | 0.53 | 18.5 | 0.009 | 0.3 | 180.26 |
Meas+Ind | 100 | 3,445 | 0.97 | 74.0 | 0.52 | 39.1 | 0.013 | 1.0 | 182.51 |
Inferred | 100 | 1,014 | 1.47 | 32.7 | 0.67 | 14.9 | 0.011 | 0.2 | 263.38 |
Note: Ni =Nickel Cu = Copper, Co = Cobalt, NSR = Net Smelter Return.
1. Mineral Resources which are not Mineral Reserves do not have demonstrated economic viability.
2. The estimate of Mineral Resources may be materially affected by environmental, permitting, legal, title, taxation, socio-political, marketing, or other relevant issues.
3. The Inferred Mineral Resource in this estimate has a lower level of confidence than that applied to an Indicated Mineral Resource and must not be converted to a Mineral Reserve. It is reasonably expected that the majority of the Inferred Mineral Resource could be upgraded to an Indicated Mineral Resource with continued exploration.
4. The Mineral Resources were estimated using the Canadian Institute of Mining, Metallurgy and Petroleum (CIM), CIM Standards on Mineral Resources and Reserves, Definitions and Guidelines (2014) and Best Practices Guidelines (2019) prepared by the CIM Standing Committee on Reserve Definitions and adopted by the CIM Council.
5. The Mineral Resource Estimate is based on US$ metal prices of $8.25/lb Ni, $4.00/lb Cu, $26/lb Co. The US$:CDN$ exchange rate used was 0.76.
6. The NSR estimate uses flotation recoveries of 75% for Ni, 77% for Cu, 40% for Co and smelter payables of 92% for Ni, 96% for Cu, 50% for Co.
7. Mineral Resources were determined to be potentially extractable with the longhole mining method based on an underground mining cost of $77/t mined, processing of $19/t and G&A costs of $4/t.
Cautionary Statement - The reader is advised that the PEA summarized in this news release is intended to provide only an initial, high-level review of the project potential and design options. The PEA mine plan and economic model include numerous assumptions and the use of Inferred Mineral Resources. Inferred Mineral Resources are considered to be too speculative to be used in an economic analysis except as allowed by NI 43-101 in PEA studies. There is no guarantee the project economics described herein will be achieved.
About Tartisan Nickel Corp.
Tartisan Nickel Corp. is a Canadian based mineral exploration and development company whose flagship asset is the Kenbridge Nickel-Copper Project located in the Kenora Mining District, Northwestern Ontario. Tartisan also owns; the Sill Lake Silver Property in Sault St. Marie, Ontario as well as the Don Pancho Manganese-Zinc-Lead-Silver Project in Peru.
Tartisan Nickel Corp. common shares are listed on the Canadian Securities Exchange (CSE: TN) (OTCQX: TTSRF) (FSE: 8TA). Currently, there are 108,922,503 shares outstanding (120,218,018 fully diluted).
Dean MacEachern, P.Geo. and Eugene Puritch, P.Eng, FEC, CET are the respective Company and independent Qualified Persons under NI 43-101 and have read and approved the technical content of this News Release.
The Company will file the PEA on SEDAR at www.sedar.com in accordance with NI 43-101 within 45 days of this news release.
For further information, please contact Mark Appleby, President & CEO, and a Director of the Company, at 416-804-0280 (info@tartisannickel.com). Additional information about Tartisan Nickel Corp. can be found at the Company's website at www.tartisannickel.com or on SEDAR at www.sedar.com.
This news release may contain forward-looking statements including but not limited to comments regarding the timing and content of upcoming work programs, geological interpretations, receipt of property titles, potential mineral recovery processes, etc. Forward-looking statements address future events and conditions and therefore, involve inherent risks and uncertainties. Actual results may differ materially from those currently anticipated in such statements.
The Canadian Securities Exchange (operated by CNSX Markets Inc.) has neither approved nor disapproved of the contents of this press release.
To view the source version of this press release, please visit https://www.newsfilecorp.com/release/130620
News Provided by Newsfile via QuoteMedia
SilverCrest Reports Third Quarter 2024 Financial Results
Strong Free Cash Flow Continues, Supporting 29% Growth in Treasury Assets
TSX: SIL | NYSE American: SILV
SilverCrest Metals Inc. ("SilverCrest" or the "Company") is pleased to announce its financial results for the three months ended September 30, 2024 ("Q3 2024"). This release provides additional operational results to supplement the October 10, 2024 release of Q3 2024 operational highlights from the Company's Las Chispas Operation ("Las Chispas" or "Las Chispas Operation") located in Sonora, Mexico . All amounts herein are presented in United States Dollars ("US$"), unless otherwise stated.
N. Eric Fier , CEO, commented, "We are pleased to deliver another quarterly record for both revenue and mine operating earnings, as well as one of our best quarters to date for both operating and free cash flow. Our results were supported by strong metal prices, impressive sales quantities and all-in sustaining costs that were well below the low end of our 2024 guidance. Mining rates continued to benefit from having two underground contractors, a dynamic we plan to maintain into Q1 2025 as part of our strategy to manage single asset risk and create additional operational flexibility. These results once again showcase the quality and consistency of our asset and operating team.
Free cash flow per share remains a strong testament of our performance, increasing 49% to $0.24 per share (1) from already strong levels in Q2 2024. This performance led to a 29%, or $35.9 million , increase in treasury assets (1) to end the quarter with $158.2 million . With this exceptional quarter, we remain firmly on track to perform inline or better than our 2024 annual guidance for sales, cash costs, and all-in sustaining costs."
Q3 2024 Highlights
- Recovered 14,928 ounces ("oz") gold ("Au") and 1.4 million oz silver ("Ag"), or 2.6 million oz silver equivalent ("AgEq") (2) .
- Sold 15,204 oz Au and 1.5 million oz Ag (2.7 million oz AgEq) at average realized prices of $2,472 per oz Au (1) and $29.48 per oz Ag (1) . Total sales of 7.9 million oz AgEq for the nine months ended September 30, 2024 ("YTD") positions the Company to meet or exceed the top end of 2024 sales guidance of 10.0 million to 10.3 million oz AgEq.
- Record quarterly revenue of $80.4 million which exceeded Q2 2024 revenue of $72.7 million .
- Record mine operating earnings of $47.0 million representing a 59% operating margin (1) , exceeded the $41.5 million and 57% operating margin achieved in Q2 2024.
- Adjusted earnings (1) of $26.3 million , or $0.18 per share, which is largely consistent with the $24.9 million , or $0.17 per share in Q2 2024. Adjustments were largely related to deferred taxes, unrealized losses on derivative currency contracts, and transaction and integration costs.
- Net earnings were $9.5 million , or $0.06 per share, compared to $6.5 million , or $0.04 per share, in Q2 2024.
- Cash costs of $8.85 per oz AgEq (1) in Q3 2024 decreased from $8.87 in Q2 largely due to increased sales volume. Cash costs of $8.28 per oz AgEq YTD were below 2024 guidance of $9.25 to $9.75 per oz AgEq.
- All-in sustaining costs ("AISC") of $13.72 per oz AgEq (1) decreased from Q2 2024, due largely to planned lower sustaining capital expenditures. AISC of $14.50 per oz AgEq (1) YTD is below the low end of guidance of $14.90 to $15.75 per oz AgEq.
- Mining rates increased to 1,350 tonnes per day ("tpd"), a 23% increase from Q2 2024, benefiting from the ongoing engagement of two mining contractors at site throughout the quarter.
- Average daily mill throughput increased to 1,324 tpd due to capacity testing performed in the quarter. With testing complete in August, throughput has returned to the range of 1,200 tonnes per day for the remainder of the year.
- Operating cash flow of $44.2 million , or $0.30 per share, increased from $39.6 million , or $0.27 per share, in Q2 2024 largely from higher metal prices. Operating cash flow before changes in working capital in the quarter was $37.8 million or $0.25 per share (1) . Both figures are net of the payment of taxes and duties, which totaled $12.1 million .
- Free cash flow generation of $36.2 million , or $0.24 per share (1) , for the quarter increased by $11.9 million from $24.3 million , or $0.16 per share, in Q2 2024.
- Ended the quarter with total treasury assets of $158.2 million (1) ( $120.9 million cash and $37.4 million in bullion), an increase of 29% from $122.3 million at the end of Q2 2024. Gold and silver continued to be the best performing currencies in our treasury assets with a mark to market increase of $3.0 million in the quarter.
(1) | Refer to the "Non-GAAP Financial Measures" disclosure at the end of this press release and associated MD&A for a description and calculation of these measures. |
(2) | Silver equivalent ("AgEq") ratio used in this news release of 79.51:1 based on the Las Chispas Operation Technical Report dated September 5, 2023, with an effective date of July 19, 2023 (the "2023 Technical Report"). |
Third Quarter Operating Performance
The following operating performance refers to adjusted earnings, operating cash flow per share (basic), free cash flow, free cash flow per share (basic), cash costs, AISC, and treasury assets which are described in more detail in the "Non-GAAP Financial Measures" section of this news release.
Three months ended September 30, | Nine months ended September 30, | ||||
OPERATIONAL | Unit | 2024 | 2023 | 2024 | 2023 |
Ore mined | tonnes | 124,229 | 83,800 | 309,985 | 222,300 |
Underground development | kilometres ("km") | 4.4 | 3.3 | 13.3 | 9.6 |
Ore milled (1) | tonnes | 121,775 | 114,500 | 325,793 | 326,900 |
Average daily mill throughput | tpd | 1,324 | 1,245 | 1,193 | 1,197 |
Gold | |||||
Average grade | grams per tonne ("gpt") | 3.87 | 4.35 | 4.35 | 4.42 |
Recovery | % | 98.5 % | 98.3 % | 98.5 % | 98.1 % |
Recovered | oz | 14,928 | 15,700 | 44,950 | 45,600 |
Sold | oz | 15,204 | 14,500 | 44,704 | 42,100 |
Silver | |||||
Average grade | gpt | 366 | 413 | 416 | 427 |
Recovery | % | 98.3 % | 98.1 % | 98.2 % | 96.1 % |
Recovered | million oz | 1.41 | 1.49 | 4.28 | 4.31 |
Sold | million oz | 1.45 | 1.53 | 4.30 | 4.34 |
Silver equivalent | |||||
Average grade | gpt | 674 | 759 | 762 | 778 |
Recovery | % | 98.4 % | 98.2 % | 98.4 % | 97.0 % |
Recovered | million oz | 2.60 | 2.74 | 7.85 | 7.93 |
Sold | million oz | 2.66 | 2.68 | 7.85 | 7.69 |
Three months ended September 30, | Nine months ended September 30, | ||||
FINANCIAL | Unit | 2024 | 2023 | 2024 | 2023 |
Revenue | $ millions | $ 80.4 | $ 63.8 | $ 216.8 | $ 183.8 |
Cost of sales | $ millions | $ (33.3) | $ (26.4) | $ (90.8) | $ (72.5) |
Mine operating earnings | $ millions | $ 47.0 | $ 37.5 | $ 126.0 | $ 111.4 |
Earnings for the period | $ millions | $ 9.5 | $ 29.9 | $ 49.9 | $ 80.8 |
Earnings per share (basic) | $/share | $ 0.06 | $ 0.20 | $ 0.34 | $ 0.55 |
Adjusted earnings for the period | $ millions | $ 26.3 | $ 28.5 | $ 88.9 | $ 82.8 |
Adjusted earnings per share (basic) | $ millions | $ 0.18 | $ 0.19 | $ 0.60 | $ 0.56 |
Operating cash flow | $ millions | $ 44.2 | $ 43.8 | $ 82.6 | $ 122.2 |
Operating cash flow per share (basic) | $/share | $ 0.30 | $ 0.30 | $ 0.56 | $ 0.83 |
Free cash flow | $ millions | $ 36.2 | $ 34.0 | $ 49.2 | $ 97.0 |
Free cash flow per share (basic) | $/share | $ 0.24 | $ 0.23 | $ 0.33 | $ 0.66 |
Cash costs (2) | $/oz AgEq | $ 8.85 | $ 7.47 | $ 8.28 | $ 7.43 |
AISC (2) | $/oz AgEq | $ 13.72 | $ 12.23 | $ 14.50 | $ 11.94 |
September | December | ||||
Cash and cash equivalents | $ millions | $ 120.9 | $ 86.0 | ||
Bullion | $ millions | $ 37.4 | $ 19.2 | ||
Treasury assets | $ millions | $ 158.2 | $ 105.2 |
(1) | Ore milled includes material from stockpiles and ore mined. |
(2) | Q3 2023 figures have been recast to align with the presentation of the current period. For the three and nine months ended September 30, 2024, cash costs increased by $2.5 million and $4.7 million, respectively, from the exclusion of adjustments for corporate salaries and other expenses, and changes in inventories. |
Mine
In the quarter, a total of 124,229 tonnes were mined from the underground. Mining rates in Q3 2024 averaged 1,350 tpd, a 23% increase from Q2 2024, and above the originally targeted 2024 exit rate of 1,050 tpd. The Company completed 4.4 km of horizontal and vertical underground development, 0.7 km ahead of plan. Mining rates continued to benefit from having two mining contractors working simultaneously at site, a dynamic the Company plans to maintain through the end of Q1 2025 as part of a continued strategy to manage single asset risk and create additional operational flexibility.
Plant
Process plant throughput averaged 1,324 tpd in Q3 2024, benefiting from successful capacity testing of the plant in its current configuration at 1,500 tpd for 20 days.
Mill throughput returned to planned rates of 1,200 tpd by the end of the quarter and is expected to continue to run at this level for the remainder of the year. Process plant availability was 97.0% for the quarter, better than plan.
Average processed grades of 3.87 gpt Au and 366 gpt Ag, or 674 gpt AgEq compared to Q2 2024 grades of 4.36 gpt Au and 418 gpt Ag, or 765 gpt AgEq. As planned, grades in the quarter were lower than in Q2 2024 to balance increased throughput while maintaining consistent recovered ounces.
Average process recoveries in Q3 2024 were 98.5% Au and 98.3% Ag, or 98.4% AgEq, consistent with Q2 2024 and above design estimates.
Production
The Company produced 2.6 million oz AgEq in Q3 2024, largely in line with the 2.7 million oz AgEq in Q2 2024.
Sustaining Capital
Sustaining capital expenditures totaled $7.9 million in Q3 2024, which as expected, declined from $15.3 million in Q2 2024. Sustaining capital has totaled $33.4 million YTD and is expected to finish this year towards the top end of the 2024 guidance of $40.0 million to $44.0 million .
Cash Costs and AISC
During the quarter, cash costs averaged $8 .85 per oz AgEq, in line with Q2 2024 cash costs of $8 .87 per oz AgEq.
Cash costs YTD 2024 averaged $8.28 per oz AgEq, positioning the Company below the low end of 2024 cash cost guidance of $9.25 to $9.75 per oz AgEq.
AISC averaged $13.72 per oz AgEq in Q3 2024, 19% lower than in Q2 2024 ( $16.88 per oz AgEq) as a result of lower planned sustaining capital expenditures. AISC YTD of $14.50 per oz AgEq, positions the Company below the low end of annual AISC guidance of $14.90 to $15.75 per oz AgEq.
Exploration
During Q3 2024, the Company continued drilling activities at Las Chispas to support mineral resource growth with approximately 12,500 metres completed between conversion drilling (60%) and near mine targets (40%). In addition, efforts continued with regional field-based evaluation of greenfield targets.
Program expenditures of $2.5 million and $11.5 million for Q3 2024 and YTD 2024, respectively, put the Company in line to finish the year at the top end of the 2024 guidance range of $12.0 million to $14.0 million .
Selected Q3 2024 Financial Results
Revenue
During Q3 2024, the Company sold a total of 15,204 oz Au and 1.5 million oz Ag at average realized prices of $2 ,472 per oz Au and $29.48 per oz Ag, generating another quarter of record revenue of $80.4 million . During Q2 2024, the Company sold a total of 14,500 oz Au and 1.4 million oz Ag at average realized prices of $2,237 per oz Au and $27.84 per oz Ag, generating revenue of $72.7 million . The Company achieved record revenue in Q3 2024 due to higher metal prices and sales quantities relative to Q2 2024.
Net Earnings
Q3 2024 net earnings of $9.5 million , or $0.06 per share, increased compared to net earnings of $6.5 million , or $0.04 per share in Q2 2024. Similarly to Q2 2024, net earnings in the quarter were negatively impacted by declines in the Mexican peso. Income tax expense of $25.8 million recorded in the quarter was similar to $26.2 million in Q2 2024, with both quarters impacted by non-cash deferred tax expenses resulting from declines in the Mexican peso. Q3 2024 net earnings were also impacted by transaction and integration costs of $3.4 million .
Q3 2024 adjusted earnings of $26.3 million , or $0.18 per share, increased compared to adjusted earnings of $24.9 million or $0.17 per share in Q2 2024. This increase was primarily related to $5.5 million in higher mine operating earnings, partially offset by $4.4 million in higher current tax expense.
Cash Flow
In Q3 2024, cash flow generated by operating activities was $44.2 million , or $0.30 per share, an increase compared to $39.6 million , or $0.27 per share, in Q2 2024. Operating cash flow before changes in working capital was $37.8 million or $0.25 per share which compares to $31.8 million or $0.22 per share in Q2 2024.
During the quarter, the Company remitted $12.1 million in tax installments that will be attributable to 2024 payable income taxes. YTD tax payments totaled $52.7 million . Guidance for total tax payments in 2024 (including payments for 2023 taxes) was $56.0 to $63.0 million based on metal prices of $1,850 per oz Au and $22.80 per oz Ag and Mexican peso to US dollar of 17:1. With higher realized metal prices throughout the year, the Company expects total tax payments to be in the upper end or exceed this guidance.
During the quarter, the Company made payments of $10.4 million for mineral properties, plant and equipment, of which $7.9 million was related to sustaining capital expenditures and the remainder related to non-sustaining brownfield exploration capital expenditures at Las Chispas. This compares with $19.5 million of payments made for mineral property, plant and equipment in Q2 2024.
Q3 2024 free cash flow of $36.2 million , or $0.24 per share, increased 49% from $24.3 million , or $0.16 per share, in Q2 2024 as a result of increased operating cash flow and a planned reduction in sustaining capital expenditures.
Financial Position
As at September 30, 2024, the Company had treasury assets of $158.2 million ( $120.9 million cash and $37.4 million in bullion), an increase of $35.9 million from $122.3 million at the end of Q2 2024 ( $98.3 million cash and $24.0 million bullion). The Company remains debt free with access to an undrawn $70.0 million revolving facility.
Bullion assets increased by $13.3 million , or 56%, during the quarter as a result of $10.3 million in bullion purchases plus $3.0 million in mark-to-market increases from improved metal pricing.
The Company's working capital was $190.4 million on September 30, 2024, reflecting a $22.3 million increase from June 30 , 2024. This growth is attributed to continued increases of cash and bullion balances, driven by strong operating cash flow resulting from strong operating performance.
Environmental, Social and Governance ("ESG")
In Q3 2024, SilverCrest completed the latest phase of the reconstruction of the local sewage system in Arizpe with a total of 700 meters of new pipe installed. Work on other water related infrastructure projects in communities local to Las Chispas was paused, as planned, during the quarter due to seasonable rain and has since resumed.
During the quarter, the Company released its second annual ESG Report. The 2023 ESG Report offered further insight into SilverCrest's continued commitment to working with stakeholders to identify areas where contribution and Company lead initiatives can make the most meaningful impact.
Efforts to integrate renewable solar power at Las Chispas are progressing. With the permitting process underway SilverCrest expects to transition to using solar power in Q1 2025.
Subsequent Events
On October 4, 2024 , SilverCrest and Coeur Mining Inc. ("Coeur") announced that they have entered into a definitive agreement whereby Coeur will acquire all of the issued and outstanding shares of SilverCrest pursuant to a plan of arrangement (the "Transaction"). Pursuant to the Transaction, SilverCrest shareholders will receive 1.6022 Coeur common shares for each SilverCrest common share. The special meeting and management information circular relating to the Transaction is expected to be available in Q4 2024, with the Transaction expected to close in late Q1 2025.
As a result of the Transaction and quarter end reporting, a blackout was in place which prevented the exercise of some expiring options, including 149,800 held by executives and Board of Directors. It is expected that these options, along with 163,750 expiring in late December 2024 , will be exercised and the maximum number of shares sold will be those needed to cover the cost of the options and any tax obligations. with the remainder locked up as per the Transaction.
Q3 2024 Conference Call
A conference call to discuss the Company's Q3 2024 operational and financial results will be held Wednesday, November 13, 2024 at 8:00 a.m. PT / 11:00 a.m. ET . To participate in the conference call, please dial the numbers below.
Date & Time: Wednesday November 13, 2024 at 8:00 a.m. PT / 11:00 a.m. ET
Telephone: North America Toll Free: 1-800-274-8461
Conference ID: SILVER (745837)
Webcast: https://silvercrestmetals.com/investors/presentations/
ABOUT SILVERCREST METALS INC.
SilverCrest is a Canadian precious metals producer headquartered in Vancouver , BC. The Company's principal focus is its Las Chispas Operation in Sonora , Mexico. SilverCrest has an ongoing initiative to increase its asset base by expanding current resources and reserves, acquiring, discovering, and developing high value precious metals projects and ultimately operating multiple silver-gold mines in the Americas. The Company is led by a proven management team in all aspects of the precious metal mining sector, including taking projects through discovery, finance, on time and on budget construction, and production.
Non-GAAP Financial Measures
Management believes that the following non-GAAP financial measures will enable certain investors to better evaluate the Company's performance, liquidity, and ability to generate cash flow. These measures do not have any standardized definition under IFRS, and should not be considered in isolation or as a substitute for measures of performance prepared in accordance with IFRS. Other companies may calculate these measures differently.
Average realized gold and silver price
Average realized gold and silver price per ounce is calculated by dividing the Company's gross revenue from gold or silver sales for the relevant period by the gold or silver ounces sold, respectively. The Company believes the measure is useful in understanding the metal prices realized by the Company throughout the period. The following table reconciles revenue and metal sold during the period with average realized prices:
Three months ended | Nine months ended | |||
2024 | 2023 | 2024 | 2023 | |
Gold revenue | 37,580 | 28,005 | 100,935 | 81,361 |
Gold ounces sold during the period | 15,204 | 14,500 | 44,704 | 42,100 |
Average realized gold price (per oz sold) | $ 2,472 | $ 1,931 | $ 2,258 | $ 1,933 |
Silver revenue | 42,791 | 35,823 | 115,823 | 102,449 |
Silver ounces sold during the period | 1,451,493 | 1,530,000 | 4,299,493 | 4,341,000 |
Average realized silver price (per oz sold) | $ 29.48 | $ 23.41 | $ 26.94 | $ 23.60 |
Capital expenditures
Capital expenditures are classified into sustaining capital expenditures or non-sustaining capital expenditures depending on the nature of the expenditure. Sustaining capital expenditures are those required to support current production levels. Non-sustaining capital expenditures represent the capital spending at new projects and major, discrete projects at existing operations intended to increase production or extend mine life. Management believes this to be a useful indicator of the purpose of capital expenditures and this distinction is an input into the calculation of AISC.
The following table reconciles payments for mineral properties, plant and equipment, and equipment leases to sustaining and non-sustaining capital expenditures:
Three months ended | Nine months ended | |||
2024 | 2023 | 2024 | 2023 | |
Payments for mineral properties, plant and equipment | $ 10,449 | $ 13,081 | $ 44,797 | $ 33,930 |
Payments for equipment leases | 37 | 11 | 84 | 82 |
Total capital expenditures | 10,486 | 13,092 | 44,881 | 34,012 |
Less: Non-sustaining capital expenditures | (2,543) | (3,256) | (11,455) | (8,892) |
Sustaining capital expenditures | $ 7,943 | $ 9,836 | $ 33,426 | $ 25,120 |
Free cash flow
Free cash flow subtracts sustaining capital expenditures from net cash provided by operating activities, serving as a valuable indicator of our capacity to generate cash from operations post-sustaining capital investments. The following table reconciles this non-GAAP financial measure to the most directly comparable IFRS measure:
Three months ended | Nine months ended | |||
2024 | 2023 | 2024 | 2023 | |
Operating cash flow (1) | $ 44,166 | $ 43,801 | $ 82,618 | $ 122,165 |
Less: sustaining capital expenditures | (7,943) | (9,836) | (33,426) | (25,120) |
Free cash flow | $ 36,223 | $ 33,965 | $ 49,192 | $ 97,045 |
Free cash flow per share (basic) | $ 0.24 | $ 0.23 | $ 0.33 | $ 0.66 |
Weighted average shares outstanding (basic) | 148,585 | 146,776 | 147,759 | 147,067 |
(1) | For the three and nine months ended September 30, 2024, operating cash flow has been adjusted to include $0.1 million and $1.7 million, respectively, in interest paid and $0.7 million and $2.8 million, respectively, in interest received which was previously presented in financing and investing activities, respectively. |
Working capital
Working capital is calculated as current assets less current liabilities. The Company uses working capital as a measure of the Company's operational efficiency and short-term financial health.
Operating margin
Operating margin is calculated as mine operating earnings divided by revenue. The Company uses Operating Margin as a measure of the Company's profitability. The following table reconciles this non-GAAP financial measure to the most directly comparable IFRS Accounting Standard measure:
Three months ended | Nine months ended | |||
2024 | 2023 | 2024 | 2023 | |
Revenue | $ 80,371 | $ 63,828 | $ 216,758 | $ 183,810 |
Mine operating earnings | 47,033 | 37,460 | 125,998 | 111,359 |
Operating margin | 59 % | 59 % | 58 % | 61 % |
Operating cash flow before change in working capital
The Company uses operating cash flow before change in working capital to determine the Company's ability to generate cash flow from operations, and is calculated by adding back the change in working capital to operating cash flow as reported in the consolidated statements of cash flows.
Three months ended | Nine months ended | |||
2024 | 2023 | 2024 | 2023 | |
Operating cash flow (1) | $ 44,166 | $ 43,801 | $ 82,618 | $ 122,165 |
Less: change in working capital | (6,394) | (4,268) | 4,539 | (4,106) |
Operating cash flow before change in working capital | $ 37,772 | $ 39,533 | $ 87,157 | $ 118,059 |
Operating cash flow per share (basic) | $ 0.30 | $ 0.30 | $ 0.56 | $ 0.83 |
Operating cash flow before change in working capital per share (basic) | $ 0.25 | $ 0.27 | $ 0.59 | $ 0.80 |
Weighted average shares outstanding (basic) | 148,585 | 146,776 | 147,759 | 147,067 |
(1) | For the three and nine months ended September 30, 2024, operating cash flow has been adjusted to include $0.1 million and $1.7 million, respectively, in interest paid and $0.7 million and $2.8 million, respectively, in interest received which was previously presented in financing and investing activities, respectively. |
Treasury assets
SilverCrest calculates treasury assets as cash and cash equivalents plus bullion as reported in the consolidated statements of financial position. Management believes that treasury assets provide a useful measure of the Company's most liquid assets that can be used to settle short-term obligations or provide liquidity. Treasury assets are calculated as follows:
September 30 | December 31 | |
Cash and cash equivalents | $ 120,864 | $ 85,964 |
Bullion | 37,374 | 19,191 |
Treasury assets | $ 158,238 | $ 105,155 |
Cash costs
Cash costs include production costs, and government royalties. Management uses this measure to monitor the performance of its mining operation and ability to generate positive cash flow on a site basis.
AISC
All-in sustaining costs, a non-GAAP financial measure, starts with cash costs and includes general and administrative costs, reclamation accretion expense and sustaining capital expenditures. Management uses this measure to monitor the performance of its mining operation and ability to generate positive cash flow on an overall company basis.
Cash costs and AISC are calculated as follows:
Three months ended | Nine months ended | |||
2024 | 2023 | 2024 | 2023 | |
Production costs | $ 23,153 | $ 19,728 | $ 64,036 | $ 56,168 |
Government royalties | 404 | 319 | 980 | 927 |
Total cash costs (1) | 23,557 | 20,047 | 65,016 | 57,095 |
General and administrative expenses | 4,885 | 2,808 | 15,017 | 9,222 |
Reclamation accretion expense | 126 | 132 | 402 | 355 |
Sustaining capital expenditures | 7,943 | 9,836 | 33,426 | 25,120 |
Total AISC | $ 36,511 | $ 32,823 | $ 113,861 | $ 91,792 |
Silver equivalent ounces sold (koz) | 2,660 | 2,683 | 7,854 | 7,688 |
Cash costs (per AgEq sold) | $ 8.85 | $ 7.47 | $ 8.28 | $ 7.43 |
AISC (per AgEq sold) | $ 13.72 | $ 12.23 | $ 14.50 | $ 11.94 |
(1) | 2023 Figures have been recast to align with the current period's presentation. For the three and nine months ended September 30, 2024, cash costs increased by $2.5 million and $4.7 million, respectively, from the exclusion of adjustments for corporate salaries and other expenses, and changes in inventories. |
Adjusted earnings
Adjusted earnings and adjusted basic earnings per share (collectively, "Adjusted Earnings") are presented to remove items that are unrelated to ongoing operations. These metrics do not have a standardized definition under IFRS Accounting Standards and should not be considered as a substitute for results prepared in accordance with IFRS Accounting Standards. Other companies may calculate Adjusted Earnings differently. Adjusted Earnings excludes the tax-effected impact of transaction and integration costs, unrealized gains and losses on foreign currency derivative contracts, gains or losses from the disposal of mineral properties, plant and equipment, and deferred taxes.
Three months ended | Nine months ended | Three months ended | |||
2024 | 2023 | 2024 | 2023 | 2024 | |
Net earnings | $ 9,508 | $ 29,936 | $ 49,866 | $ 80,803 | $ 6,494 |
Increase (decrease) due to: | |||||
Transaction and integration costs | 3,435 | — | 3,435 | — | — |
Unrealized losses on foreign currency derivative contracts | 4,218 | — | 7,732 | — | 4,062 |
Mineral properties, plant and equipment gains | — | — | (20) | — | (20) |
Current tax effect from adjusting items | (380) | — | (380) | — | — |
Deferred tax (recovery) expense | 9,503 | (1,389) | 28,306 | 1,998 | 14,335 |
Adjusted earnings | 26,284 | 28,547 | 88,939 | 82,801 | 24,871 |
Weighted average shares outstanding (in 000's) Basic | 148,585 | 146,776 | 147,759 | 147,067 | 147,728 |
Adjusted basic earnings per share | $ 0.18 | $ 0.19 | $ 0.60 | $ 0.56 | $ 0.17 |
Forward-Looking Statements
This news release contains "forward-looking statements" and "forward-looking information" (collectively "forward-looking statements") within the meaning of applicable Canadian and United States securities legislation. These include, without limitation, statements with respect to: the proposed Transaction, including the terms of the Transaction, anticipated completion of the Transaction, the receipt of required approvals, and the satisfaction of closing conditions; the Company's 2024 guidance and outlook; the amount of future production of gold and silver over any period; the strategic plans and expectations for the Company's operation, exploration program and ESG related projects; working capital requirements; expected recoveries; expected cash costs and outflows, Au and Ag prices and currency exchange rates. Such forward-looking statements or information are based on a number of assumptions, which may prove to be incorrect. Assumptions have been made regarding, among other things: present and future business strategies; continued commercial operations at the Las Chispas Operation; the environment in which the Company will operate in the future, including the price of gold and silver; estimates of capital and operating costs; production estimates; estimates of mineral resources, mineral reserves and metallurgical recoveries and mining operational risk; the reliability of mineral resource and mineral reserve estimates; mining and development costs; the conditions in general economic and financial markets; availability of skilled labour; timing and amount of expenditures related to exploration programs; and effects of regulation by governmental agencies and changes in Mexican mining legislation. The actual results could differ materially from those anticipated in these forward-looking statements as a result of risk factors including: the timing and content of work programs; results of exploration activities; the interpretation of drilling results and other geological data; receipt, maintenance and security of permits and mineral property titles; environmental and other regulatory risks; project cost overruns or unanticipated costs and expenses; fluctuations in gold and silver prices and currency exchange rates; and general market and industry conditions. Forward-looking statements are based on the expectations and opinions of the Company's management on the date the statements are made. The assumptions used in the preparation of such statements, although considered reasonable at the time of preparation, may prove to be imprecise and, as such, readers are cautioned not to place undue reliance on these forward-looking statements, which speak only as of the date the statements were made. The Company undertakes no obligation to update or revise any forward-looking statements included in this news release if these beliefs, estimates and opinions or other circumstances should change, except as otherwise required by applicable law.
Qualified Persons Statement
The Qualified Person under National Instrument 43-101 Standards of Disclosure for Mineral Projects for this news release is N. Eric Fier , CPG, P.Eng, CEO for SilverCrest, who has reviewed and approved its contents.
View original content to download multimedia: https://www.prnewswire.com/news-releases/silvercrest-reports-third-quarter-2024-financial-results-302303369.html
SOURCE SilverCrest Metals Inc.
View original content to download multimedia: http://www.newswire.ca/en/releases/archive/November2024/12/c0577.html
News Provided by Canada Newswire via QuoteMedia
Silver47 Commences Trading on the TSXV
Silver47 Exploration Corp. (TSXV: AGA) ("Silver47" or the "Company), is pleased to announce the commencement of trading on the TSX Venture Exchange (the "TSXV") under the new symbol "AGA", effective at the open of trading on November 14, 2024.
Silver47's listing on the TSXV marks a major milestone for the Company as it advances its strategy to continue to develop its exploration projects, including its flagship Red Mountain VMS project located in central Alaska, USA. The Red Mountain VMS project is detailed in the technical report titled "Technical Report on the Red Mountain VMS Property, Bonnifield Mining District, Alaska, USA" commissioned by the Company and completed by Apex Geoscience Ltd. and has been filed on the Company's SEDAR+ profile at www.sedarplus.caand is available on the Company's website www.silver47.ca. Additional information about the Company can be found in Silver47's long form prospectus dated October 25, 2024 available at www.sedarplus.ca.
Gary R. Thompson, Chief Executive Officer, commented: "We are excited to bring Silver47 to the market at a time when silver and gold prices have made tremendous moves higher this year. Silver47 is well positioned to capitalize on this rising demand trend in metals. The objective of the Company is to rapidly grow its resource base toward a milestone development decision while generating new discoveries."
This news release does not constitute an offer to sell or a solicitation of an offer to buy any of the securities in the United States. The securities have not been and will not be registered under the United States Securities Act of 1933, as amended (the "U.S. Securities Act") or any state securities laws and may not be offered or sold within the United States unless registered under the U.S. Securities Act and applicable state securities laws or an exemption from such registration is available.
About Silver47 Exploration Corp.
Silver47 is a Canadian exploration company focused on advancing its mining projects. Silver47 wholly-owns three exploration projects: the flagship Red Mountain VMS silver-zinc-lead-copper-gold project located in south central Alaska, USA; the Adams Plateau silver-zinc-lead-copper Project located in southern British Columbia; and the Michelle silver-lead-zinc-gallium-antimony Project located in the Yukon Territory. For more information about Silver47, please visit our website at www.silver47.ca.
On Behalf of the Board of Directors
Mr. Gary R. Thompson, Director and CEO
info@silver47.ca
No securities regulatory authority has either approved or disapproved of the contents of this release. Neither the TSXV nor its Regulation Services Provider (as that term is defined in the policies of the TSXV) accepts responsibility for the adequacy or accuracy of this release.
FORWARD-LOOKING STATEMENTS
Information set forth in this news release may involve forward-looking statements under applicable securities laws. Forward-looking statements are statements that relate to future, not past, events. In this context, forward-looking statements often address expected future business and financial performance, and often contain words such as "anticipate", "believe", "plan", "estimate", "expect", and "intend", statements that an action or event "may", "might", "could", "should", or "will" be taken or occur, including statements relating to the Company, its future plans and strategy relating to its properties or other similar expressions, the market for gold and silver and the Company's ability to capitalize on same, the Company's objectives, and all statements, other than statements of historical fact included herein including, without limitation, statements regarding the securities herein. By their nature, forward-looking statements involve known and unknown risks, uncertainties and other factors which may cause our actual results, performance or achievements, or other future events, to be materially different from any future results, performance or achievements expressed or implied by such forward-looking statements. Such factors include, among others, the following risks: the need for additional financing; operational risks associated with mineral exploration; regulatory risks; fluctuations in commodity prices; title matters; and the additional risks identified in the Company's disclosure filed under its issuer profile on SEDAR+ or other reports and filings with the TSXV and applicable Canadian securities regulators. Forward-looking statements are made based on management's beliefs, estimates and opinions on the date that statements are made and the Company undertakes no obligation to update forward-looking statements if these beliefs, estimates and opinions or other circumstances should change, except as required by applicable securities laws. Investors are cautioned against attributing undue certainty to forward-looking statements.
MAG Silver Reports Third Quarter Financial Results
MAG Silver Corp. (TSX NYSE American: MAG) ("MAG", or the "Company") announces the Company's unaudited consolidated financial results for the three months ended September 30, 2024 ("Q3 2024"). For details of the unaudited condensed interim consolidated financial statements of the Company for the three and nine months ended September 30, 2024 ("Q3 2024 Financial Statements") and management's discussion and analysis for the three and nine months ended September 30, 2024 ("Q3 2024 MD&A"), please see the Company's filings on the System for Electronic Document Analysis and Retrieval Plus ("SEDAR+") at ( www.sedarplus.ca ) or on the Electronic Data Gathering, Analysis, and Retrieval ("EDGAR") at ( www.sec.gov ).
All amounts herein are reported in $000s of United States dollars ("US$") unless otherwise specified (C$ refers to thousands of Canadian dollars).
KEY HIGHLIGHTS FOR Q3 2024 (on a 100% basis unless otherwise noted)
- MAG reported net income of $22,292 ($0.22 per share) driven by income from Juanicipio (equity accounted) of $25,552, and adjusted EBITDA 1 (as defined herein) of $55,720.
- A total of 332,290 tonnes of ore at a silver head grade of 481 grams per tonne ("g/t") (equivalent silver head grade 2 735 g/t) was processed at Juanicipio.
- Juanicipio achieved silver production and equivalent silver production 2 of 4.9 and 7.1 million ounces, respectively.
- Juanicipio generated strong operating cash flow of $109,836 and free cash flow 1 of $96,948.
- Building on the robust cost performance of the first half of 2024, Juanicipio continued to improve delivering negative cash cost 1 of $0.12 per silver ounce sold ($8.38 per equivalent silver ounce sold 3 ) and all-in sustaining cost 1 of $3.28 per silver ounce sold ($10.83 per equivalent silver ounce sold 3 ).
- With continued operational outperformance, as reported by Fresnillo, silver grades are expected to be at the top end of the revised grade guidance range (420g/t to 460g/t) for 2024.
- Juanicipio returned a total of $22,649 in interest and loan principal repayments to MAG further augmenting MAG's cash position to $113,491 at the end of the quarter.
CORPORATE
- The Company published its 2023 sustainability report on July 18, 2024, underscoring its continued commitment to transparency with its stakeholders while providing a comprehensive overview of the Company's environmental, social and governance ("ESG") performance for 2023. A copy of MAG's 2023 sustainability report and 2023 ESG Data Table are available on the Company's website at https://magsilver.com/esg/reports 4 .
- On September 20, 2024, MAG and Apollo Silver Corp. ("Apollo") entered into an exploration, earn-in and option agreement (the "Option") pursuant to which Apollo has the option to acquire the Cinco de Mayo Project ("Cinco"). In order for Apollo to exercise the Option, Apollo is required to obtain the necessary licensing to access and conduct exploration activities on Cinco, and subsequently complete no less than 20,000 metres of drilling, all within a five-year period, and then finally issue consideration shares equivalent to 19.9% of the then issued and outstanding common shares of Apollo to MAG.
EXPLORATION
- Juanicipio:
- Underground infill drilling at Juanicipio continued in Q3 2024, primarily focused on upgrading mineralization in areas expected to be mined in the near to mid-term. During Q3 2024, 8,248 metres were drilled from underground. Results to date (mainly first half of 2024) focus on infill and confirm vein continuity including grade and thicknesses.
- Surface drilling started in April 2024 and is currently focused on the Cañada-Honda structure with three rigs turning. Since the beginning of the program, nine holes have been completed, with three in progress. During Q3 2024, 9,768 metres were drilled from surface.
- Results from three holes are showing thin mineralized epithermal veins with vein textures and negligible base metals consistent with being at high level and possibly above a productive boiling zone. Some holes were drilled deep enough to intercept the Juanicipio vein previous deepest holes including a 0.7 metre, base metal rich intercept extending the Juanicipio vein by 450 metres downdip.
- Deer Trail Project, Utah:
- During Q3 2024, 1,745 metres have been drilled from surface. During the first nine months of the year, three holes have been completed, two at Carrisa and one in the Deer Trail Mine Corridor. One hole is currently in progress at Carissa.
- Larder Project, Ontario:
- Surface drilling at Twist, Swansea, Long Conglomerate and Kir Vit, totalled 12,661 metres in Q3 2024. Targets tested include:
- the central and western portions of the Twist zone;
- a large induced polarization ("IP") target at Swansea that coincides with the recent drill program results and historic green carbonate altered komatiite horizons believed to be a second order splay off the Cadillac-Larder Break ("CLB") at the Swansea zone;
- an approximately 4km long conglomerate zone (which runs through the central portion of the property), that is a second order structure coincident with a parallel unconformity; and
- the southeast extensions of the Kir Vit zone with four high priority geophysical targets to test in 2024.
- Regional and field programs at the recently acquired Goldstake property led to outcrop stripping programs that discovered high grade gold values in both channel and grab samples at the T trench, including 32.1 g/t gold, 16.7 g/t gold, and 14.8 g/t gold.
- Surface drilling at Twist, Swansea, Long Conglomerate and Kir Vit, totalled 12,661 metres in Q3 2024. Targets tested include:
_________________________________
1 Adjusted EBITDA, cash cost per ounce, all-in sustaining cost per ounce and free cash flow are non-IFRS measures, please see below " Non-IFRS Measures " section and section 12 of the Q3 2024 MD&A for a detailed reconciliation of these measures to the Q3 2024 Financial Statements.
2 Equivalent silver head grade and equivalent silver production have been calculated using the following price assumptions to translate gold, lead and zinc to "equivalent" silver head grade and "equivalent" silver production: $23/oz silver, $1,950/oz gold, $0.95/lb lead and $1.15/lb zinc.
3 Equivalent silver ounces sold have been calculated using realized prices to translate gold, lead and zinc to "equivalent" silver ounces sold (metal quantity, multiplied by metal price, divided by silver price). Three months ended September 30, 2024 realized prices: $30.16/oz silver, $2,587.65/oz gold, $0.91/lb lead and $1.29/lb zinc.
4 Information contained in or otherwise accessible through the Company's website, including the 2023 sustainability report and 2023 ESG Data Table, do not form part of this publication and are not incorporated into this publication by reference.
JUANICIPIO RESULTS
All results of Juanicipio in this section are on a 100% basis, unless otherwise noted.
Operating Performance
The following table and subsequent discussion provide a summary of the operating performance of Juanicipio for the three months ended September 30, 2024 and 2023, unless otherwise noted.
Key mine performance data of Juanicipio (100% basis) | Three months ended | |||
September 30, | September 30, | |||
2024 | 2023 | |||
Metres developed (m) | 3,278 | 4,105 | ||
Material mined (t) | 331,194 | 297,575 | ||
Material processed (t) | 332,290 | 322,249 | ||
Silver head grade (g/t) | 481 | 523 | ||
Gold head grade (g/t) | 1.32 | 1.32 | ||
Lead head grade (%) | 1.58 | % | 1.33 | % |
Zinc head grade (%) | 2.83 | % | 2.25 | % |
Equivalent silver head grade (g/t) (1) | 735 | 760 | ||
Silver ounces sold (koz) | 4,462 | 4,289 | ||
Gold ounces sold (koz) | 9.12 | 7.76 | ||
Lead pounds sold (klb) | 9,984 | 7,603 | ||
Zinc pounds sold (klb) | 15,426 | 9,596 | ||
Equivalent silver ounces sold (koz) (2) | 6,204 | 5,710 | ||
(1) | Equivalent silver head grades have been calculated using the following price assumptions to translate gold, lead and zinc to "equivalent" silver head grade in 2024: $23/oz silver, $1,950/oz gold, $0.95/lb lead and $1.15/lb zinc (2023: $21.85/oz silver, $1,775/oz gold, $0.915/lb lead and $1.30/lb zinc). |
(2) | Equivalent silver ounces sold have been calculated using realized prices to translate gold, lead and zinc to "equivalent" silver ounces sold (metal quantity, multiplied by metal price, divided by silver price). Three months ended September 30, 2024 realized prices: $30.16/oz silver, $2,587.65/oz gold, $0.91/lb lead and $1.29/lb zinc (three months ended September 30, 2023 realized prices: $23.51/oz silver, $1,911.99/oz gold, $1.00/lb lead and $1.15/lb zinc). |
During the three months ended September 30, 2024, a total of 331,194 tonnes of ore were mined. This represents an increase of 11% over Q3 2023. Increases in mined tonnages at Juanicipio have been driven by the operational ramp-up of the mine towards steady state mining and milling targets.
During the three months ended September 30, 2024, a total of 332,290 tonnes of ore were processed through the Juanicipio plant. The 3% increase over Q3 2023 was mainly attributable to the Juanicipio plant operating at nameplate per operating day during 2024.
The silver head grade and equivalent silver head grade for the ore processed in the three months ended September 30, 2024 was 481 g/t and 735 g/t, respectively (three months ended September 30, 2023: 523 g/t and 760 g/t, respectively). The higher silver head grade and lower lead and zinc head grades in Q3 2023 were the result of processing ore from the upper levels of the mine, characterized by higher silver grade, compared to deeper areas in Q3 2024. Silver metallurgical recovery during the three months ended September 30, 2024 was 95% (three months ended September 30, 2023: 88%) reflecting the commencement of commercial pyrite and gravimetric concentrate production during Q2 2024 delivering incremental silver and gold recovery paired with ongoing optimizations in the processing plant.
The following table provides a summary of the total cash costs and all-in sustaining costs ("AISC") of Juanicipio for the three months ended September 30, 2024, and 2023.
Key mine performance data of Juanicipio (100% basis) | Three months ended | |||
September 30, | September 30, | |||
2024 | 2023 | |||
Total cash costs (1) | (555 | ) | 20,067 | |
Cash cost per silver ounce sold ($/oz) (1) | (0.12 | ) | 4.68 | |
Cash cost per equivalent silver ounce sold ($/oz) (1) | 8.38 | 9.37 | ||
All-in sustaining costs (1) | 14,631 | 39,411 | ||
All-in sustaining cost per silver ounce sold ($/oz) (1) | 3.28 | 9.19 | ||
All-in sustaining cost per equivalent silver ounce sold ($/oz) (1) | 10.83 | 12.75 | ||
(1) | Total cash costs, cash cost per ounce, cash cost per equivalent ounce, all-in sustaining costs, all-in sustaining cost per ounce, and all-in sustaining cost per equivalent ounce are non-IFRS measures, please see below "Non-IFRS Measures" section and section 12 of the Q3 2024 MD&A for a detailed reconciliation of these measures to the Q3 2024 Financial Statements. Equivalent silver ounces sold have been calculated using realized prices to translate gold, lead and zinc to "equivalent" silver ounces sold (metal quantity, multiplied by metal price, divided by silver price). Three months ended September 30, 2024 realized prices: $30.16/oz silver, $2,587.65/oz gold, $0.91/lb lead and $1.29/lb zinc (three months ended September 30, 2023 realized prices: $23.51/oz silver, $1,911.99/oz gold, $1.00/lb lead and $1.15/lb zinc). |
Financial Results
The following table presents excerpts of the financial results of Juanicipio for the three months ended September 30, 2024 and 2023.
Three months ended | ||||
September 30, | September 30, | |||
2024 | 2023 | |||
$ | $ | |||
Sales | 176,393 | 125,046 | ||
Cost of sales: | ||||
Production cost | (38,596 | ) | (43,782 | ) |
Depreciation and amortization | (23,440 | ) | (21,646 | ) |
Gross profit | 114,357 | 59,618 | ||
Consulting and administrative expenses | (2,497 | ) | (3,458 | ) |
Extraordinary mining and other duties | (2,810 | ) | (1,635 | ) |
Interest expense | (1,839 | ) | (5,214 | ) |
Exchange gains (losses) and other | 1,961 | 420 | ||
Net income before tax | 109,172 | 49,731 | ||
Income tax expense | (52,937 | ) | (23,824 | ) |
Net income (100% basis) | 56,235 | 25,907 | ||
MAG's 44% portion of net income | 24,743 | 11,399 | ||
Interest on Juanicipio loans - MAG's 44% | 809 | 2,293 | ||
MAG's 44% equity income | 25,552 | 13,692 |
Sales increased by $51,348 during the three months ended September 30, 2024, mainly due to 26% higher realized metal prices and 13% higher metal volumes.
Production costs decreased by $5,186 due to Juanicipio depleting higher-cost stockpiles in Q3 2023 ($2,085), resulting from the operational ramp-up and processing facility commissioning in the first half of 2023, and lower mining, milling and general and administrative expenses ("G&A expenses") ($3,101).
Depreciation increased by $1,794 impacted by an increased depreciable asset cost base as the Juanicipio mill achieved commercial production and commenced depreciating the processing facility and associated equipment in June 2023. In addition, Juanicipio processed 3% more tonnes during Q3 2024, impacting units of production depreciation.
Cash operating margin increased from 65% to 78%, mainly due to positive commodity price movements, reduced operating costs, as well as operational leverage.
Other expenses decreased by $4,701 mainly as a result of lower consulting and administrative expenses ($960), higher exchange gains ($1,542) and lower interest expense ($3,375) as Juanicipio reduced its outstanding shareholder loans balance by $223,192 ($206,712 loan repayments and $16,480 converted to equity) over the course of September 2023 to September 2024, offset by higher selling costs and other duties ($1,176) which were impacted by the commencement of commercial pyrite and gravimetric concentrate production during Q2 2024.
Taxes increased by $29,113 mainly due to higher taxable profits generated during Q3 2024, as well as non-cash deferred tax charges on fixed assets driven by a weakening in the Mexican peso versus the US dollar.
Gross Profit from Ore Processed at Juanicipio Plant (100% basis)
Three Months Ended September 30, 2024 (332,290 tonnes processed) | Three Months Ended September 30, 2023 Amount $ | |||||||
Metals Sold | Quantity | Average Price $ | Amount $ | |||||
Silver | 4,461,644 ounces | 30.16 per oz | 134,580 | 100,841 | ||||
Gold | 9,118 ounces | 2,588 per oz | 23,594 | 14,839 | ||||
Lead | 4,529 tonnes | 0.91 per lb. | 9,067 | 7,571 | ||||
Zinc | 6,997 tonnes | 1.29 per lb. | 19,885 | 11,005 | ||||
Treatment, refining, and other processing costs ( 1 ) | (10,733 | ) | (9,211 | ) | ||||
Sales | 176,393 | 125,046 | ||||||
Production cost | (38,596 | ) | (43,782 | ) | ||||
Depreciation and amortization | (23,440 | ) | (24,646 | ) | ||||
Gross Profit | 114,357 | 59,618 |
(1) | Q3 2023 includes toll milling costs from processing mineralized material at the Saucito plant. |
Sales and treatment charges are recorded on a provisional basis and are adjusted based on final assay and pricing adjustments in accordance with the offtake contracts.
MAG FINANCIAL RESULTS – THREE MONTHS ENDED SEPTEMBER 30, 2024
As at September 30, 2024, MAG had working capital of $113,657 (December 31, 2023: $67,262) including cash of $113,491 (December 31, 2023: $68,707) and no long-term debt. As well, as at September 30, 2024, Juanicipio had working capital of $187,234 including cash of $96,782 (MAG's attributable share is 44%).
The Company's net income for the three months ended September 30, 2024 amounted to $22,292 (September 30, 2023: $8,862) or $0.22/share (September 30, 2023: $0.09/share). MAG recorded its 44% income from equity accounted investment in Juanicipio of $25,552 (September 30, 2023: $13,692) which included MAG's 44% share of net income from operations as well as loan interest earned on loans advanced to Juanicipio (see above for a discussion of MAG's share of income from its equity accounted investment in Juanicipio).
For the three months ended | ||||
September 30, | September 30, | |||
2024 | 2023 | |||
$ | $ | |||
Income from equity accounted investment in Juanicipio | 25,552 | 13,692 | ||
General and administrative expenses | (3,529 | ) | (4,094 | ) |
General exploration and business development | (138 | ) | (468 | ) |
Operating Income | 21,885 | 9,130 | ||
Interest income | 1,336 | 663 | ||
Other income | 533 | 269 | ||
Financing costs | (211 | ) | - | |
Foreign exchange loss | (41 | ) | (192 | ) |
Income before income tax | 23,502 | 9,870 | ||
Deferred income tax expense | (1,210 | ) | (1,008 | ) |
Net income | 22,292 | 8,862 |
NON-IFRS MEASURES
The following table provides a reconciliation of cash cost per silver ounce of Juanicipio to production cost of Juanicipio on a 100% basis (the nearest IFRS measure) as presented in the notes to the Q3 2024 Financial Statements.
Three months ended September 30, | ||||
(in thousands of US$, except per ounce amounts) | 2024 | 2023 | ||
Production cost as reported | 38,596 | 43,782 | ||
Depreciation on inventory movements | (147 | ) | (1,145 | ) |
Adjusted production cost | 38,448 | 42,637 | ||
Treatment, refining, and other processing costs | 10,733 | 9,211 | ||
By-product revenues (2) | (52,546 | ) | (33,415 | ) |
Extraordinary mining and other duties | 2,810 | 1,635 | ||
Total cash costs (1) | (555 | ) | 20,067 | |
Add back by-product revenues (2) | 52,546 | 33,415 | ||
Total cash costs for equivalent silver (1) | 51,992 | 53,482 | ||
Silver ounces sold | 4,461,644 | 4,288,747 | ||
Equivalent silver ounces sold (3) | 6,203,678 | 5,709,900 | ||
Cash cost per silver ounce sold ($/ounce) | (0.12 | ) | 4.68 | |
Cash cost per equivalent silver ounce sold ($/ounce) | 8.38 | 9.37 |
(1) | As Q3 2023 represented the first full quarter of commercial production, information presented for total cash costs and total cash costs for equivalent silver together with their associated per unit values are not directly comparable. |
(2) | By-product revenues relate to the sale of other metals namely gold, lead, and zinc. |
(3) | Equivalent silver ounces sold have been calculated using realized prices to translate gold, lead and zinc to "equivalent" silver ounces sold (metal quantity, multiplied by metal price, divided by silver price). Three months ended September 30, 2024 realized prices: $30.16/oz silver, $2,587.65/oz gold, $0.91/lb lead and $1.29/lb zinc (three months ended September 30, 2023 realized prices: $23.51/oz silver, $1,911.99/oz gold, $1.00/lb lead and $1.15/lb zinc). |
The following table provides a reconciliation of AISC of Juanicipio to production cost and various operating expenses of Juanicipio on a 100% basis (the nearest IFRS measure), as presented in the notes to the Q3 2024 Financial Statements.
Three months ended September 30, | ||||
(in thousands of US$, except per ounce amounts) | 2024 | 2023 | ||
Total cash costs | (555 | ) | 20,067 | |
General and administrative expenses | 2,497 | 3,458 | ||
Exploration | 2,728 | 2,059 | ||
Sustaining capital expenditures | 9,676 | 13,604 | ||
Sustaining lease payments | 232 | 174 | ||
Interest on lease liabilities | (13 | ) | (15 | ) |
Accretion on closure and reclamation costs | 66 | 64 | ||
All-in sustaining costs (1) | 14,631 | 39,411 | ||
Add back by-product revenues (2) | 52,546 | 33,415 | ||
All-in sustaining costs for equivalent silver (1) | 67,177 | 72,827 | ||
Silver ounces sold | 4,461,644 | 4,288,747 | ||
Equivalent silver ounces sold (3) | 6,203,678 | 5,709,900 | ||
All-in sustaining cost per silver ounce sold ($/ounce) | 3.28 | 9.19 | ||
All-in sustaining cost per equivalent silver ounce sold ($/ounce) | 10.83 | 12.75 | ||
Average realized price per silver ounce sold ($/ounce) | 30.16 | 23.51 | ||
All-in sustaining margin ($/ounce) | 26.88 | 14.32 | ||
All-in sustaining margin ($/equivalent ounce) | 19.34 | 10.76 | ||
All-in sustaining margin | 119,949 | 61,430 |
(1) | As Q3 2023 represented the first full quarter of commercial production, information presented for all-in sustaining costs, all-in sustaining costs for equivalent silver, and all-in sustaining margin together with their associated per unit values are not directly comparable. |
(2) | By-product revenues relate to the sale of other metals namely gold, lead, and zinc. |
(3) | Equivalent silver ounces sold have been calculated using realized prices to translate gold, lead and zinc to "equivalent" silver ounces sold (metal quantity, multiplied by metal price, divided by silver price). Three months ended September 30, 2024 realized prices: $30.16/oz silver, $2,587.65/oz gold, $0.91/lb lead and $1.29/lb zinc (three months ended September 30, 2023 realized prices: $23.51/oz silver, $1,911.99/oz gold, $1.00/lb lead and $1.15/lb zinc). |
For the three months ended September 30, 2024 the Company incurred corporate G&A expenses of $3,429 (three months ended September 30, 2023: $3,961), which exclude depreciation expense.
The Company's attributable silver ounces sold and equivalent silver ounces sold for the three months ended September 30, 2024 were 1,963,123 and 2,729,618 respectively (three months ended September 30, 2023: 1,887,049 and 2,512,356 respectively), resulting in additional all‐in sustaining cost for the Company of $1.75/oz and $1.26/oz respectively (three months ended September 30, 2023: $2.10/oz and $1.58/oz respectively), in addition to Juanicipio's all-in-sustaining costs presented in the above table.
The following table provides a reconciliation of EBITDA and Adjusted EBITDA attributable to the Company based on its economic interest in Juanicipio to net income (the nearest IFRS measure) of the Company per the Q3 2024 Financial Statements. All adjustments are shown net of estimated income tax.
Three months ended September 30, | ||||
(in thousands of US$) | 2024 | 2023 | ||
Net income after tax | 22,292 | 8,862 | ||
Add back (deduct): | ||||
Taxes | 1,210 | 1,008 | ||
Depreciation and depletion | 100 | 133 | ||
Finance costs (income and expenses) | (1,617 | ) | (740 | ) |
EBITDA (1) | 21,985 | 9,263 | ||
Add back (deduct): | ||||
Adjustment for non-cash share-based compensation | 991 | 822 | ||
Share of net earnings related to Juanicipio | (25,552 | ) | (13,692 | ) |
MAG attributable interest in Junicipio Adjusted EBITDA | 58,296 | 33,527 | ||
Adjusted EBITDA (1) | 55,720 | 29,920 |
(1) | As Q3 2023 represents the first full quarter of commercial production, information presented for EBITDA and Adjusted EBITDA is not directly comparable. |
The following table provides a reconciliation of free cash flow of Juanicipio to its cash flow from operating activities on a 100% basis (the nearest IFRS measure), as presented in the notes to the Q3 2024 Financial Statements.
Three months ended September 30, | ||||
(in thousands of US$) | 2024 | 2023 | ||
Cash flow from operating activities | 109,836 | 57,271 | ||
Less: | ||||
Cash flow used in investing activities | (12,656 | ) | (16,524 | ) |
Sustaining lease payments | (232 | ) | (174 | ) |
Juanicipio free cash flow (1) | 96,948 | 40,573 |
(1) | As Q3 2023 represents the first full quarter of commercial production, comparative information presented for free cash flow of Juanicipio is not directly comparable. |
Qualified Persons: All scientific or technical information in this press release including assay results referred to, mineral resource estimates and mineralization, if applicable, is based upon information prepared by or under the supervision of, or has been approved by Gary Methven, P.Eng., Vice President, Technical Services and Lyle Hansen, P.Geo, Geotechnical Director; both are "Qualified Persons" for purposes of National Instrument 43-101, Standards of Disclosure for Mineral Projects .
About MAG Silver Corp.
MAG Silver Corp. is a growth-oriented Canadian mining and exploration company focused on advancing high-grade, district scale precious metals projects in the Americas. MAG is emerging as a top-tier primary silver mining company through its (44%) joint venture interest in the 4,000 tonnes per day Juanicipio Mine, operated by Fresnillo plc (56%). The mine is located in the Fresnillo Silver Trend in Mexico, the world's premier silver mining camp, where in addition to underground mine production and processing of high-grade mineralised material, an expanded exploration program is in place targeting multiple highly prospective targets. MAG is also executing multi-phase exploration programs at the 100% earn-in Deer Trail Project in Utah and the 100% owned Larder Project, located in the historically prolific Abitibi region of Canada.
Neither the Toronto Stock Exchange nor the NYSE American has reviewed or accepted responsibility for the accuracy or adequacy of this press release, which has been prepared by management.
Certain information contained in this release, including any information relating to MAG's future oriented financial information, are "forward-looking information" and "forward-looking statements" within the meaning of applicable Canadian and United States securities legislation (collectively herein referred as "forward-looking statements"), including the "safe harbour" provisions of provincial securities legislation, the U.S. Private Securities Litigation Reform Act of 1995, Section 21E of the U.S. Securities Exchange Act of 1934, as amended and Section 27A of the U.S. Securities Act. Such forward-looking statements include, but are not limited to:
- statements that address maintaining the nameplate 4,000 tpd milling rate at Juanicipio;
- statements that address our expectations regarding exploration and drilling;
- statements regarding production expectations and nameplate;
- statements regarding the Apollo Option and activities at Cinco;
- statements regarding additional information from future drill programs;
- estimated project economics, including but not limited to, plant or mill recoveries, metals produced, metal grades, metals sold, underground mining rates;
- estimated future exploration and development operations and corresponding expenditures and other expenses for specific operations;
- the expected capital, sustaining capital and working capital requirements at Juanicipio, including the potential for additional cash calls;
- expected upside from additional exploration;
- expected results from Deer Trail Project and Carissa zones drilling;
- expected results from Larder Project at the Fernland, Cheminis, Bear, Swansea, Long Conglomerate, Kir Vit, and Twist zones and other regional targets;
- expected capital requirements and sources of funding;
- the Company's ability to repatriate capital form the Juanicipio Mine, obtain financing through the joint venturing of projects and raise additional debt, equity or other sources of financing;
- the Company's participation in equity investments;
- statements regarding the Company's ability to meet business objectives and milestones;
- statements regarding the 2023 sustainability report, including the contents therein; and
- other future events or developments.
When used in this release, any statements that express or involve discussions with respect to predictions, beliefs, plans, projections, objectives, assumptions or future events of performance (often but not always using words or phrases such as "anticipate", "believe", "estimate", "expect", "intend", "plan", "strategy", "goals", "objectives", "project", "potential" or variations thereof or stating that certain actions, events, or results "may", "could", "would", "might" or "will" be taken, occur or be achieved, or the negative of any of these terms and similar expressions), as they relate to the Company or management, are intended to identify forward-looking statements. Such statements reflect the Company's current views with respect to future events and are subject to certain known and unknown risks, uncertainties and assumptions.
Forward-looking statements are necessarily based upon estimates and assumptions, which are inherently subject to significant business, economic and competitive uncertainties and contingencies, many of which are beyond the Company's control and many of which, regarding future business decisions, are subject to change. Assumptions underlying the Company's expectations regarding forward-looking statements contained in this release include, among others: MAG's ability to carry on its various exploration and development activities including project development timelines, the timely receipt of required approvals and permits, the price of the minerals produced, the costs of operating, exploration and development expenditures, the impact on operations of the Mexican tax and legal regimes, MAG's ability to obtain adequate financing, outbreaks or threat of an outbreak of a virus or other contagions or epidemic disease will be adequately responded to locally, nationally, regionally and internationally.
Although MAG believes the expectations expressed in such forward-looking statements are based on reasonable assumptions, such statements are not guarantees of future performance and actual results or developments may differ materially from those in the forward-looking statements. These forward-looking statements involve known and unknown risks, uncertainties and many factors could cause actual results, performance or achievements to be materially different from any future results, performance or achievements that may be expressed or implied by such forward-looking statements including amongst others: commodities prices; changes in expected mineral production performance; unexpected increases in capital costs or cost overruns; exploitation and exploration results; continued availability of capital and financing; general economic, market or business conditions; risks relating to the Company's business operations; risks relating to the financing of the Company's business operations; risks related to the Company's ability to comply with restrictive covenants and maintain financial covenants pursuant to the terms of the Credit Facility; the expected use of the Credit Facility; risks relating to the development of Juanicipio and the minority interest investment in the same; risks relating to the Company's property titles; risks related to receipt of required regulatory approvals; pandemic risks; supply chain constraints and general costs escalation in the current inflationary environment heightened by the invasion of Ukraine by Russia and the events relating to the Israel-Hamas war; risks relating to the Company's financial and other instruments; operational risk; environmental risk; political risk; currency risk; market risk; capital cost inflation risk; risk relating to construction delays; the risk that data is incomplete or inaccurate; the risks relating to the limitations and assumptions within drilling, engineering and socio-economic studies relied upon in preparing economic assessments and estimates, including the updated Technical Report filed on March 27, 2024; as well as those risks more particularly described under the heading "Risk Factors" in the Company's Annual Information Form dated March 27, 2024 available under the Company's profile on SEDAR+ at www.sedarplus.ca .
Should one or more of these risks or uncertainties materialize, or should underlying assumptions prove incorrect, actual results may vary materially from those described herein. This list is not exhaustive of the factors that may affect any of the Company's forward-looking statements. The Company's forward-looking statements are based on the beliefs, expectations and opinions of management on the date the statements are made and, other than as required by applicable securities laws, the Company does not assume any obligation to update forward-looking statements if circumstances or management's beliefs, expectations or opinions should change. For the reasons set forth above, investors should not attribute undue certainty to or place undue reliance on forward-looking statements.
Please Note: Investors are urged to consider closely the disclosures in MAG's annual and quarterly reports and other public filings, accessible through the Internet at www.sedarplus.ca and www.sec.gov .
LEI: 254900LGL904N7F3EL14
For further information on behalf of MAG Silver Corp., please contact Fausto Di Trapani, Chief Financial Officer. Phone: (604) 630-1399 Toll Free: (866) 630-1399 Email: info@magsilver.com
News Provided by GlobeNewswire via QuoteMedia
Pan American Silver Releases Quarterly Results, Gets Canada's Approval for La Arena Sale
Pan American Silver (TSX:PAAS,NASDAQ:PAAS) said on Tuesday (November 5) that it has received final regulatory approval from the Canadian government for the sale of its La Arena assets in Peru.
The company is selling the La Arena gold mine and development-stage La Arena II copper-gold project to Jinteng (Singapore) Mining, a subsidiary of Zijin Mining Group (OTC Pink:ZIJMF,HKEX:2899).
Under the terms of the deal, Zijin will pay US$245 million in cash for the properties. Pan American will also receive a 1.5 percent life-of-mine net smelter return royalty on gold production from La Arena II.
The agreement further provides a US$50 million contingent payment to Pan American once La Arena II starts commercial production. Pan American will also enter an offtake agreement with Zijin through which it will gain access to 60 percent of future copper concentrate supply from La Arena II on commercial terms for sale in North America.
The finalization of the La Arena sale is expected by the end of 2024.
Also on Tuesday, Pan American released its latest quarterly report, outlining record free cashflow of US$151.5 million.
President and CEO Michael Steinmann said higher silver and gold prices improved the company's operating margins during the period, noting that it is positioned to meet its 2024 production guidance. Pan American estimates it will produce between 21 million and 23 million ounces of silver and 880,000 to 1 million ounces of gold this year.
Steinmann also noted continued strength in production and cost management across various projects.
He noted that at the La Colorada mine in Mexico, new ventilation infrastructure led to a 59 percent increase in silver production and a 26 percent reduction in cash costs from the previous quarter.
Total throughput is expected to reach 2,000 metric tons per day by year end.
During Q3, the company directed an additional US$3.6 million in capital to the La Colorada skarn project, focusing on further exploration and completion of a ventilation system to support production scalability.
Regarding the Escobal mine in Guatemala, Pan American indicated it is still unclear when operations may resume.
The mine, which is one of the world’s largest silver deposits, has been inactive since 2017 due to a pending consultation process with the Xinka indigenous community. This process, governed by Guatemala’s constitutional court under International Labor Organization Convention 169, has experienced delays, and a new timeline has not been set.
Recently, the country’s energy and mines ministry appointed a deputy minister of sustainable development to oversee the consultation, but no significant progress has been reported.
The suspension at Escobal has limited Pan American’s production capabilities. The site previously produced approximately 20 million ounces of silver annually before the stoppage.
As it awaits an outcome, Pan American is keeping the property on care and maintenance.
Don’t forget to follow us @INN_Resource for real-time updates!
Securities Disclosure: I, Giann Liguid, hold no direct investment interest in any company mentioned in this article.
First Majestic Announces Financial Results for Q3 2024 and Quarterly Dividend Payment
First Majestic Silver Corp. (NYSE: AG) (TSX: AG) (FSE: FMV) (the "Company" or "First Majestic") is pleased to announce the Company's unaudited condensed interim consolidated financial results for the third quarter ended September 30, 2024. The full version of the financial statements and the accompanying management's discussion and analysis can be viewed on the Company's website at www.firstmajestic.com or on SEDAR+ at www.sedarplus.ca and on EDGAR at www.sec.govedgar. All amounts are in U.S. dollars unless stated otherwise.
THIRD QUARTER HIGHLIGHTS
Increased Production: The Company produced 5.5 million silver equivalent ("AgEq") ounces, a 4% increase when compared to Q2 2024, consisting of 1,967,574 silver ("Ag") ounces and 41,761 gold ("Au") ounces.
Increased Revenue: In the third quarter of 2024, the Company generated revenues of $146.1 million, a 10% increase compared to $133.2 million in the third quarter of 2023. This was primarily attributed to higher average realized silver prices, partially offset by a decrease in payable AgEq ounces sold primarily due to lower production levels at San Dimas and higher inventory levels held at First Mint at the end of the third quarter.
Built Inventory: The Company held 767,386 silver ounces in finished goods inventory as of September 30, 2024, inclusive of coins and bullion. The fair value of this inventory (which is not included in the third quarter revenues as of September 30, 2024) if sold, would have added $23.8 million in revenues.
Improved Mine Operating Earnings: The Company realized mine operating earnings of $28.5 million compared to $13.0 million in the third quarter of 2023, representing an increase of 119%. The increase in consolidated mine operating earnings was primarily attributed to a 67% increase in operating earnings at Santa Elena when compared to the third quarter of 2023, driven by higher average realized silver prices in Q3 2024.
Increased Cash Flow from Operations: Operating cash flow before changes in working capital and taxes in the quarter was $39.8 million compared to $14.1 million in the third quarter of 2023. This was primarily driven by a $15.5 million increase in mine operating earnings, a $6.4 million reduction in restructuring costs related to workforce optimization and a $1.0 million reduction in general and administrative expenses compared to the third quarter of 2023.
Improved Earnings Before Income Tax, Depreciation and Amortization ("EBITDA"): EBITDA for the quarter was $36.9 million compared to $11.5 million in the third quarter of 2023. The increase in EBITDA was primarily attributable to the increase in mine operating earnings and lower restructuring costs compared to the third quarter of 2023.
Strengthened Cash Position and Liquidity: The Company ended the quarter with a strong cash and cash equivalents position of $154.7 million compared to $138.3 million in the third quarter of 2023, while working capital increased to $238.2 million compared to $197.8 million in the third quarter of 2023. Cash and cash equivalents exclude an additional $103.9 million that is held in restricted cash.
Improved Cash Cost: Consolidated cash cost of $15.17 per AgEq ounce for the quarter represented a 1% improvement from $15.29 per AgEq ounce in the previous quarter. The decrease in cash costs was primarily attributable to the continued strong performance and increase in gold production at Santa Elena and San Dimas, along with the softening of the Mexican peso which averaged 10% weaker than the prior quarter. This was partially offset by an increase in royalty payments due to higher silver and gold prices, and a decrease in production at La Encantada due to the limited water supply, which was resolved by quarter end, partially offset by an increase in silver recoveries.
Decreased All-in Sustaining Cost ("AISC"): Consolidated AISC in the third quarter was $21.03 per AgEq ounce, representing a 3% decrease from $21.64 per AgEq ounce in the previous quarter. This was primarily attributable to lower cash costs along with lower worker participation costs.
Improved Sustainability Score: First Majestic achieved a score of 37 in the S&P Global Corporate Sustainability Assessment ("CSA") published on October 31, 2024, a 32% improvement over our 2023 performance. Our 2024 score places the Company in the top third of the mining and metals industry. Improvements were equally reflected across all three categories of the CSA - Environmental, Social, and Governance & Economic. The assessment noted significant improvements in First Majestic's Risk & Crisis Management, Business Ethics, IT Security, Water Management, Human Rights and Labour Practices.
Acquisition of Gatos Silver, Inc. ("Gatos"): On September 5, 2024, the Company announced that it had entered into a definitive agreement (the "Merger Agreement") to acquire all of the issued and outstanding shares of Gatos common stock pursuant to a merger under Delaware law (the "Merger"). The Merger is expected to close in early 2025, subject to the satisfaction of customary closing conditions, including approvals of the shareholders of First Majestic and Gatos, clearance under Mexican anti-trust laws, and approval of the listing of the First Majestic common shares to be issued under the Merger on both the TSX and the NYSE. The Merger Agreement has been unanimously approved by the board of directors of each of First Majestic and Gatos, and in the case of Gatos, on the unanimous recommendation of a special committee of independent directors of Gatos.
Third Quarter Dividend: Declared a cash dividend of $0.0048 per common share for the third quarter of 2024 for shareholders of record as of the close of business on November 15, 2024, to be paid out on or about November 29, 2024.
OPERATIONAL AND FINANCIAL HIGHLIGHTS
Key Performance Metrics | 2024-Q3 | 2024-Q2 | Change Q3 vs Q2 | 2023-Q3 | Change Q3 vs Q3 | |||||||||||||
Operational | ||||||||||||||||||
Ore Processed / Tonnes Milled | 678,397 | 674,570 | 1% | 670,203 | 1% | |||||||||||||
Silver Ounces Produced | 1,967,574 | 2,104,181 | (6%) | 2,461,868 | (20%) | |||||||||||||
Gold Ounces Produced | 41,761 | 39,339 | 6% | 46,720 | (11%) | |||||||||||||
Silver Equivalent ("AgEq) Ounces Produced | 5,490,416 | 5,289,439 | 4% | 6,285,790 | (13%) | |||||||||||||
Cash Costs per Silver Equivalent Ounce(1) | $ | 15.17 | $ | 15.29 | (1%) | $ | 14.13 | 7% | ||||||||||
All-in Sustaining Cost per Silver Equivalent Ounce(1) | $ | 21.03 | $ | 21.64 | (3%) | $ | 19.74 | 6% | ||||||||||
Total Production Cost per Tonne(1) | $ | 109.81 | $ | 113.16 | (3%) | $ | 125.81 | (13%) | ||||||||||
Average Realized Silver Price per Silver Equivalent Ounce(1) | $ | 29.84 | $ | 27.81 | 7% | $ | 22.41 | 33% | ||||||||||
Financial (in $millions) | ||||||||||||||||||
Revenues | $ | 146.1 | $ | 136.2 | 7% | $ | 133.2 | 10% | ||||||||||
Mine Operating Earnings | $ | 28.5 | $ | 15.5 | 84% | $ | 13.0 | 119% | ||||||||||
Net Loss | ($26.6 | ) | ($48.3 | ) | 45% | ($27.1 | ) | 2% | ||||||||||
Operating Cash Flows before Non-Cash Working Capital and Taxes | $ | 39.8 | $ | 23.8 | 67% | $ | 14.1 | 181% | ||||||||||
Capital Expenditures | $ | 34.7 | $ | 28.3 | 23% | $ | 32.2 | 8% | ||||||||||
Cash and Cash Equivalents | $ | 154.7 | $ | 152.2 | 2% | $ | 138.3 | 12% | ||||||||||
Restricted Cash | $ | 103.9 | $ | 117.5 | (12%) | $ | 119.0 | (13%) | ||||||||||
Working Capital(1) | $ | 238.2 | $ | 229.9 | 4% | $ | 197.8 | 20% | ||||||||||
Earnings before Interest, Tax, Depreciation and Amortization(1) | $ | 36.9 | $ | 21.6 | 71% | $ | 11.5 | NM | ||||||||||
Adjusted EBITDA(1) | $ | 39.8 | $ | 26.8 | 49% | $ | 24.0 | 66% | ||||||||||
Free Cash Flow(1) | $ | 31.3 | $ | 6.4 | NM | $ | 6.4 | NM | ||||||||||
Shareholders | ||||||||||||||||||
Loss per Share ("EPS") - Basic | ($0.09 | ) | ($0.17 | ) | 47% | ($0.09 | ) | 0% | ||||||||||
Adjusted EPS(1) | ($0.03 | ) | ($0.07 | ) | 57% | ($0.04 | ) | 21% | ||||||||||
|
(1) The Company reports certain non-GAAP measures which include cash costs per AgEq ounce produced, cash costs per Au ounce produced, AISC per AgEq ounce produced, AISC per Au ounce produced, total production cost per tonne, average realized silver price per AgEq ounce sold, average realized Au price per ounce sold, working capital, adjusted EPS, EBITDA, adjusted EBITDA, and free cash flow. These measures are widely used in the mining industry as a benchmark for performance, but do not have a standardized meaning under the Company's financial reporting framework, and the methods used by the Company to calculate such measures may differ from methods used by other companies with similar descriptions. See "Non-GAAP Measures" below for further details of these measures.
THIRD QUARTER FINANCIAL RESULTS
The Company ended the quarter with a strong cash and cash equivalents position of $154.7 million compared to $138.3 million in the third quarter of 2023, while working capital increased to $238.2 million compared to $197.8 million in the third quarter of 2023. Cash and cash equivalents exclude an additional $103.9 million that is held in restricted cash.
The Company generated revenues of $146.1 million during the quarter, a 10% increase compared to $133.2 million of revenues generated in the third quarter of 2023. This was primarily attributed to higher average realized silver prices, partially offset by a decrease in payable AgEq ounces sold primarily due to lower production levels at San Dimas and higher inventory levels held at the end of the third quarter of 2024.
The Company realized mine operating earnings of $28.5 million compared to $13.0 million in the third quarter of 2023, representing an increase of 119%. The increase in consolidated mine operating earnings was primarily attributed to a 67% increase in operating earnings at Santa Elena when compared to the third quarter of 2023, driven by higher average realized silver prices in the third quarter of 2024.
EBITDA for the quarter was $36.9 million compared to $11.5 million in the third quarter of 2023. The increase in EBITDA was primarily attributable to the increase in mine operating earnings and lower restructuring costs, related to workforce optimization mainly at San Dimas, compared to the third quarter of 2023.
Adjusted EBITDA, normalized for non-cash or non-recurring items such as share-based payments and unrealized losses on marketable securities for the quarter ended September 30, 2024, was $39.8 million compared to $24.0 million in the third quarter of 2023.
Net loss for the quarter was $26.6 million (EPS of ($0.09)) compared to a net loss of $27.1 million (EPS of ($0.09)) in the third quarter of 2023. Net loss for the quarter includes non-cash foreign exchange loss of $5.8 million (EPS of ($0.02)) and non-cash deferred income tax expense of $13.2 million (EPS of ($0.04)), relating primarily to the weakening of the Mexican peso at the end of the quarter compared to the third quarter of 2023. On September 30, 2024, the Company held $151.4 million of its cash and value added taxes receivable in Mexican pesos (there is a $9.7 million non-cash impact on the Company's reported net earnings or loss per 10% change in the value of the Mexican peso against the U.S. dollar). The slight decrease in net loss was primarily attributed to a $13.0 million increase in mine operating earnings partially offset by a $20.9 million income tax expense increase as compared to the same quarter of the prior year. Q3 2023 was also impacted by non-recurring restructuring efforts and holding costs at La Parrilla along with a one-time loss on the sale of mining interest incurred following the disposition of La Parrilla.
Adjusted net loss, normalized for non-cash or non-recurring items such as share-based payments, unrealized losses on marketable securities, and deferred income tax for the quarter ended September 30, 2024, was $10.5 million (adjusted EPS of ($0.03)) compared to adjusted net loss of $10.9 million (adjusted EPS of ($0.04)) in the third quarter of 2023.
The Company's total capital expenditures in the third quarter of 2024 were $34.7 million (Q3 2023 - $32.2 million) consisting of $13.8 million for underground development (Q3 2023 - $14.8 million), $14.8 million in exploration (Q3 2023 - $8.1 million), and $6.1 million in property, plant and equipment (Q3 2023 - $9.3 million).
OPERATIONAL HIGHLIGHTS
The table below represents the quarterly operating and cost performance at each of the Company's three producing mines during the quarter.
Third Quarter Production Summary | Santa Elena | San Dimas | La Encantada | Jerritt Canyon(1) | Consolidated |
Ore Processed / Tonnes Milled | 259,919 | 195,279 | 223,200 | - | 678,397 |
Silver Ounces Produced | 376,203 | 1,046,340 | 545,031 | - | 1,967,574 |
Gold Ounces Produced | 27,435 | 12,582 | 59 | 1,684 | 41,761 |
Silver Equivalent Ounces Produced | 2,685,375 | 2,110,905 | 550,042 | 144,093 | 5,490,416 |
Cash Costs per Silver Equivalent Ounce(2) | $11.96 | $16.50 | $25.24 | $17.25 | $15.17 |
AISC per Silver Equivalent Ounce(2) | $14.38 | $21.44 | $30.10 | $17.25 | $21.03 |
Cash Cost per Gold Ounce(2) | N/A | N/A | N/A | $1,491 | N/A |
AISC per Gold Ounce(2) | N/A | N/A | N/A | $1,491 | N/A |
Total Production Cost per Tonne(2) | $107.80 | $168.45 | $60.86 | $- | $109.81 |
(1) Jerritt Canyon was placed on temporary suspension in March 2023. In-circuit recovery efforts performed in Q3 2024 resulted in the production of 1,684 gold ounces.
(2) See "Non-GAAP Financial Measures" below for further details regarding these measures.
The Company produced 5.5 million AgEq ounces, consisting of 1,967,574 Ag ounces and 41,761 Au ounces, a 4% increase when compared to Q2 2024.
Consolidated cash costs of $15.17 per AgEq ounce for the quarter represented a 1% improvement from $15.29 per AgEq ounce in the previous quarter. The decrease in cash costs was primarily attributable to the continued strong performance and increase in gold production at Santa Elena and San Dimas, along with the weakening of the Mexican peso, which averaged 10% weaker than the prior quarter. This was partially offset by a decrease in production at La Encantada due to the limited water supply, which was resolved by quarter end, partially offset by an increase in silver recoveries.
Consolidated AISC in the third quarter was $21.03 per AgEq ounce, representing a 3% decrease from $21.64 per AgEq ounce in the previous quarter. This was primarily attributable to lower cash costs along with lower worker participation costs.
Q3 2024 DIVIDEND ANNOUNCEMENT
The Company is pleased to announce that its Board of Directors has declared a cash dividend in the amount of $0.0048 per common share for the third quarter of 2024. The dividend will be paid to holders of record of First Majestic's common shares as of the close of business on November 15, 2024, and will be paid out on or about November 29, 2024.
Under the Company's dividend policy, the quarterly dividend per common share is targeted to equal approximately 1% of the Company's net quarterly revenues divided by the number of the Company's common shares outstanding on the record date.
The amount and distribution dates of future dividends remain at the discretion of the Board of Directors. This dividend qualifies as an "eligible dividend" for Canadian income tax purposes. Dividends paid to shareholders outside Canada (non-resident investors) may be subject to Canadian non-resident withholding taxes.
ABOUT FIRST MAJESTIC
First Majestic is a publicly traded mining company focused on silver and gold production in Mexico and the United States. The Company presently owns and operates the San Dimas Silver/Gold Mine, the Santa Elena Silver/Gold Mine, and the La Encantada Silver Mine as well as a portfolio of development and exploration assets, including the Jerritt Canyon Gold project located in northeastern Nevada, U.S.A.
First Majestic is proud to own and operate its own minting facility, First Mint, LLC, and to offer a portion of its silver production for sale to the public. Bars, ingots, coins and medallions are available for purchase online at www.firstmint.com, at some of the lowest premiums available.
On September 5, 2024, First Majestic and Gatos Silver, Inc. announced that they entered into a definitive merger agreement pursuant to which First Majestic will acquire all of the issued and outstanding shares of Gatos Silver's common stock. The proposed transaction would consolidate three world-class, producing silver mining districts in Mexico to create a leading intermediate primary silver producer. Information relating to the proposed transaction can be found on the Company's website.
For further information, contact info@firstmajestic.com, visit our website at www.firstmajestic.com or call our toll-free number 1.866.529.2807.
FIRST MAJESTIC SILVER CORP.
"signed"
Keith Neumeyer, President & CEO
Non-GAAP Financial Measures
This news release includes reference to certain financial measures which are not standardized measures under the Company's financial reporting framework. These measures include cash costs per silver equivalent ounce produced, all-in sustaining cost (or "AISC") per silver equivalent ounce produced, cash costs per gold ounce produced, AISC per gold ounce produced, total production cost per tonne, average realized silver price per ounce sold, average realized gold price per ounce sold, working capital, adjusted net earnings and EPS and free cash flow. The Company believes that these measures, together with measures determined in accordance with IFRS, provide investors with an improved ability to evaluate the underlying performance of the Company. These measures are widely used in the mining industry as a benchmark for performance but do not have any standardized meaning prescribed under IFRS, and therefore they may not be comparable to similar measures disclosed by other companies. The data is intended to provide additional information and should not be considered in isolation or as a substitute for measures of performance prepared in accordance with IFRS. For a complete description of how the Company calculates such measures and a reconciliation of certain measures to GAAP terms please see "Non-GAAP Measures" in the Company's most recent management discussion and analysis filed on SEDAR+ at www.sedarplus.ca and EDGAR at www.sec.gov/edgar.
Cautionary Note Regarding Forward Looking Statements
This news release contains "forward‐looking information" and "forward‐looking statements" under applicable Canadian and U.S. securities laws (collectively, "forward‐looking statements"). These statements relate to future events or the Company's future performance, business prospects or opportunities that are based on forecasts of future results, estimates of amounts not yet determinable and assumptions of management made in light of management's experience and perception of historical trends, current conditions and expected future developments. Forward‐looking statements in this news release include, but are not limited to, statements with respect to the timing for the payment of the Company's cash dividend for the second quarter of 2024. Assumptions may prove to be incorrect and actual results may differ materially from those anticipated. Consequently, guidance cannot be guaranteed. As such, investors are cautioned not to place undue reliance upon guidance and forward‐looking statements as there can be no assurance that the plans, assumptions or expectations upon which they are placed will occur. All statements other than statements of historical fact may be forward‐looking statements. Statements concerning proven and probable mineral reserves and mineral resource estimates may also be deemed to constitute forward‐looking statements to the extent that they involve estimates of the mineralization that will be encountered as and if the property is developed, and in the case of measured and indicated mineral resources or proven and probable mineral reserves, such statements reflect the conclusion based on certain assumptions that the mineral deposit can be economically exploited. Any statements that express or involve discussions with respect to predictions, expectations, beliefs, plans, projections, objectives or future events or performance (often, but not always, using words or phrases such as "seek", "anticipate", "plan", "continue", "estimate", "expect", "may", "will", "project", "predict", "forecast", "potential", "target", "intend", "could", "might", "should", "believe" and similar expressions) are not statements of historical fact and may be "forward‐looking statements".
Actual results may vary from forward‐looking statements. Forward‐looking statements are subject to known and unknown risks, uncertainties and other factors that may cause actual results to materially differ from those expressed or implied by such forward‐looking statements, including but not limited to: the duration and effects of the COVID‐19, and any other pandemics on our operations and workforce, and the effects on global economies and society; general economic conditions including inflation risks; actual results of exploration activities; conclusions of economic evaluations; changes in project parameters as plans continue to be refined; commodity prices; variations in ore reserves, grade or recovery rates; availability of sufficient water for operating purposes; actual performance of plant, equipment or processes relative to specifications and expectations; accidents; labour relations; relations with local communities; changes in national or local governments; changes in applicable legislation or application thereof; delays in obtaining approvals or financing or in the completion of development or construction activities; exchange rate fluctuations; requirements for additional capital; government regulation; environmental risks; reclamation expenses; outcomes of pending litigation; limitations on insurance coverage as well as those factors discussed in the section entitled "Description of the Business ‐ Risk Factors" in the Company's most recently filed AIF, available under the Company's profile on SEDAR+ at www.sedarplus.ca, and as an exhibit to the Company's most recently filed Form 40‐F available on EDGAR at www.sec.gov/edgar. Although First Majestic has attempted to identify important factors that could cause actual results to differ materially from those contained in forward‐looking statements, there may be other factors that cause results not to be as anticipated, estimated or intended.
The Company believes that the expectations reflected in these forward-looking statements are reasonable, but no assurance can be given that these expectations will prove to be correct and such forward-looking statements included herein should not be unduly relied upon. These statements speak only as of the date hereof. The Company does not intend, and does not assume any obligation, to update these forward-looking statements, except as required by applicable laws.
To view the source version of this press release, please visit https://www.newsfilecorp.com/release/229141
News Provided by Newsfile via QuoteMedia
Silver47 Exploration: Advancing the “Red Mountain” Silver-Gold Rich VMS Deposit, SEDEX Targets in Alaska
Silver47 Exploration (TSXV:AGA) is a compelling investment story, well-positioned to capitalize on the increasing global demand for silver, gold, copper, zinc, antimony, tin and graphite driven by its vast industrial applications and investment potential. The company wholly owns a diverse portfolio of silver-polymetallic projects across North America, including Red Mountain VMS (Alaska), Adams Plateau (British Columbia) and Michelle (Yukon).
Focused on rapid resource growth and new discoveries, Silver47 is backed by an experienced technical and management team that brings decades of successful experience in mineral exploration. Silver47 has outlined aggressive drill programs to rapidly advance its projects toward development.
The Red Mountain VMS project is Silver47's flagship asset located about 100 kilometers south of Fairbanks, Alaska. Red Mountain is a polymetallic VMS deposit, rich in silver, gold, zinc, copper, and lead. Red Mountain holds an NI 43-101 inferred resource of 15.6 million tonnes (Mt) at 7 percent zinc equivalent, or 168.6 Moz of silver equivalent at a grade of 335.7 grams per ton (g/t) silver equivalent. The project is located in a mining-friendly jurisdiction on state managed lands with reasonable access to infrastructure.
Company Highlights
- Silver47 Exploration wholly owns a diverse portfolio of silver-polymetallic projects across North America, including Red Mountain VMS (Alaska), Adams Plateau (British Columbia) and Michelle (Yukon).
- In 2022, Silver47 made a significant new silver discovery at the Michelle project with 7.68m of 1,577 g/t Ag, 45 percent Pb, 4 percent Zn within 15m of 907 g/t Ag, 26 percent Pb, 2.7 percent Zn at the Silver Matt Target, Michelle Project.
- The Red Mountain VMS project currently holds an inferred resource of 168.6 million ounces of silver equivalent, with the “Exploration Target” of 500 to 900 Moz silver equivalent through further exploration.
- The Company’s focus on rapid resource growth and new discoveries for silver, copper, and gold is supported by an extensive number of targets identified across its properties.
- Silver47 is poised to capitalize on increasing global demand for silver, driven by its critical role in industrial applications including solar, Ai and AgZn, AgC batteries and investments.
- A projected silver supply deficit of 240 Moz further strengthens the market outlook.
- Backed by an experienced technical and management team, and led by seasoned geologist and company builder Gary R. Thompson, the team brings decades of successful experience in mineral exploration.
- Aggressive drill programs are planned to rapidly advance its projects toward development.
This Silver47 Exploration profile is part of a paid investor education campaign.*
Click here to connect with Silver47 Exploration (TSXV:AGA) to receive an Investor Presentation
Latest News
Latest Press Releases
Related News
TOP STOCKS
Investing News Network websites or approved third-party tools use cookies. Please refer to the cookie policy for collected data, privacy and GDPR compliance. By continuing to browse the site, you agree to our use of cookies.