The Conversation (0)

Southern Silver Exploration Corp. (TSXV: SSV) ("Southern Silver") reports results from its Preliminary Economic Assessment ('PEA") on its 100% owned Cerro Las Minitas project ("CLM").
PEA Highlights (all figures in $US unless otherwise noted):
The 2024 Preliminary Economic Assessment features:
In comparison to the earlier 2022 economic model, the updated PEA now:
Lawrence Page. K. C. President, said: "This latest economic update of Cerro Las Minitas represents a new milestone in the ongoing evolution and development of the project which is the culmination of a number of smaller technical improvements, developed over the last 18 months, which together result in a significant increase in the value of the Cerro Las Minitas asset. This includes the addition of new mineral resources from the North Felsite zone as first reported in March 2023; the standardization of the metallurgical recoveries and charges across each of the deposits, including the addition of gold revenues into the project cash-flow; improvements in the mine scheduling and optimization both the Operating and Capital costs of the project."
"Since acquisition of the property in 2010 and subsequent identification of the mineral resources, a very profitable and valuable mine has been modelled in the results of the PEA disclosed today. Total acquisition, exploration and development costs are approximately US$28 million and significantly, the property is not burdened with royalties, presenting potential financing opportunities for additional drilling and development work on the property. This presentation of the results of the PEA marks a significant milestone in the development of the property and the best is yet to come."
PEA SUMMARY:
Study support
Cautionary Statement
The PEA is preliminary in nature, it may include mineral resources that are considered too speculative geologically to have the economic considerations applied to them that would enable them to be categorized as mineral reserves, and there is no certainty that the PEA will be realized. Mineral resources that are not mineral reserves have not demonstrated economic viability. The mineral resources may be affected by subsequent assessment of mining, environmental, processing, permitting, taxation, socio-economic, and other factors.
Project Economics
The CLM project demonstrates robust LOM revenues over 17 years of production and after-tax NPV5% of $501M. Total Capital Expenditure for the project is $565M which requires $388M of initial capital expenditure and $177M in sustaining and closure capital. The project payback is 48 months.
Table 1: CLM Project Economics
| Item | Units | Base Case |
| Revenue | US $M | $4,470 |
| EBITDA | US $M | $2,076 |
| LOM pre-tax cash flow | US $M | $1,512 |
| LOM after-tax cash flow | US $M | $923 |
| NPV pre-tax (5% Discount) | US $M | $887 |
| NPV pre-tax (8% Discount) | US $M | $648 |
| NPV pre-tax (10% Discount) | US $M | $525 |
| IRR pre-tax | % | 30.0% |
| NPV after-tax (5% Discount) | US $M | $501 |
| NPV after-tax (8% Discount) | US $M | $340 |
| NPV after-tax (10% Discount) | US $M | $258 |
| IRR After Tax | % | 21.2% |
| Initial Capital Expenditures | US $M | $388 |
| Payback (discounted, after-tax) | months | 48 |
After-Tax, Free Cash Flow
Figure 1 illustrates the estimated annual and cumulative after-tax cash flow over the life-of-mine for both the Base Case (blue) and the Base Case +20% metal values (grey). Mine scheduling targets higher margin mineralization in the first eight years of production resulting in a more aggressive paydown of capital and improved economics with an annual average After-tax Free-cashflow of $107M in the first eight years of production and $78M over the life-of-Mine.
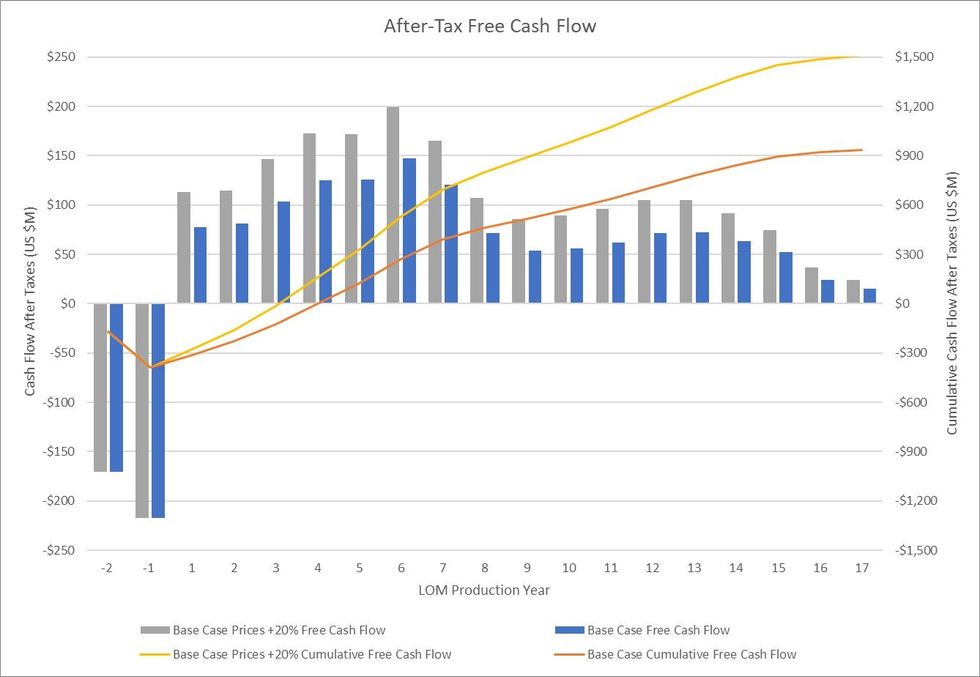 Figure 1: Annual and LOM cashflow
Economic Sensitivities
The Project's gross revenues, NPV5% and IRR shows greatest sensitivity to metal prices.
Table 2: Gross Revenue, NPV5% and IRR sensitivity at base-case +/- 20% and current pricing
| All Metal Price (Ag, Au, Cu, Pb, Zn) Sensitivity | ||||
| Metal Price | Revenue (US$M) | NPV, after tax @ 0% (US$M) | NPV, after tax @ 5% (US$M) | IRR, after Tax |
| Spot | $5,493 | $1,583 | $931 | 31.4% |
| +20% | $5,364 | $1,501 | $876 | 30.1% |
| Base Case | $4,470 | $923 | $501 | 21.2% |
| -20% | $3,576 | $339 | $122 | 9.9% |
Note: Base Case price assumes Ag = $23.00/oz, Au = $1850/oz, Cu = $4.00/lb, Pb = $1.00/lb, Zn = $1.25/lb
"Spot" assumes May 29 2024 prices: Ag = $31.53/oz, Au = $2332/oz, Cu = $4.69/lb, Pb = $1.05/lb, Zn = $1.41/lb
Other factors that may impact the NPV sensitivity include changes in Operating Costs ("OpEx") and Initial Capital. These relative impacts together with changes in silver and zinc prices are shown in Table 3 and Figure 2.
Table 3: NPV sensitivity as a function of select metals prices, recoveries, CapEx and OpEx:
| Sensitivity NPV @ 5%, after Tax (US$M) | ||||||
| Sensitivity | Silver Price | Zinc Price | Silver in Pb Recovery | Zinc Recovery | Initial Capital | OPEX |
| 20% | $665 | $628 | $427 | $351 | ||
| 15% | $624 | $596 | $446 | $388 | ||
| 10% | $583 | $565 | $570 | $533 | $464 | $426 |
| 5% | $542 | $533 | $535 | $523 | $483 | $464 |
| 0% | $501 | $501 | $501 | $501 | $501 | $501 |
| -5% | $460 | $469 | $467 | $479 | $520 | $539 |
| -10% | $419 | $437 | $433 | $457 | $538 | $576 |
| -15% | $378 | $405 | $398 | $435 | $556 | $613 |
| -20% | $337 | $373 | $364 | $413 | $575 | $650 |
Note: +15% and +20% Silver and Zn recoveries are not applicable
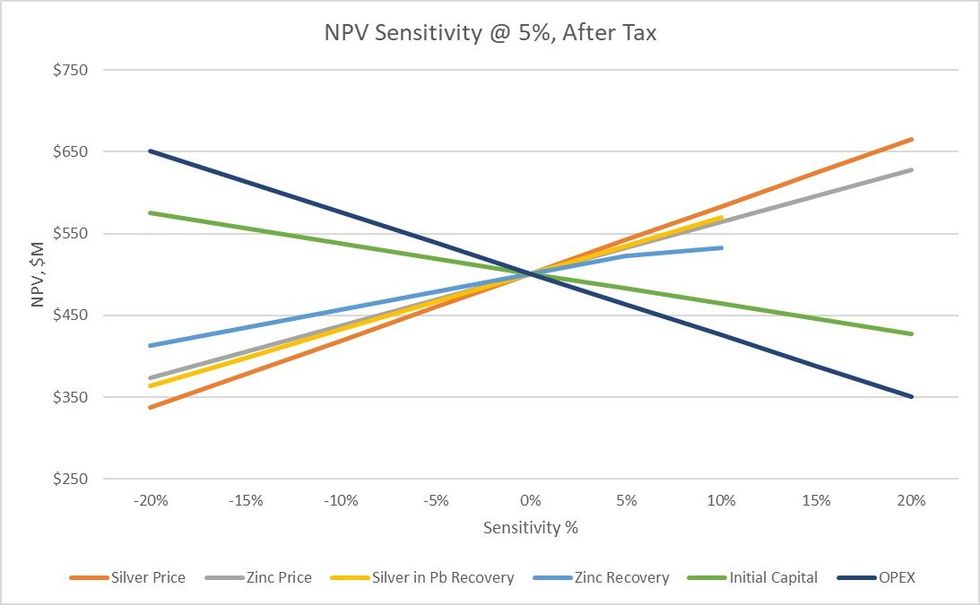 Figure 2: After-tax NPV5% sensitivities
Production and Costs:
Annual mine production is estimated to deliver 14.3 Moz AgEq (includes 5.8 Mozs Ag) to the processing facility averaged over a 17-year period. Potential annual product of sales (net deductions, treatment and refining) averaging 11.4 Moz AgEq (includes 4.9 Mozs Ag).
Peak annual Plant Feed is achieved in Year 6 with 22.3 Mozs AgEq (includes 9.4 Moz Ag) being processed with peak annual product of sales of 18.0 Moz AgEq (includes 7.9 Moz Ag). Table 4 summarizes the estimated metal production from the CLM project.
Table 4: CLM LOM Production and Metal Sales
| Units | Y1-8 | LOM | |
| AgEq Plant Feed (Yearly Average) | (Moz) | 17.9 | 14.3 |
| AgEq Product of Sales (Yearly Average) | (Moz) | 14.4 | 11.4 |
| AgEq Plant Feed (Total) | (Moz) | 143.7 | 243.2 |
| AgEq Product of Sales (Total) | (Moz) | 115.4 | 194.3 |
| All-In Sustaining Cost (AISC) | (US$/AgEq oz) | $12.23 | $13.23 |
| Units | Y1-8 | LOM | |
| Ag Plant Feed (Yearly Average) | (Moz) | 7.6 | 5.8 |
| Ag Product of Sales (Yearly Average) | (Moz) | 6.5 | 4.9 |
| Ag Plant Feed (Total) | (Moz) | 60.8 | 98.6 |
| Ag Product of Sales (Total) | (Moz) | 51.9 | 83.9 |
Note: AgEq was determined assuming contained metal and pricing
Mine Schedule and All-In-Sustaining-Cost (AISC)
Mine scheduling targets higher value silver-lead production in the first 8 years of mine life with lower AgEq grading material (zinc-copper dominant) being targeted in the final 9 years. Total plant feed (mine production) is estimated to be 243.2 Mozs AgEq (includes 98.6 Mozs Ag) with 194.3 Moz AgEq (includes 83.9 Moz Ag) sold. Total all-in sustaining costs ("AISC") are estimated to be $US 2.57B averaging $US13.23/oz AgEq sold. LOM production and AISC are illustrated in Figure 3.
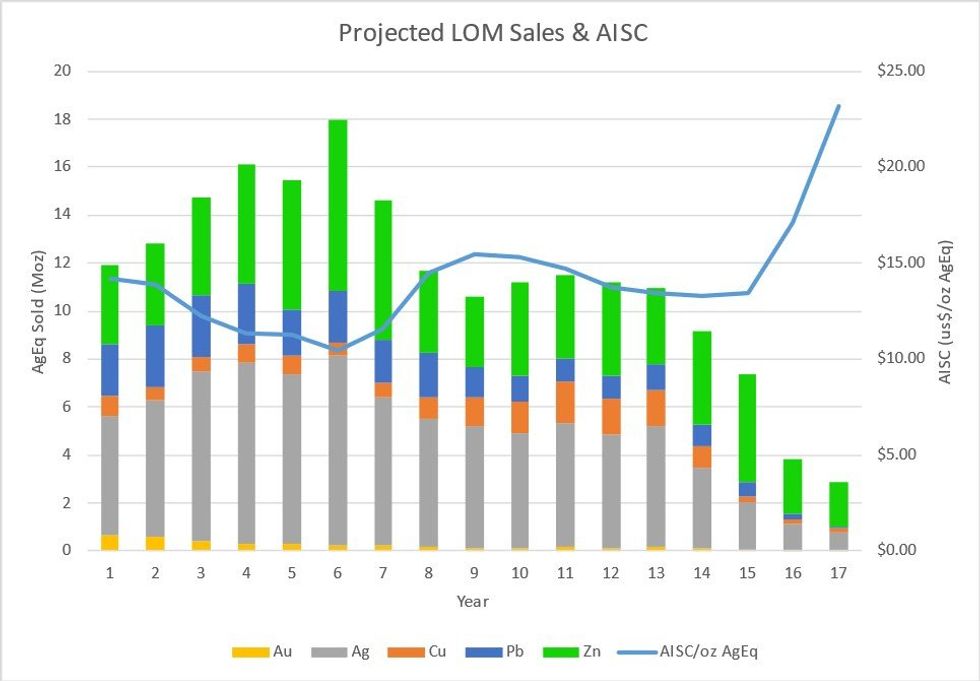 Figure 3: LOM AgEq sales and AISC:
.OPERATIONS:
Mining:
The mine plan was completed by Entech and incorporates longitudinal and transverse longhole stoping methods. Two separate portals are proposed to access the various deposits, with one portal accessing the Blind-El Sol and Skarn Front deposits, and a second portal accessing the La Bocona, South Skarn, and North Felsite deposits. The process in creating the mine plan is further described below:
The grade and average stoping widths are illustrated in Figure 4 and Figure 5 respectively.
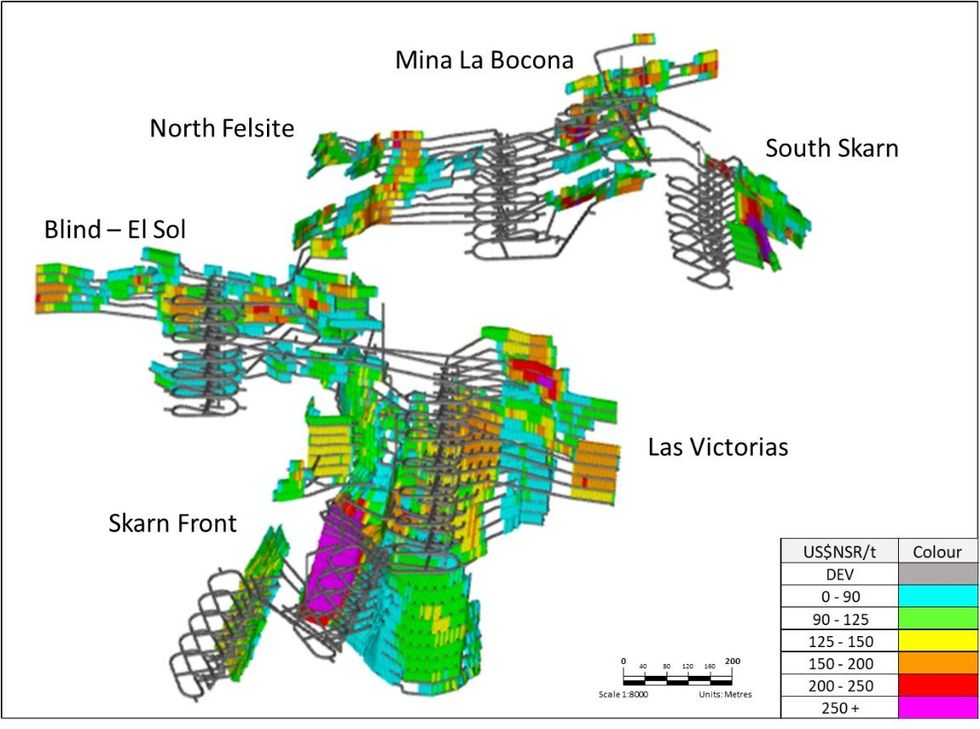 Figure 4: US$NSR/t grade distribution of the Cerro Las Minitas MSO model - looking northeast
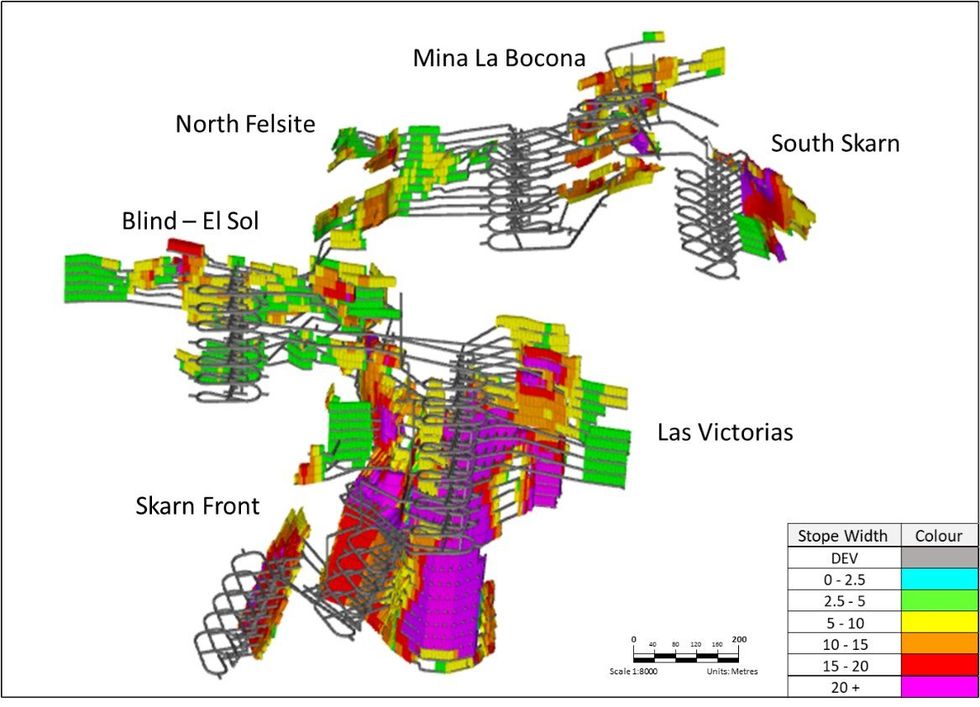 Figure 5: Average Stope Width of the Cerro Las Minitas MSO model - looking northeast
Processing:
The process plant for the PEA study is a conventional sulphide flotation system consisting of:
Head grades:
MSO scheduling successfully prioritized higher grade material to the mill earlier in the mine life resulting in higher heads grades (and associated annual revenue) in the first eight years of production as compared to the final 10 years.
Table 5: Head grade over Yr1-8 and LOM
| HEAD GRADES | Units | Y1-8 Average | LOM |
| Avg. Annual Plant Feed | (kt) | 1,930 | 1,930 |
| Ag | (g/t) | 119 | 104 |
| Au | (g/t) | 0.14 | 0.11 |
| Cu | (%) | 0.15 | 0.19 |
| Pb | (%) | 1.37 | 1.06 |
| Zn | (%) | 2.45 | 2.41 |
| AgEq | (g/t) | 290 | 257 |
Recoveries and Tailings:
CONCENTRATE TERMS:
Metal Payables
The project is expected to produce four saleable concentrates of sufficient quality to be marketable to a variety of global smelters.
Approximately 93% of Ag is recovered with 77 % reporting to the Pb concentrate, 6% to the Cu concentrate, 7% to the Zn concentrate and 3% to the leach circuit.
Table 6: Metal Recoveries established for the PEA
| Item | Pb Conc. | Zn Conc. | Cu Conc. | Dore |
| Pb Recovery | 87% | |||
| Zn Recovery | 93% | |||
| Cu Recovery | 70% | |||
| Ag Recovery | 77% | 7% | 6% | 3% |
| Au Recovery | 20% | 28.6% | ||
| Concentrate Grade (Primary Base Metal) | 65% | 54% | 27% |
Refining and Treatment:
Treatment and refining charges were based on consultation with industry professionals and generated the terms indicated below:
Table 7: Refining and Treatment
| Ag | Au | Cu | Pb | Zn | |
| Cu Concentrate | |||||
| Average Concentrate Grade LOM | 1,266g/t | 4.3g/t | 27% | - | - |
| Payable Metal | 90% | 90% | 97% | - | - |
| Minimum Deduction | - | - | 1 unit | - | - |
| Pb Concentrate | |||||
| Average Concentrate Grade LOM | 5,641g/t | - | - | 65% | - |
| Payable Metal | 95% | - | - | 95% | - |
| Minimum Deduction | 50g/t | - | - | 3 Units | - |
| Zn Concentrate | |||||
| Average Concentrate Grade LOM | 180g/t | - | - | - | 53.50% |
| Payable Metal | 70% | - | - | - | 85% |
| Minimum Deduction | 3oz/t | - | - | - | 8 units |
| Dore | |||||
| Contained kozs | 2,927 | 28.9 | - | - | - |
| Payable Metal | 99% | 100% | - | - | - |
The high Ag grade in the Pb concentrate makes it attractive to smelters and could result in more favourable treatment terms, but these have not been considered at the PEA level. Penalty elements are low, with Cd (in solution with Zn) ($8.9/t conc.) being the major contributor to Zn penalties, and Sb (in solution with Pb) being the major source of Pb penalties ($27/t conc).
Concentrate Transportation:
Transportation costs assume trucking of the concentrate via containers to the international port at Manzanillo, Colima, and then shipping via ocean freight to Asia. Estimated transportation costs (trucking, port handling and ocean freight) are US$96/wmt (wet metric tonnes) for Pb concentrate and US$106/wmt for Zn concentrate. Moisture contents are assumed to be 8.5% based on the grind size of the final concentrates.
CAPITAL EXPENDITURES:
Total initial capital investment in the project is estimated to be $388 million and includes $50 million contingency, which represents the total direct and indirect cost for the development of the project, including associated infrastructure.
Table 8: Capital Expenditure break down.
| Item | Total ($M) |
| Process Plant and Infrastructure | |
| Project Directs including freight | $159.7 |
| Project Indirects | $38.9 |
| Owner Costs | $8.0 |
| Contingency | $50.1 |
| Sub-Total | $257 |
| Mining | |
| Pre-Production Capital Costs | $131 |
| Total Initial Capital Costs | $388 |
| Sustaining Capital and Closure Costs | $177 |
| Total Capital Costs | $565 |
Mining Development Costs:
Mining development costs were developed by Entech considering a mining contractor model. Total capital costs including sustaining capital allocated to mining are approximately $US291M comprising of the following:
Table 9: Mining Capital Breakdown
| Item | Total ($M) |
| Capitalised Operating Expense | 31 |
| Pre-Production Capital Development | 65 |
| Pre-Production Fixed and Mobile Plant | 6 |
| Pre-Production Capital Infrastructure | 28 |
| Pre-Production Surface Infrastructure | 2 |
| Total Pre-Production Mining Capital Costs | 131 |
| Sustaining Capital Development | 114 |
| Sustaining Fixed and Mobile Plant | 25 |
| Sustaining Capital Infrastructure | 22 |
| Total Mining Sustaining Capital Costs | 160 |
| Total Mining Capital Costs | 291 |
Direct costs of $4,211 /m and indirect costs of $1,538 /m.
OPERATING COSTS
Operating costs are broken down into Mining, Processing, G&A and Treatment and Refining costs, plus additional production charges including government royalty, employee profit sharing and closure expenses. Operating costs were developed by Ausenco and Entech (Mine Operating Cost).
Table 10: Operating cost breakdown on a per tonnage basis
| Area | $/t ore processed |
| Mine Operating Cost | $41.22 |
| Process Plant Operating Cost | $15.82 |
| G & A | $4.33 |
| Operating Cost | $61.37 |
| Treatment & Refining Charges | $19.88 |
| Sustaining Capital Costs | $5.43 |
| Closure Cost | $0.56 |
| Other Production Cost | $25.87 |
| Total | $87.24 |
Mining:
The operating costs reflect a contractor mining option which defers capital but utilizes the experience of a contractor for initial construction and development of the mine. Mining considers a modern and large operation using large 21-t loaders and 63-t capable trucks targeting an average daily plant feed of approximately 5,300 tpd and 6,900 tpd when including waste development (peak of 7,800 tpd in production Year 4) as both portals are in production. Mining costs are developed by Entech and are from Entech's cost database which includes pricing from mining contractors.
Table 11: Production and Development Breakdown
| Item | Total ($M) | Total ($/t) |
| Development | $190 | $6.45 |
| Production | $1,024 | $34.77 |
| Total Production and Development Costs | $1,214 | $41.22 |
Operating costs are summarized as follows and are appropriate for a Preliminary Economic Assessment:
Processing and General & Administration costs ("G+A"):
The process plant is a conventional sulphide flotation system consisting of both primary and secondary crushing, a closed-circuit ball mill grinding and sequential Cu-Pb-Zn flotation circuit producing three filtered concentrates for sale. A fourth pyrite concentrate is produced for leaching.
Operating costs are as follows:
Table 12: Breakdown of Process Plant Operating cost
| Operating & Maintenance | $/t ore processed |
| Labor | $1.40 |
| Electrical Power | $4.64 |
| Reagents | $5.04 |
| Liners/Grinding Media | $1.94 |
| Maintenance Parts | $0.95 |
| Supplies and Services | $1.65 |
| Fresh Water Supply | $0.19 |
| Total (US$) | $15.82 |
G&A costs reflect a well-located project in an area of excellent infrastructure and immediately adjacent to the town of Guadalupe Victoria (population: ~35,000).
OPPORTUNITIES:
Mine life extension: Mineralization on the eastern and northern sides of the Cerro remains relatively under-drilled and several gaps occur in the current resource model both at relatively shallow depths and down dip of several of the main higher-grade zones. Identification of further mineralization at relatively shallow depths would potentially add more value in the earliest parts of the mine schedule.
Infill Drilling: Infill drilling, specifically on the portions of the deposit that fall within the Inferred category of classification will increase confidence in the Mineral Resource estimate, will further de-risk the project and potentially increase the value of the project.
Metallurgical Upside: XRT-based preconcentration testwork showed excellent discrimination between sulphide and oxide material enabling a 3-4x upgrade of run-of-mine rock crushed to 80% passing 75mm with the sub-15 mm fines removed. Pay metal retention in the sulphidic fraction exceeded 98%. This option provides an excellent opportunity for further reductions in project Capex and Opex should the need arise.
TECHNICAL DISCLOSURE
APPENDICES
Appendices with the following supporting information is found at the back of this release.
Appendix A: Sulphide Mineral Resource Estimate
Appendix B: Project location and Infrastructure
Appendix C: Simplified Process Flow Sheet
About Southern Silver Exploration Corp.
Southern Silver Exploration Corp. is an exploration and development company with a focus on the discovery of world-class mineral deposits either directly or through joint-venture relationships in mineral properties in major jurisdictions. Our specific emphasis is the 100% owned Cerro Las Minitas silver-lead-zinc project located in the heart of Mexico's Faja de Plata, which hosts multiple world-class mineral deposits such as Penasquito, Los Gatos, San Martin, Naica and Pitarrilla. We have assembled a team of highly experienced technical, operational and transactional professionals to support our exploration efforts in developing the Cerro Las Minitas project into a premier, high-grade, silver-lead-zinc mine. Our property portfolio also includes the Oro porphyry copper-gold project and the Hermanas gold-silver vein project where permitting applications for the conduct of a drill program is underway, both located in southern New Mexico, USA.
On behalf of the Board of Directors
"Lawrence Page"
Lawrence Page, K.C.
President & Director, Southern Silver Exploration Corp.
For further information, please visit Southern Silver's website at https://www.southernsilverexploration.com or contact us 604.641.2759 by email at corpdev@mnxltd.com.
Qualified Person
The PEA for the Cerro Las Minitas project as summarized in this release was completed by Kirkham Geosystems Ltd. ("KGL"), Ausenco Engineering USA South Inc. and Ausenco Sustainability ULC. ("Ausenco"), Entech Mining Limited ("Entech"), and MPC Metallurgical Process Consultants Limited ("MPC"). A full technical report will be prepared in accordance with NI43-101 and will be filed on SEDAR within 45 days of this press release.
The scientific and technical content of this news release was reviewed and approved by Robert Macdonald, MSc. P.Geo, VP. Exploration, who is a Qualified Person as defined by National Instrument 43-101 - Standards of Disclosure for Mineral Projects.
Neither TSX Venture Exchange nor its Regulation Services Provider (as that term is defined in the policies of the TSX Venture Exchange) accepts responsibility for the adequacy or accuracy of this release.
This news release contains forward-looking statements. Forward-looking statements address future events and conditions and therefore involve inherent risks and uncertainties. Actual results may differ materially from those currently anticipated in such statements. Factors that could cause actual results to differ materially from those in forward looking statements include the timing and receipt of government and regulatory approvals, and continued availability of capital and financing and general economic, market or business conditions. Southern Silver Exploration Corp. does not assume any obligation to update or revise its forward-looking statements, whether as a result of new information, future events or otherwise, except to the extent required by applicable law.
Appendix A: Sulphide Mineral Resource Estimate as of March 20, 2024
| Indicated Resources | Average Grade | |||||||
| Zone | Tonnes | Ag | Au | Pb | Zn | Cu | AgEq | NSR |
| (Kt) | (g/t) | (g/t) | (%) | (%) | (%) | (g/t) | (US$/t) | |
| Blind Zone | 2,614 | 92 | 0.04 | 1.8 | 2.0 | 0.10 | 227 | 113 |
| El Sol Zone | 1,252 | 77 | 0.04 | 2.1 | 1.9 | 0.08 | 214 | 106 |
| Skarn Front Zone | 7,626 | 104 | 0.06 | 0.8 | 4.1 | 0.19 | 298 | 143 |
| La Bocona/North Felsite Zone | 1,807 | 121 | 0.19 | 2.1 | 1.5 | 0.23 | 262 | 135 |
| Total | 13,299 | 102 | 0.07 | 1.3 | 3.1 | 0.17 | 272 | 132 |
| Inferred Resources | Average Grade | |||||||
| Zone | Tonnes | Ag | Au | Pb | Zn | Cu | AgEq | NSR |
| (Kt) | (g/t) | (g/t) | (%) | (%) | (%) | (g/t) | (US$/t) | |
| Blind Zone | 1,697 | 74 | 0.20 | 1.2 | 1.8 | 0.08 | 192 | 95 |
| Las Victorias Zone | 1,417 | 124 | 0.65 | 1.9 | 2.2 | 0.12 | 307 | 155 |
| El Sol Zone | 1,168 | 57 | 0.03 | 1.7 | 2.1 | 0.06 | 185 | 90 |
| Skarn Front Zone | 12,444 | 110 | 0.05 | 0.7 | 2.6 | 0.32 | 254 | 126 |
| La Bocona/North Felsite Zone | 2,666 | 120 | 0.22 | 1.4 | 1.6 | 0.13 | 243 | 124 |
| South Skarn Zone | 4,036 | 134 | 0.19 | 1.9 | 1.3 | 0.08 | 250 | 129 |
| Total | 23,428 | 111 | 0.14 | 1.1 | 2.1 | 0.21 | 247 | 124 |
| Indicated Resources | Contained Metal | ||||||
| Zone | Tonnes | Ag TrOz | Au TrOz | Pb | Zn | Cu Lbs | AgEq TrOz |
| (Kt) | (000's) | (000's) | (Mlbs) | (Mlbs) | (Mlbs) | (000's) | |
| Blind Zone | 2,614 | 7,751 | 4 | 106 | 116 | 6 | 19,094 |
| El Sol Zone | 1,252 | 3,102 | 2 | 57 | 54 | 2 | 8,592 |
| Skarn Front Zone | 7,626 | 25,557 | 15 | 128 | 692 | 32 | 73,100 |
| La Bocona/North Felsite Zone | 1,807 | 7,039 | 11 | 82 | 59 | 9 | 15,236 |
| Total | 13,299 | 43,449 | 32 | 374 | 921 | 49 | 116,023 |
| Inferred Resources | Contained Metal | ||||||
| Zone | Tonnes | Ag TrOz | Au TrOz | Pb | Zn | Cu Lbs | AgEq TrOz |
| (Kt) | (000's) | (000's) | (Mlbs) | (Mlbs) | (Mlbs) | (000's) | |
| Blind Zone | 1,697 | 4,029 | 11 | 46 | 66 | 3 | 10,448 |
| El Sol Zone | 1,417 | 5,629 | 30 | 58 | 69 | 4 | 13,993 |
| Las Victorias Zone | 1,168 | 2,150 | 1 | 43 | 53 | 1 | 6,956 |
| Skarn Front Zone | 12,444 | 43,834 | 20 | 180 | 711 | 88 | 101,537 |
| South Skarn Zone | 2,666 | 10,327 | 19 | 85 | 95 | 7 | 21,040 |
| La Bocona/North Felsite Zone | 4,036 | 17,393 | 24 | 170 | 112 | 7 | 32,468 |
| Total | 23,428 | 83,362 | 104 | 582 | 1,106 | 111 | 186,442 |
Model Parameters for the Blind, El Sol, Skarn, South Skarn, Bocona, and North Felsite Zones
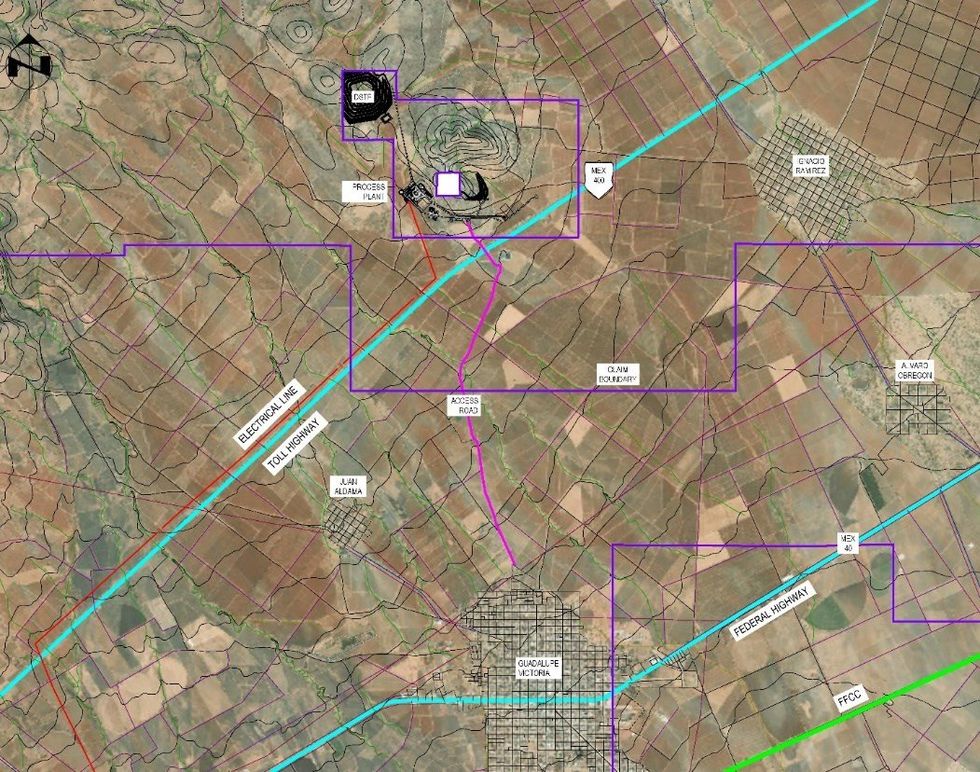 Appendix B: Project Location and Site Infrastructure
The process plant for the PEA study is a conventional sulphide flotation system consisting of both Primary and secondary crushing, a closed-circuit ball mill grinding and sequential Cu-Pb-Zn flotation circuit producing three filtered concentrates for sale. A fourth pyrite concentrate will be produced and leached.
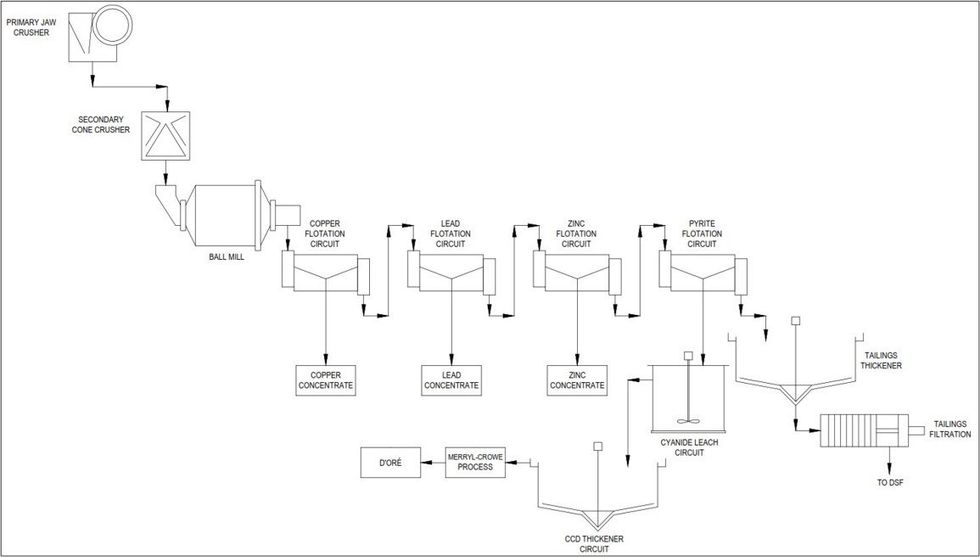 Appendix C: Simplified Process Flow Sheet