
January 12, 2025
Agreement Executed for Acquisition of Majority Interest(1) in Belt-Scale Mt Venn Project
Sarama Resources Ltd. (“Sarama” or the “Company”) (ASX:SRR, TSX- V:SWA) is pleased to advise that it has executed a non-binding Heads of Agreement (the “HoA”) with Orbminco Limited (“Orbminco”) (ASX: OB1), an arm’s length third party, to acquire a majority(1) and controlling interest(1) in the under- explored, belt-scale 420km² Mt Venn Project (the “Project”)(2), located in the Eastern Goldfields of Western Australia.
This follows Sarama’s recent acquisition of a majority interest in the 580km² Cosmo Project, approximately 45km to the west of the Mt Venn Project. Both projects are well-positioned and underexplored, presenting an exciting opportunity for Sarama in the Laverton Gold District which is known for its prolific gold endowment (refer Figure 1).
Highlights
- Non-binding Heads of Agreement executed for acquisition of 80% interest in belt-scale Mt Venn Project
- Located in the prolific Laverton Gold District, 35km from the producing Gruyere Gold Mine and less than 20km from Gold Road’s Golden Highway Deposit
- Project covers 420km² and features a favourable litho-structural setting, primarily in greenstone rocks
- Includes regional shear zone of ~50km strike length and 1-3km width extending full length of greenstone belt
- Advanced gold targets generated through historical exploration, including broad drill-defined gold mineralisation
- Highly complementary to Sarama’s recently acquired, underexplored and prospective Cosmo Project
- Creates 1,000km² exploration position in the Laverton Gold District, capturing 100km of strike length
- Land access agreement with Traditional Owners in place for exploration
- 100% scrip consideration with initial exploration funded by the November 2024 equity raise of A$2M
Sarama’s President, Executive Chairman, Andrew Dinning commented:
“We are very pleased to have reached agreement to acquire the Mt Venn Project and when completed, this acquisition will significantly consolidate our position in the prolific Laverton Gold District of Western Australia. The addition of this project creates a major 1,000km2 area-play which significantly enhances the probability of making the next big discovery in a region that continues to deliver new deposits in previously unexplored areas, including the regionally- significant Gruyere Deposit just 35km east of the Mt Venn Project. We look forward to working towards completing the transaction and will provide updates in due course.”
Mt Venn Project
The Project is comprised of 3 contiguous exploration tenements covering approximately 420km² in the Eastern Goldfields of Western Australia, approximately 110km north-east of Laverton and 35km west of the regionally- significant Gruyere Gold Mine(3). The Project is readily accessible via the Great Central Road which services the regional area east of Laverton.
The Project captures the majority of the underexplored Jutson Rocks Greenstone Belt over a strike length of ~50km. Rocks within the belt feature a diverse sequence of volcanic lithologies of varying composition, together with pyroclastics and metasediments. Several internal intrusive units have been identified throughout the Project and are commonly associated with local structural features. A regionally extensive shear zone, spanning 1-3km in width, extends the entire length of the belt with subordinate splays interpreted in the southern area of the Project which provides a favourable structural setting for mineralisation.
Gold mineralisation was first discovered in the 1920’s with sampling returning very high grades and prompting the commencement of small-scale mining operations in the mid 1920’s. Multiple gold occurrences have since been identified throughout the Project, demonstrating the prospectivity of the system. Despite the identification of several km-scale gold-in-soil anomalies by soil geochemistry and auger drilling, many of these targets are yet to be properly tested. Encouragingly, drilling by Cazaly Resources Limited (“Cazaly”) (ASX: CAZ) at the Project intersected broad, gold mineralisation over several fences in weathered and fresh rock at the Three Bears Prospect, presenting a priority target for exploration (Cazaly news release 27 February 2017: “Widespread Gold & Zinc Mineralisation Defined”).
In addition to the attractiveness of the Project for gold, it is considered prospective for base metals and platinum group elements. Historical exploration work including auger geochemistry and geophysical surveys identified several targets for copper, nickel and zinc mineralisation. Several of these targets remain untested due to historical funding and land access constraints. Exploration in the belt to the immediate south of the Project area is noted to have intersected copper mineralisation of significant grade over a significant strike length(4).
In summary, the Project is located within a prolific gold district and has a favourable lithological and structural setting. A solid database of base-level historical exploration work by previous operators, including generation of drill-ready targets, provides a good platform for Sarama to advance the Project in conjunction with its activities at the Cosmo Project. The size and prospectivity of the landholding that Sarama will have in the Laverton Gold District upon completion of this transaction significantly enhances the chances of making an economic discovery, particularly given the infrastructure and proliferation of mines in the region which will have a favourable impact on the size threshold for finding something of economic value.
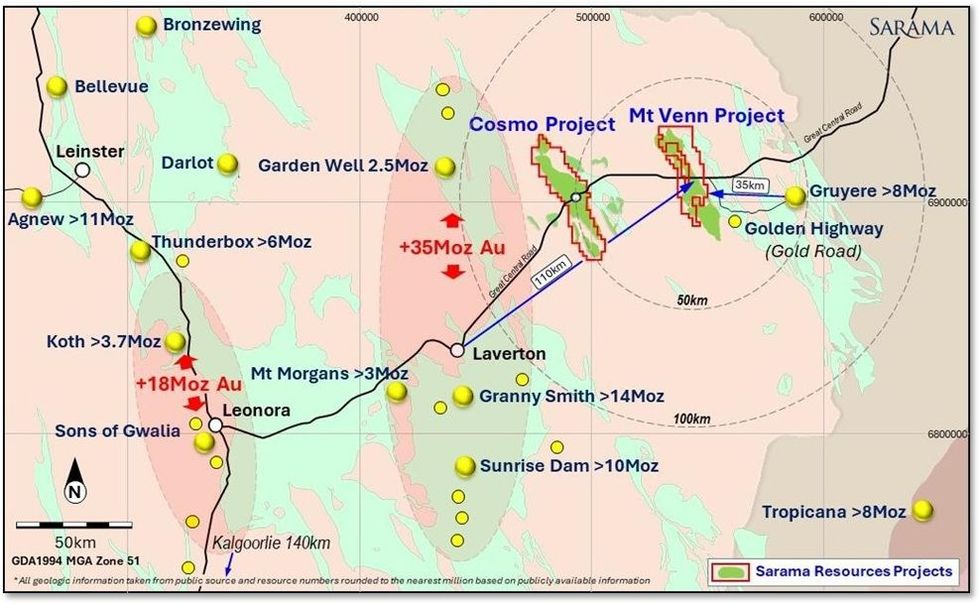
Figure 1 – Mt Venn and Cosmo Project Locations, Eastern Goldfields, Western Australia
Click here for the full ASX Release
This article includes content from Sarama Resources, licensed for the purpose of publishing on Investing News Australia. This article does not constitute financial product advice. It is your responsibility to perform proper due diligence before acting upon any information provided here. Please refer to our full disclaimer here.
SRR:AU
Sign up to get your FREE
Sarama Resources Investor Kit
and hear about exciting investment opportunities.
- Corporate info
- Insights
- Growth strategies
- Upcoming projects
GET YOUR FREE INVESTOR KIT
The Conversation (0)
06 February
Sarama Resources
Investor Insight
Sarama Resources offers a compelling investment opportunity fueled by a multi-million dollar, fully-funded arbitration claim and two new gold projects encompassing 1,000 sq km of the Cosmo Newbery and Mt Venn Greenstone Belts in Western Australia’s Eastern Goldfields.
Overview
Sarama Resources (TSXV:SWA,ASX:SRR) is a gold-focused Australian mineral exploration and development company. Sarama has two core components to its business, one being a significant and fully funded arbitration claim, and the other being two highly prospective gold projects totaling 1,000 sq km in area in the Eastern Goldfields of Western Australia. Individually, each component significantly derisks the company and together they present significant value and upside optionality for investors.
Sarama recently acquired the Cosmo and the Mt Venn gold projects which cover 580 sq km and 420 sq km, respectively, and encompass most of the greenstone belts in which they are situated. These greenstone belts are located in the Eastern Goldfields of Western Australia, and both have historical gold workings and strong geological and structural similarities to the adjacent Dorothy Hills greenstone belt which hosts the +8 Moz Gruyere gold deposit.
The Cosmo and Mt Venn gold projects offer a unique and promising opportunity for exploration in a region known for its prolific gold endowment.
The company is also pursuing a significant arbitration claim which is fully funded through a non-recourse loan facility. Boies Schiller Flexner who have an excellent track record of securing large settlements has been appointed to assist with the claim. The damages being sought are not less than cAU$200 million plus interest, and have the potential to be significantly more.
Sarama is led by an experienced board and management team with more than 30 years of individual experience and a proven track record of discovery and development of large-scale gold deposits including the +25 Moz world-class Kibali Gold Mine (formerly Moto Gold), and the +3 million ounce Sanutura gold project.
Company Highlights
- Sarama has two core components to its business - a fully funded arbitration claim and a new and highly prospective gold project in the Eastern Goldfields of Western Australia.
- Sarama’s Cosmo Gold project covers 580 sq km and encompasses most of the highly prospective Cosmo Newbery Greenstone Belt in the Eastern Goldfields of Western Australia.
- Sarama has acquired 80 percent interest in the Mt Venn gold project, which is 40 km east of the Cosmo Newbery Project, less than 40 km from the +8 Moz Gruyere gold mine and covers 420 sq km of the highly prospective Mt Venn Greenstone Belt.
- The company’s significant arbitration claim in Burkina Faso is fully funded through a non-recourse loan facility, seeking no less than AU$180 million in damages.
- The company is led by an experienced management team and board with more than 30 years of individual experience and a proven track record of discovery and development.
Key Projects
Cosmo Newbery Gold Project
The Cosmo Gold project is an underexplored, belt-scale gold asset in Western Australia's Eastern Goldfields. The project spans 580 sq km covering the entirety of the Cosmo-Newbery Greenstone Belt, a large and prospective system with gold first being discovered in the area in the 1890s and where rock chip sampling has returned grades up to 52 g/t gold. Cosmo Gold comprises seven contiguous exploration tenements and is located approximately 85 km northeast of Laverton in a region known for its prolific gold endowment.
Project Highlights
- Promising Geology: Whole greenstone belt with good structural setting in a prolific gold-producing region
- Scale: Tenure is contiguous over 583 sq km and covers the entire +50 km of greenstone belt
- Old workings: Gold was discovered in the 1890s highlighting its potential, but the area has remained unexplored for decades
- Limited exploration: The belt has seen virtually no modern exploration and no drilling of merit
- Location: Situated 95 km west of +8 Moz Gruyere gold mine (Gold Road) and 85 km from Laverton which sits in a greenstone belt hosting over 35 Moz of gold
Mt Venn Project
The Mt Venn Gold project has many similarities to the nearby Cosmo gold project and the company views it as an underexplored, belt-scale gold asset. The project spans 420 sq km and covers a large portion of the Mt Venn Greenstone Belt, a large and prospective system with gold first being discovered in the area in the 1890s. Limited drilling has returned multiple intersections of merit, and the project has a 35km long gold corridor marked by semi-contiguous gold-in-soil anomalism, old workings and drill intercepts. Mt Venn comprises three contiguous exploration tenements and is located approximately 35 km west of Gold Road’s 8 Moz, +300,000 oz/yr Gruyere gold mine and 40 km east of the company’s Cosmo gold project.
Project Highlights
- Promising Geology: Project covers a significant part of the Mt Venn greenstone belt, it has a good lithological and structural setting, including a regional shear zone approximately 50 km long and 1 to 3 km wide, extending full length of the greenstone belt.
- Scale: Tenure is contiguous over 420 sq km and covers a large portion of greenstone belt
- Old workings: Gold was discovered in the 1890s highlighting its potential, but the area has remained unexplored for decades
- Limited exploration: A lot of exploration potential remains in the belt with historical exploration work delineating a 35km anomalous gold trend coincident with a major regional structure and favorable lithologies
- Gold intercepts in drilling at Three Bears Prospect on Mt Venn project extend over 4 km trend to maximum 8.5 g/t gold
- Location: Situated 40 km west of Gold Road’s 8 Moz, +300,000 oz/yr Gruyere gold mine, 20 km west of Gold Road’s 1 Moz Golden Highway deposit and 40 km east of the company’s Cosmo gold project
Management Team
Andrew Dinning – Executive Chairman
Andrew Dinning is a founder, managing director and CEO of Sarama Resources. Dinning is committed to development in Africa and recently retired as a board member of The Australia-Africa Minerals and Energy Group (AAMEG) after eight years of service. AAMEG is a peak body representing Australian companies engaged in the development of Africa's resource industry.
Dinning has over 35 years of experience in the international mining arena and has worked in the Democratic Republic of Congo, West Africa, the UK, Russia and Australia. He has extensive mine management, operations and capital markets experience and has spent most of his career in the gold sector. Dinning was a director and president of the Democratic Republic of Congo-based Moto Goldmines Ltd from 2005 to 2009. He oversaw the development of the company's Moto Gold Project (Kibali Gold) from two million to more than 22 million ounces of gold. Dinning took the project from exploration to pre-development. The Moto Gold project was later taken over by Randgold Resources and AngloGold Ashanti for $600 million in October 2009. Dinning has an MBA, a first-class mine managers certificate in Western Australia and South Australia and a Bachelor of Engineering in Mining degree.
John (Jack) Hamilton - Vice-president of Exploration
Jack Hamilton is a founder and the vice president of exploration at Sarama Resources. Hamilton has 35 years of experience as a professional geologist. Hamilton has worked around the world for international resource companies. Before Sarama, he was the exploration manager for Moto Goldmines. in the Democratic Republic of Congo. At Moto Goldmines, he led the team that discovered the main deposits and resource at the world-class Moto Gold Project (now Kibali Gold) which has a resource of more than 22 million ounces.
Hamilton specializes in precious metal exploration in Birimian, Archean and Proterozoic greenstone belts. He has worked and consulted in West, Central and East Africa for the past 20 years with various companies, including Barrick Gold Corporation, Echo Bay Mines, Etruscan Resources Inc, Anglo American, Geo Services International and Moto Goldmines. Whilst at Moto Goldmines, he led the exploration team that took the Moto gold deposit from discovery to bankable feasibility. The Moto gold deposit was later sold to Randgold Resources and AngloGold Ashanti in October 2009.
Paul Schmiede - Vice-president of Corporate Development
Paul Schmiede is a major shareholder and the vice president of corporate development at Sarama Resources. He is a mining engineer with over 25 years of experience in mining and exploration. Before joining Sarama Resources in 2010, Schmiede was vice president of operations and project development at Moto Goldmines. At Moto Goldmine, he managed the pre-feasibility, bankable and definitive feasibility study for the more than 22 million-ounce Democratic Republic of Congo-based Moto Gold Project (now Kibali Gold). Whilst at Moto Goldmines, he also managed the in-country environment, community studies and pre-construction activities. Before joining Moto Goldmines, he held senior operational and management positions with Gold Fields and WMC Resources. At these companies, Schmiede was responsible for underground and open-pit operations as well as project development and planning.
Schmiede holds a first-class mine managers certificate in Western Australia and a Bachelor of Engineering in Mining degree. He is also a fellow of the Australasian Institute of Mining and Metallurgy.
Lui Evangelista - Chief Financial Officer
Lui Evangelista is Sarama's chief financial officer with 35 years of experience in accounting, finance and corporate governance with public companies. He has more than 20 years of experience in the mining industry –– 10 years of which have been at the operational and corporate level with companies operating in Francophone Africa.
Evangelista held the positions of group financial controller and acting CFO at Anvil Mining. which operated 3 mines in the DRC. He was an integral part of the senior management team that saw Anvil's market capitalization grow from C$100 million in 2005 to C$1.3 billion upon takeover by Minmetals in 2012.
Evangelista holds a Bachelor of Business in Accounting degree, a graduate diploma in business administration and a graduate diploma in applied corporate governance.
Simon Jackson - Non-executive Director
Simon Jackson is a founder, shareholder and non-executive chairman of Sarama Resources. Simon is a Chartered Accountant with over 25 years of experience in the mining sector. He is the chairman of Predictive Discovery and non-executive director of African gold producer Resolute Mining. He has previously held senior management positions at Red Back Mining, Orca Gold and Beadell Resources.
Jackson specializes in M&A, public equity markets management and corporate finance. His career has included corporate transactions in Canada, Australia, Africa and Indonesia. He holds a Bachelor of Commerce degree from the University of Western Australia and is a fellow of the Institute of Chartered Accountants in Australia.
Adrian Byass - Non-executive Director
Adrian Byass has more than 25 years of experience in the mining industry. He has focused his career on the economic development of mineral resources. He is skilled in economic and resource geology. Byass has experience ranging from production in gold and nickel mines to the evaluation and development of mining projects with listed and unlisted entities in several countries. He has also held several executive and non-executive board roles on both ASX and AIM-listed companies.
Byass presently operates in a corporate and market-focused capacity on a national and international basis. He has board-level experience in mine development, capital raising and M&A in Australia and on overseas stock exchanges. Byass has played key roles in a range of exploration and mining projects in Australia, Africa, North America and Europe. These projects were based on a suite of commodities including gold, base and specialty metals.
Byass holds a Bachelor of Science in Geology and a Bachelor of Economics. Byass is a member of the Australian Institute of Geoscientists, a fellow of the Society of Economic Geology and a competent person for the reporting of mineral resources (JORC 2012).
Byass is currently on the board of multiple ASX-listed companies, including Galena Mining, Kaiser Reef, Kingwest Resources and Infinity Lithium.
Michael Bohm - Non-executive Director
Michael Bohm is a seasoned director and mining engineer in the resources industry. His career spans roles as a mining engineer, mine manager, study manager, project manager, project director, and managing director.
He has been directly involved in the development of multiple mines in the gold, nickel, and diamond industries, and made significant contributions to Ramelius Resources during its formative years. This experience is particularly important as Sarama is currently in the process of rebuilding its operations in the Eastern Goldfields region of Western Australia.
He is a current director of ASX-listed Riedel Resources and has previously been a director of ASX listed Perseus Mining, Ramelius Resources, Mincor Resources NL and Cygnus Metals.
Keep reading...Show less
Promising new gold projects in Western Australia, plus a large fully funded arbitration claim.
11 February
Sarama Completes Tranche 2 Options Placement
14h
John Feneck: Gold Backdrop Looks “Amazing,” Plus 7 Stocks to Watch Now
John Feneck, portfolio manager and consultant at Feneck Consulting, outlines his updated outlook for gold as the yellow metal continues to reach new highs.
He also discusses seven gold and "special situations" companies that are on his radar.
Don't forget to follow us @INN_Resource for real-time updates!
Securities Disclosure: I, Charlotte McLeod, hold no direct investment interest in any company mentioned in this article.
Keep reading...Show less
17h
Athena Gold Upsizes Flow-Through Private Placement, Announces Concurrent Hard Dollar Unit Offering
Athena Gold Corporation (CSE:ATHA) (OTCQB:AHNR) ("Athena Gold" or the "Company") is pleased to announce that due to strong demand, the Company has increased the size of the non-brokered flow-through private placement previously announced on April 7, 2025, from $500,000 to $700,000 (the "FT Offering"). The FT Offering, as amended, will now consist of up to 14,000,000 flow-through common shares (the "FT Shares") (increased from 10,000,000 FT Shares) at a price of $0.05 per FT Share. All other terms of the FT Offering remain unchanged.
Non-Flow-Through Unit Private Placement
The Company further announces a non-brokered private placement for gross proceeds of up to $200,000 comprised of up to 4,000,000 units (each, a "Unit") at a price of $0.05 per Unit (the "NFT Offering").
Each Unit consists of one non-flow-through common share in the capital of the Company (a "NFT Common Share") and one-half of a common share purchase warrant (a "Warrant"). Each whole Warrant is exercisable into one NFT Common Share at a price of $0.12 per Warrant for a period of thirty-six months from the date of issuance, subject to the following acceleration provision. If, at any time after the date that is 4 months and one day after the date of issuance of the Warrants, the average volume weighted trading price of the Company's Common Shares on the Canadian Securities Exchange is at or above $0.20 per share for a period of 10 consecutive trading days (the "Triggering Event"), the Company may at any time, after the Triggering Event, accelerate the expiry date of the Warrants by giving ten calendar days notice to the holders of the Warrants, by way of news release, and in such case the Warrants will expire on the first day that is 30 calendar days after the date on which such notice is given by the Company announcing the Triggering Event.
The securities to be issued under the NFT Offering will be offered pursuant to Section 2.3 of National Instrument 45-106 (the "accredited investor" exemption). All securities issued in connection with the NFT Offering will be subject to a hold period which will expire four months and one day from the date of closing of the NFT Offering.
A finder's fee may be paid in connection with the NFT Offering to eligible arm's length finders in accordance with CSE policies and applicable securities laws. The NFT Offering is subject to several conditions, including receipt of all necessary corporate and regulatory approvals, including that of the Board and the Canadian Securities Exchange ("CSE").
Insiders may participate in the NFT Offering and will be considered a related party transaction subject to Multilateral Instrument 61-101 - Protection of Minority Security Holders in Special Transactions ("MI 61-101"). The Company intends to rely on exemptions from the formal valuation and minority shareholder approval requirements provided under subsections 5.5(a) and 5.7(a) of MI 61-101 on the basis that participation in the NFT Offering by insiders will not exceed 25% of the fair market value of the Company's market capitalization.
Proceeds of the NFT Offering will be used to fund exploration work on the Company's various properties.
None of the foregoing securities have been or will be registered under the United States Securities Act of 1933, as amended (the "1933 Act") or any applicable state securities laws and may not be offered or sold in the United States or to, or for the account or benefit of, U.S. persons (as defined in Regulation S under the 1933 Act) or persons in the United States absent registration or an applicable exemption from such registration requirements. This press release does not constitute an offer to sell or the solicitation of an offer to buy nor will there be any sale of the foregoing securities in any jurisdiction in which such offer, solicitation or sale would be unlawful.
About Athena Gold Corporation
Athena Gold is engaged in the business of mineral exploration and the acquisition of mineral property assets. Its objective is to locate and develop economic precious and base metal properties of merit and to conduct additional exploration drilling and studies on its projects across North America. Athena Gold's Excelsior Springs Au-Ag project is located in the prolific Walker Lane Trend in Nevada. Excelsior Springs spans 1,675 ha and covers at least three historic mines along the Palmetto Mountain trend, where the Company is following up on a recent shallow oxide gold discovery, with drill results including 5.35 g/t Au over 33.5 m. Meanwhile, the Company's new Laird Lake project is situated in the Red Lake Gold District of Ontario, covering 4,158 hectares along more than 10 km of the Balmer-Confederation Assemblage contact, where recent surface sampling results returned up to 373 g/t Au. This underexplored area is road-accessible, located about 10 km west of West Red Lake Gold's Madsen mine and 34 km northwest of Kinross Gold's Great Bear project.
For further information about Athena Gold Corporation and our Excelsior Springs Gold project, please visit www.athenagoldcorp.com.
On Behalf of the Board of Directors
Koby Kushner
President and Chief Executive Officer, Athena Gold Corporation
For further information, please contact:
Athena Gold Corporation
Koby Kushner, President and Chief Executive Officer
Phone: 416-846-6164
Email: kobykushner@athenagoldcorp.com
CHF Capital Markets
Cathy Hume, CEO
Phone: 416-868-1079 x 251
Email: cathy@chfir.com
Forward-Looking Statements
This press release contains forward-looking statements and forward-looking information (collectively, "forward-looking statements") within the meaning of applicable Canadian and US. securities laws. All statements, other than statements of historical fact, included herein, including, without limitation, statements regarding future exploration plans, future results from exploration, and the anticipated business plans and timing of future activities of the Company, are forward-looking statements. Although the Company believes that such statements are reasonable, it can give no assurance that such expectations will prove to be correct. Forward-looking statements are typically identified by words such as: "believes", "will", "expects", "anticipates", "intends", "estimates", ''plans", "may", "should", ''potential", "scheduled", or variations of such words and phrases and similar expressions, which, by their nature, refer to future events or results that may, could, would, might or will occur or be taken or achieved. In making the forward-looking statements in this press release, the Company has applied several material assumptions, including without limitation, that there will be investor interest in future financings, market fundamentals will result in sustained precious metals demand and prices, the receipt of any necessary permits, licenses and regulatory approvals in connection with the future exploration and development of the Company's projects in a timely manner.
The Company cautions investors that any forward-looking statements by the Company are not guarantees of future results or performance, and that actual results may differ materially from those in forward-looking statements as a result of various risk factors as disclosed in the final long form prospectus of the Company dated August 31, 2021.
Readers are cautioned not to place undue reliance on forward-looking statements. The Company undertakes no obligation to update any of the forward-looking statements in this press release or incorporated by reference herein, except as otherwise stated.
Keep reading...Show less
20 April
Analyst Spotlight: Castle Minerals' Path to Significant Gold Discovery in Ghana
A recent research report by Terra Studio highlights Castle Minerals’ (ASX:CDT) investment value proposition as a gold exploration company with significant potential in Ghana's gold-rich region. With an enterprise value of just AU$3.4 million, Terra Studio considers Castle Minerals significantly undervalued given its promising drill results, strong government support for its graphite project, and potential for continued discoveries amid record-high gold prices.
The Terra Studio report from April 14, 2025, outlines several compelling reasons why Castle Minerals presents an attractive investment opportunity.
Key Highlights from the Report:
Strategic Location and Recent Discoveries
Castle's projects are located in northern Ghana, which hosts several major gold deposits including Cardinal Resources' 5.1 Moz Namdini deposit. The company's Kpali gold project has confirmed robust mineralization with impressive drill results including 12 m at 8.29 grams per ton (g/t) gold and 9 m at 4.81 g/t gold, while the Kandia gold project has demonstrated promising continuity with results like 7 m at 3.36 g/t gold.
Geological Advantage
The report emphasizes that Castle's Kpali area sits at the convergence of two major fertile greenstone belts and three regional-scale structures that host multi-million-ounce deposits in the region – a geological setting similar to higher-valued projects in West Africa.
Strong Leadership and Financial Position
The company is led by Stephen Stone, who previously grew the nearby Black Volta gold project to 2.80 million ounces of mineral resources. Following a recent AU$3 million placement, Castle Minerals is well-funded to continue its exploration activities.
Castle also owns the Kambale graphite project, one of the highest-grade graphite projects in Africa with a mineral resource of 22.4 million tonnes at 8.6 percent total graphitic carbon. The Ghanaian government has expressed strong support, with the country's sovereign fund signing a term sheet to invest approximately US$2 million to advance the project.
For the full analyst report, click here.
This content is intended only for persons who reside or access the website in jurisdictions with securities and other applicable laws which permit the distribution and consumption of this content and whose local law recognizes the scope and effect of this Disclaimer, its limitation of liability, and the legal effect of its exclusive jurisdiction and governing law provisions [link to Governing Law section of the Disclaimer page].
Any investment information contained on this website, including third party research reports, are provided strictly for informational purposes, are general in nature and not tailored for the specific needs of any person, and are not a solicitation or recommendation to purchase or sell a security or intended to provide investment advice. Readers are cautioned to seek the advice of a registered investment advisor regarding the appropriateness of investing in any securities or investment strategies mentioned on this website.
Keep reading...Show less
17 April
Gold Price Hits New Record, Breaking US$3,300 for First Time
The gold price reached yet another record high on Wednesday (April 16), breaking US$3,300 per ounce.
The precious metal has gained significant momentum since the beginning of the year. In trading on Wednesday it surged past the US$3,200 mark, climbing as high as US$3,354.10 per ounce. The price retreated below the US$3,300 mark on Thursday (April 17).
The rise comes after statements from US Federal Reserve Chairman Jerome Powell made at the Economic Club of Chicago on Wednesday. In his remarks, he said that he expects US President Donald Trump's tariff policy to negatively impact US economic growth and further fuel inflation.
In addition to gold climbing to record highs, the US dollar sank to its lowest point in three years with the DXY dollar index falling to 99.3 points on Thursday.
Gold price chart, April 10, 2025, to April 17, 2025.
Gold price chart via the Investing News Network.
Gold prices have soared in recent weeks amidst the chaos caused by Donald Trump's tariff announcements on April 2.
Those measures included a 10 percent tariff on all but a handful of countries, including Canada and Mexico, with more severe reciprocal tariffs to come into effect this week. However, on April 9, Trump announced he would pause the additional tariffs for 90 days, saying more than 70 countries had contacted him to make deals.
Trump may have also been feeling pressure from economic advisors as a surge in treasury yields signaled a potential economic crisis brewing in the US bond market. Normally a safe haven during market volatility, the bond market saw a significant selloff this week as US tariffs and worries about the US economy's stability spooked traders.
Although the pause gave most countries some breathing room, tariffs against China were left on the table. After much back and forth, US tariffs levied against China have now increased to 145 percent.
The net effect of Trump's actions has been political and financial turmoil, sparking selloffs in major stock markets and pushing prices for safe-haven assets like gold to fresh records.
Additionally, China, Japan and South Korea agreed on March 30 to seek deeper free trade ties in response to the threat of tariffs from the US government. The deal marks a significant move by the three countries following decades of US diplomacy to maintain close relationships with Japan and South Korea.
Don't forget to follow us @INN_Resource for real-time updates!
Securities Disclosure: I, Dean Belder, hold no direct investment interest in any company mentioned in this article.
Keep reading...Show less
17 April
What Was the Highest Price for Gold?
Gold has long been considered a store of wealth, and the price of gold often makes its biggest gains during turbulent times as investors look for cover in this safe-haven asset.
The 21st century has so far been heavily marked by episodes of economic and sociopolitical upheaval. Uncertainty has pushed the precious metal to record highs as market participants seek its perceived security. And each time the gold price rises, there are calls for even higher record-breaking levels.
Gold market gurus from Lynette Zang to Chris Blasi to Jordan Roy-Byrne have shared eye-popping predictions on the gold price that would intrigue any investor — gold bug or not.
Some have posited that the gold price may rise as high as US$4,000 or US$5,000 per ounce, and there are even those who believe that US$10,000 gold or even US$40,000 gold could become a reality.
These impressive price predictions have investors wondering, what is gold's all-time high (ATH)?
In the past year, gold has reached a new all-time high dozens of times. Find out what has driven it to these levels, plus how the gold price has moved historically and what has driven its performance in recent years.
In this article
How is gold traded?
Before discovering what the highest gold price ever was, it’s worth looking at how the precious metal is traded. Knowing the mechanics behind gold's historical moves can help illuminate why and how its price changes.
Gold bullion is traded in dollars and cents per ounce, with activity taking place worldwide at all hours, resulting in a live price for the metal. Investors trade gold in major commodities markets such as New York, London, Tokyo and Hong Kong. London is seen as the center of physical precious metals trading, including for silver. The COMEX division of the New York Mercantile Exchange is home to most paper trading.
There are many popular ways to invest in gold. The first is through purchasing gold bullion products such as bullion bars, bullion coins and rounds. Physical gold is sold on the spot market, meaning that buyers pay a specific price per ounce for the metal and then have it delivered. In some parts of the world, such as India, buying gold in the form of jewelry is the largest and most traditional route to investing in gold.
Another path to gold investment is paper trading, which is done through the gold futures market. Participants enter into gold futures contracts for the delivery of gold in the future at an agreed-upon price.
In such contracts, two positions can be taken: a long position under which delivery of the metal is accepted or a short position to provide delivery of the metal. Paper trading as a means to invest in gold can provide investors with the flexibility to liquidate assets that aren’t available to those who possess physical gold bullion.
One significant long-term advantage of trading in the paper market is that investors can benefit from gold’s safe-haven status without needing to store it. Furthermore, gold futures trading can offer more financial leverage in that it requires less capital than trading in the physical market.
Interestingly, investors can also purchase physical gold via the futures market, but the process is complicated and lengthy and comes with a large investment and additional costs.
Aside from those options, market participants can invest in gold through exchange-traded funds (ETFs). Investing in a gold ETF is similar to trading a gold stock on an exchange, and there are numerous gold ETF options to choose from. For instance, some ETFs focus solely on physical gold bullion, while others focus on gold futures contracts. Other gold ETFs center on gold-mining stocks or follow the gold spot price.
It is important to understand that you will not own any physical gold when investing in an ETF — in general, even a gold ETF that tracks physical gold cannot be redeemed for tangible metal.
With regards to the performance of gold versus trading stocks, gold has an interesting relationship with the stock market. The two often move in sync during “risk-on periods” when investors are bullish. On the flip side, they tend to become inversely correlated in times of volatility. There are a variety of options for investing in stocks, including gold mining stocks on the TSX and ASX, gold juniors, precious metals royalty companies and gold stocks that pay dividends.
According to the World Gold Council, gold's ability to decouple from the stock market during periods of stress makes it “unique amongst most hedges in the marketplace.” It is often during these times that gold outperforms the stock market. For that reason, it is often used as a portfolio diversifier to hedge against uncertainty.
What was the highest gold price ever?
Gold price chart, December 31, 2024, to April 14, 2025.
Chart via the Investing News Network.
The gold price peaked at US$3,354.10 per ounce, its all-time high, during trading on April 16, 2025.
What drove it to set this new ATH? Gold set its latest high price of 2025 on April 16 as markets and the US dollar fell and gold purchasing in China continued to ramp up significantly in response to US tariffs on the country.
The gold price has set a string of new highs this month alone amid high market volatility as markets react to the latest tariff decisions from US President Donald Trump and the escalating trade war between the US and China. As of April 11, Trump has now raised US tariffs on Chinese imports to 145 percent and China has raised its tariffs on US products to 125 percent.
Two days earlier, Trump paused his higher "Liberation Day" tariffs on any countries that did not reciprocate in response. However, the blanket 10 percent tariffs still stand, as do the 25 percent tariffs on the automotive sector.
Why is the gold price setting new highs in 2025?
This string of record-breaking highs this year are caused by several factors.
Increased economic and geopolitical turmoil caused by the new Trump administration has been a tailwind for gold this year, as well as a weakening US dollar, sticky inflation in the country and increased safe haven gold demand.
Since coming into office in late January, Trump has threatened or enacted tariffs on many countries, including currently paused blanket tariffs on long-time US allies Canada and Mexico and tariffs on the European Union. Trump has also implemented 25 percent tariffs on all steel and aluminum imports.
As for the effect of these wide-spread tariffs raising prices for the American populace, Trump has reiterated his sentiment that the US may need to go through a period of economic pain to enter a new "golden age" of economic prosperity. Elon Musk's call to audit the gold holdings in Fort Knox has also brought attention to the yellow metal.
What factors have driven the gold price in the last five years?
Five year gold price chart, April 13, 2020, to April 14, 2025.
Chart via the Investing News Network.
Despite these recent runs, gold has seen its share of both peaks and troughs over the last decade. After remaining rangebound between US$1,100 and US$1,300 from 2014 to early 2019, gold pushed above US$1,500 in the second half of 2019 on a softer US dollar, rising geopolitical issues and a slowdown in economic growth.
Gold’s first breach of the significant US$2,000 price level in mid-2020 was due in large part to economic uncertainty caused by the COVID-19 pandemic. To break through that barrier and reach what was then a record high, the yellow metal added more than US$500, or 32 percent, to its value in the first eight months of 2020.
The gold price surpassed that level again in early 2022 as Russia's invasion of Ukraine collided with rising inflation around the world, increasing the allure of safe-haven assets and pulling the yellow metal up to a price of US$2,074.60 on March 8, 2022. However, it fell throughout the rest of 2022, dropping below US$1,650 in October.
Although it didn't quite reach the level of volatility as the previous year, the gold price experienced drastic price changes in 2023 on the back of banking instability, high interest rates and the breakout of war in the Middle East.
After central bank buying pushed the gold price up to the US$1,950.17 mark by the end of January, the US Federal Reserve’s 0.25 percent rate hike on February 1 sparked a retreat as the dollar and Treasury yields saw gains. The precious metal went on to fall to its lowest price level of the year at US$1,809.87 on February 23.
The banking crisis that hit the US in early March caused a domino effect through the global financial system and led to the mid-March collapse of Credit Suisse, Switzerland’s second-largest bank. The gold price jumped to US$1,989.13 by March 15. The continued fallout in the global banking system throughout the second quarter of the year allowed gold to break above US$2,000 on April 3, and go on to flirt with a near-record high of US$2,049.92 on May 3.
Those gains were tempered by the Fed’s ongoing rate hikes and improvements in the banking sector, resulting in a downward trend in the gold price throughout the remainder of the second quarter and throughout Q3. By October 4, gold had fallen to a low of US$1,820.01 and analysts expected the precious metal to drop below US$1,800.
That was before the October 7 attacks by Hamas on Israel ignited legitimate fears of a much larger conflict erupting in the Middle East. Reacting to those fears, and to rising expectations that the Fed would begin to reverse course on interest rates, gold broke through the important psychological level of US$2,000 and closed at US$2,007.08 on October 27. As the Israel-Hamas fighting intensified, gold reached a then new high of US$2,152.30 during intraday trading on December 3.
That robust momentum in the spot gold price has continued into 2024, chasing new highs on fears of a looming US recession, the promise of Fed rate cuts on the horizon, the worsening conflict in the Middle East and the tumultuous US presidential election year. By mid-March, gold was pushing up against the US$2,200 level.
That record-setting momentum continued into the second quarter of 2024 when gold broke through US$2,400 in mid-April on strong central bank buying, sovereign debt concerns in China and investors expecting the Fed to start cutting interest rates. The precious metal went on to hit US$2,450.05 on May 20.
Throughout the summer, the hits have just kept on coming.
The global macro environment is highly bullish for gold in the lead up to the US election. Following the failed assassination attempt on Trump and a statement about coming interest rate cuts by Fed Chair Jerome Powell, the gold spot price hit a new all-time high on July 16 at US$2,469.30. One week later, news that President Joe Biden would not seek re-election and would instead pass the baton to Vice President Kamala Harris eased some of the tension in the stock markets and strengthened the US dollar. This also pushed the price of gold down to US$2,387.99 on July 22.
However, the bullish factors supporting gold over the past year remain in play, and the spot price for gold went on to breach US$2,500 on August 2 on a less than stellar US jobs report; it closed just above the US$2,440 level. A few weeks later, gold pushed past US$2,500 once again on August 16, closing above that level for the first time ever after the US Department of Commerce released data showing a fifth consecutive monthly decrease in a row for homebuilding.
The news that the Chinese government issued new gold import quotas to banks in the country following a two month pause also helped fuel the gold price rally. Central bank gold buying has been a significant tailwind for the gold price this year, and China's central bank has been one of the strongest buyers.
Market watchers expected the Fed to cut interest rates by a quarter point at their September meeting, but news on September 12 that the regulators were still deciding between the expected cut or a larger half-point cut led gold prices on a rally that carried through into the next day, bringing gold prices near US$2,600.
At the September 18 Fed meeting, the committee ultimately made the decision to cut rates by half a point, news that sent gold even higher. By Friday, September 20, it moved above US$2,600 and held above US$2,620.
In October, gold breached the US$2,700 level and continued to set new highs on a variety of factors, including further rate cuts and economic data anticipation, the escalating conflict in the Middle East between Israel and Hezbollah, and economic stimulus in China — not to mention the very close race between the US presidential candidates.
While the gold price fell following Trump's win in early November and largely held under US$2,700 through the end of the year, it began trending upwards in 2025 to the new all-time high discussed earlier in the article.
Gold has seen upward momentum in the last year on a variety of factors.
In 2025, the gold price was on the rise early in the new year as Trump and his team began to talk seriously about a wide-ranging set of tariffs on several countries in the run up and following his inauguration on January 20.
On January 29, the Bank of Canada shaved 25 basis points off its policy interest rate, marking its sixth consecutive decrease, and announced plans to end quantitative tightening.
On the same day, the Fed opted to leave interest rates unchanged. The following day, Trump said he would very likely be placing 25 percent tariffs on Mexico and Canada as of February 1, alongside tariffs on the EU and China.
Gold price set new highs in all currencies alongside a weakening US dollar, the Fed leaving interest rates unchanged, a rush to safe haven assets and the looming threat of Trump's tariffs on February 1.
Additionally, new US economic data showed inflation-adjusted gross domestic product in the country increased an annualized 2.3 percent in the fourth quarter of 2024 after rising 3.1 percent in the third quarter.
Some other factors supporting gold to new highs include Trump threatening to annex Greenland, Canada and the Panama Canal, Trump's proposed resettlement of Palestinians out of the Gaza Strip to develop it into "the Riviera of the Middle East," a suggestion that has been condemned globally, and him appearing to side with Putin against Ukrainian President Volodymyr Zelenskyy regarding Russia's invasion of Ukraine.
What's next for the gold price?
What's next for the gold price is never an easy call to make. There are many factors that affect the gold price, but some of the most prevalent long-term drivers include economic expansion, market risk, opportunity cost and momentum.
Economic expansion is one of the primary gold price contributors as it facilitates demand growth in several categories, including jewelry, technology and investment. As the World Gold Council explains, “This is particularly true in developing economies where gold is often used as a luxury item and a means to preserve wealth.”
Market risk is also a prime catalyst for gold values as investors view the precious metal as the “ultimate safe haven,” and a hedge against currency depreciation, inflation and other systemic risks.
Going forward, in addition to the Fed, inflation and geopolitical events, experts will be looking for cues from factors like supply and demand. In terms of supply, the world’s five top gold producers are China, Australia, Russia, Canada and the US. The consensus in the gold market is that major miners have not spent enough on gold exploration in recent years. Gold mine production has fallen from around 3,200 to 3,300 metric tons each year between 2018 and 2020 to around 3,000 to 3,100 metric tons each year between 2021 and 2023.
On the demand side, China and India are the biggest buyers of physical gold, and are in a perpetual fight for the title of world’s largest gold consumer. That said, it's worth noting that the last few years have brought a big rebound in central bank gold buying, which dropped to a record low in 2020, but reached a 55 year high of 1,136 metric tons in 2022.
The World Gold Council has reported that central bank gold purchases in 2023 came to 1,037 metric tons, marking the second year in a row above 1,000 MT. In the first half of 2024, the organization says gold purchases from central banks reached a record 483 metric tons.
“I expect the Fed’s rate-cutting cycle to be good for gold, but central bank buying has been and remains a major factor," Lobo Tiggre, CEO of IndependentSpeculator.com, said in an email to the Investing News Network (INN) at the beginning of Q4.
David Barrett, CEO of the UK division of global brokerage firm EBC Financial Group, is also keeping an eye on central bank purchases of gold.
“I still see the global central bank buying as the main driver — as it has been over the last 15 years,” he said in an email to INN. "This demand removes supply from the market. They are the ultimate buy-and-hold participants and they have been buying massive amounts."
In addition to central bank moves, analysts are also watching for escalating tensions in the Middle East, a weakening US dollar, declining bond yields, and further interest rate cuts as factors that could push gold higher as investors look to secure their portfolios.
“When it comes to outside factors that affect the market, it’s just tailwind after tailwind after tailwind. So I don’t really see the trend changing,” Coffin said.
Randy Smallwood of Wheaton Precious Metals (TSX:WPM,NYSE:WPM) told INN in March 2025 that gold is seeing support from many factors, including central bank buying, nervousness around the US dollar and stronger institutional interest. According to Smallwood, he is seeing an influx of fund managers wanting to learn about precious metals.
Check out more of INN's interviews to find out what experts have said about the gold price during its 2025 bull run and where it could go next.
Should you beware of gold price manipulation?
As a final note on the price of gold and buying gold bullion, it’s important for investors to be aware that gold price manipulation is a hot topic in the industry.
In 2011, when gold hit what was then a record high, it dropped swiftly in just a few short years. This decline after three years of impressive gains led many in the gold sector to cry foul and point to manipulation.
Early in 2015, 10 banks were hit in a US probe on precious metals manipulation. Evidence provided by Deutsche Bank (NYSE:DB) showed “smoking gun” proof that UBS Group (NYSE:UBS), HSBC Holdings (NYSE:HSBC), the Bank of Nova Scotia (NYSE:BNS) and other firms were involved in rigging gold and silver rates in the market from 2007 to 2013.
Not long after, the long-running London gold fix was replaced by the LBMA gold price in a bid to increase gold price transparency. The twice-a-day process, operated by the ICE Benchmark Administration, still involves a variety of banks collaborating to set the gold price, but the system is now electronic.
Still, manipulation has by no means been eradicated, as a 2020 fine on JPMorgan (NYSE:JPM) shows. The next year, chat logs were released in a spoofing trial for two former precious metals traders from the Bank of America’s (NYSE:BAC) Merrill Lynch unit. They show a trader bragging about how easy it is to manipulate the gold price.
Gold market participants have consistently spoken out about manipulation. In mid-2020, Chris Marcus, founder of Arcadia Economics and author of the book “The Big Silver Short,” said that when gold fell back below the US$2,000 mark after hitting close to US$2,070, he saw similarities to what happened with the gold price in 2011.
Marcus has been following the gold and silver markets with a focus specifically on price manipulation for nearly a decade. His advice? “Trust your gut. I believe we’re witnessing the ultimate ’emperor’s really naked’ moment. This isn’t complex financial analysis. Sometimes I think of it as the greatest hypnotic thought experiment in history.”
Investor takeaway
While we have the answer to what the highest gold price ever is as of now, it remains to be seen how high gold can climb, and if the precious metal can reach as high as US$5,000, US$10,000 or even US$40,000.
Even so, many market participants believe gold is a must have in any investment profile, and there is little doubt investors will continue to see gold price action making headlines this year and beyond.
This is an updated version of an article first published by the Investing News Network in 2020.
Don’t forget to follow us @INN_Resource for real-time updates!
Securities Disclosure: I, Lauren Kelly, hold no direct investment interest in any company mentioned in this article.
Editorial Disclosure: The Investing News Network does not guarantee the accuracy or thoroughness of the information reported in the interviews it conducts. The opinions expressed in these interviews do not reflect the opinions of the Investing News Network and do not constitute investment advice. All readers are encouraged to perform their own due diligence.
Keep reading...Show less
17 April
US Capital Gains Tax Guide for Gold and Silver Investors
As gold and silver continue to prove their worth as sound investments, market participants should know how precious metals investments are taxed in the US.
While the majority of gold and silver investing comes with a certain degree of taxation, there are different levels of tax based on how market participants decide to invest in these precious metals, how long the investments are held for and the investors individual tax bracket.
Read on for a breakdown of the taxes associated with investing in gold and silver bullion, ETFs and stocks, as well as the forms involved with reporting precious metals investments.
In this article
How are physical gold and silver taxed?
Gold and silver bullion, coins and bars are seen as collectibles by the Internal Revenue Service (IRS) in the US. Thus, physical gold and silver, no matter the form, are subject to a higher rate of capital gains tax when they are sold. The same is true for fellow precious metals platinum and palladium.
While long-term capital gains would typically carry a top bracket of 20 percent, collectibles can be taxed at a higher 28 percent.
The total an investor will owe in capital gains tax when selling physical gold and silver is based both on their income bracket and the length of time they held the asset.
The long-term capital gains tax on physical gold and silver is equal to an investor’s marginal tax rate, up to a maximum of 28 percent due to their status as a collectible, meaning those in higher tax brackets still only have to pay 28 percent on long-term gains from physical precious metals sales.
It is worth noting that the 28 percent maximum is only for long-term capital gains, which applies to metals that an investor has held for more than one year. Short-term capital gains on precious metals held for less than one year are taxed at ordinary income rates.
For example, a person in the highest tax bracket purchased 100 ounces of physical gold at US$1,800 per ounce and two years later sold their holdings for US$2,000 per ounce. While they are in the 37 percent tax bracket, they would pay 28 percent tax on the capital gains made from these sales. As they earned US$20,000 in capital gains, that would translate to US$5,600 in income tax.
However, if the investor sold the gold at the same gain just 11 months after they purchased it, it would count as short-term capital gains, and the investor would be taxed at 37 percent and owe US$7,400.
Investors who are in one of the tax brackets below 28 percent are taxed at the standard rate of their bracket when selling their solid gold and silver assets, whether they are held short- or long-term.
Similarly to other investments, precious metals sold at a loss can be used to offset capital gains.
How are gold and silver ETFs taxed?
Like all other exchange-traded funds (ETFs), gold ETFs and silver ETFs act in the same manner as individual stocks, meaning that investing in these ETFs is similar to trading a stock on an exchange. There are two main types of gold and silver ETFs: those that track the prices of those metals and those that track gold or silver stocks.
ETFs that follow metals prices provide exposure to either physical gold or silver, or gold or silver futures contracts. It is important to keep in mind that investing in these ETF platforms does not allow investors to own any physical gold or silver — in general, even an investment in an ETF that tracks physical gold or silver cannot be redeemed for the tangible metal.
ETFs that invest in gold or silver companies provide exposure to gold- and silver-mining stocks, as well as gold- or silver-streaming stocks.
In terms of taxation, capital gain taxes from selling gold and silver ETFs is determined by the ETF's holdings, the investors tax bracket and how long they held the asset for.
Funds will often supply investors with tax forms that they can use to fill out their income tax. The webpage for a fund should have a document describing how income tax is handled for that fund, which is worth reading before investing in it.
Long-term capital gains from selling shares of gold and silver ETFs are subject to a 28 percent maximum federal income tax rate if they hold physical precious metals and 20 percent if they hold stocks. While long-term capital gains would typically be capped at 20 percent maximum rate. This is because the holdings are considered collectibles, as described in the section above. Short-term gains made from selling gold or silver ETFs are subject to a maximum federal rate of 37 percent.
Additionally, these gains could get slapped with a 3.8 percent net investment income tax for high net-worth investors, and a state income tax may also apply.
Futures-based commodity ETFs can come with their own set of rules that you can learn about here. Briefly, they are often taxed in a 60/40 hybrid, with 60 percent treated as long-term gains and 40 percent treated as short-term gains. Additionally, this is calculated at the end of each tax year, whether a sale is made or not.
ETFs that hold stocks are taxed in the same way as traditional securities, which you can read more about below.
Kevin McElligott, managing director for Franco-Nevada Australia, part of gold-focused royalty and streaming company Franco-Nevada (TSX:FNV,NYSE:FNV), has warned that these taxes, alongside management fees, can become bothersome. “ETFs actually cost you money in annual management fees,” he told the Investing News Network via email.
How are gold and silver stocks taxed?
In terms of tax on gold and silver stocks, long-term gains from selling are subject to the standard 20 percent maximum federal rate, while short-term gains will face a maximum federal rate of 37 percent. For investors in higher income brackets, there is the potential for gold and silver stock investments to also be hit with the 3.8 percent net investment income tax as well as state income tax.
Unlike physical precious metals and ETFs that hold them, precious metals stocks are not classified as collectibles, which is why the long-term capital gains tax is capped at 20 percent instead of 28 percent.
Stocks sold at a loss are important as well as they can be used to offset capital gains when filing income tax.
How to report taxes on physical gold and silver investments
Market participants who sell precious metals in the US for a profit are required to report that profit on their income tax return, regardless of whether or not the dealer has any reporting obligation.
When selling gold and silver investments in the US, there are two different sets of reporting guidelines — one applies to the dealer through which a person sells and the other applies to the investor who is selling the asset.
It is important to note that taxes on the sale of gold and silver will not be due the moment that the sale is made, and the tax bill for all of these sales is due at the same time as a standard income tax bill.
For investors selling precious metals, capital gains or losses need to be reported on Schedule D of Form 1040 when making a tax return.
Investors will first need to detail their precious metals transactions on Form 8949, including the length of time the investments were held. This form must be filed alongside Schedule D. Investors then use this information alongside the 28% Rate Gain Worksheet included in the Schedule D instructions.
Depending on the type of metal being sold, Form 1099-B may have to be submitted to the IRS by the broker when the sale closes, as such transactions are considered income. As for when a broker will need to file Form 1099-B, there are specific rules that determine which sales of precious metals require the dealer to file this form that apply to transactions over a 24 hours period.
For gold sales, reportable items include specific gold coins, including the 1 ounce Canadian Gold Maple Leaf and Gold Kruggerand, and gold bars and rounds of at least 0.995 fineness. As for quantity, only sales of more than 25 gold coins and or more than 1 kilogram in gold bars and rounds will require the form.
Sales of 0.999 fine silver bars and rounds totaling over 1,000 ounces qualify. For silver coins, US coins with above 90 percent silver are reportable, but Silver American Eagle coins are not. Sales of silver coins exceeding US$1,000 will require a form.
When it comes to selling gold and silver overseas, market participants must follow the laws as they apply to the sale of gold and silver investments in that particular country.
The information in this article does not constitute tax advice, and investors should work with a tax professional or program to help them make sure everything is reported accurately.
This is an updated version of an article first published by the Investing News Network in 2019.
Don’t forget to follow us @INN_Resource for real-time updates!
Securities Disclosure: I, Lauren Kelly, currently hold no direct investment interest in any company mentioned in this article.
Editorial Disclosure: The Investing News Network does not guarantee the accuracy or thoroughness of the information reported in the interviews it conducts. The opinions expressed in these interviews do not reflect the opinions of the Investing News Network and do not constitute investment advice. All readers are encouraged to perform their own due diligence.
Keep reading...Show less
Latest News
Sign up to get your FREE
Sarama Resources Investor Kit
and hear about exciting investment opportunities.
- Corporate info
- Insights
- Growth strategies
- Upcoming projects
GET YOUR FREE INVESTOR KIT
Latest Press Releases
Related News
TOP STOCKS
American Battery4.030.24
Aion Therapeutic0.10-0.01
Cybin Corp2.140.00
Investing News Network websites or approved third-party tools use cookies. Please refer to the cookie policy for collected data, privacy and GDPR compliance. By continuing to browse the site, you agree to our use of cookies.