- AustraliaNorth AmericaWorld
Investing News NetworkYour trusted source for investing success
- Lithium Outlook
- Oil and Gas Outlook
- Gold Outlook Report
- Uranium Outlook
- Rare Earths Outlook
- All Outlook Reports
- Top Generative AI Stocks
- Top EV Stocks
- Biggest AI Companies
- Biggest Blockchain Stocks
- Biggest Cryptocurrency-mining Stocks
- Biggest Cybersecurity Companies
- Biggest Robotics Companies
- Biggest Social Media Companies
- Biggest Technology ETFs
- Artificial Intellgience ETFs
- Robotics ETFs
- Canadian Cryptocurrency ETFs
- Artificial Intelligence Outlook
- EV Outlook
- Cleantech Outlook
- Crypto Outlook
- Tech Outlook
- All Market Outlook Reports
- Cannabis Weekly Round-Up
- Top Alzheimer's Treatment Stocks
- Top Biotech Stocks
- Top Plant-based Food Stocks
- Biggest Cannabis Stocks
- Biggest Pharma Stocks
- Longevity Stocks to Watch
- Psychedelics Stocks to Watch
- Top Cobalt Stocks
- Small Biotech ETFs to Watch
- Top Life Science ETFs
- Biggest Pharmaceutical ETFs
- Life Science Outlook
- Biotech Outlook
- Cannabis Outlook
- Pharma Outlook
- Psychedelics Outlook
- All Market Outlook Reports
Large-Scale Magnetite Iron Opportunities Identified at Whaleshark
Miramar Resources Limited (ASX:M2R, “Miramar” or “the Company”) advises that a review of historical drilling data has revealed potentially very significant magnetite iron opportunities at the Company’s 100%- owned Whaleshark Project in the Ashburton Region of WA (Figure 1).
- Thick magnetite iron intersections >25% Fe identified in historic drill holes
- Similar scale opportunity to the Maitland River/Miaree magnetite iron deposits
Drilling conducted at Whaleshark by Western Mining Corporation (WMC) in the 1990’s, whilst exploring for iron oxide copper-gold, intersected significant widths of magnetite-rich banded iron formation averaging >25% Fe beneath younger sediments, with several holes ending in mineralisation (Figures 2 and 3). Miramar recently re-examined those holes, following completion of its own diamond drilling campaign.
Miramar’s Executive Chairman, Mr Allan Kelly, said the magnetic anomalies seen at Whaleshark are similar in scale to the 1.5 billion tonne Maitland River and Miaree magnetite iron deposits1.
“The recognition of two potentially very large magnetite iron deposits is very significant for Miramar, especially given the location of the Whaleshark Project with respect to existing infrastructure,” he added.
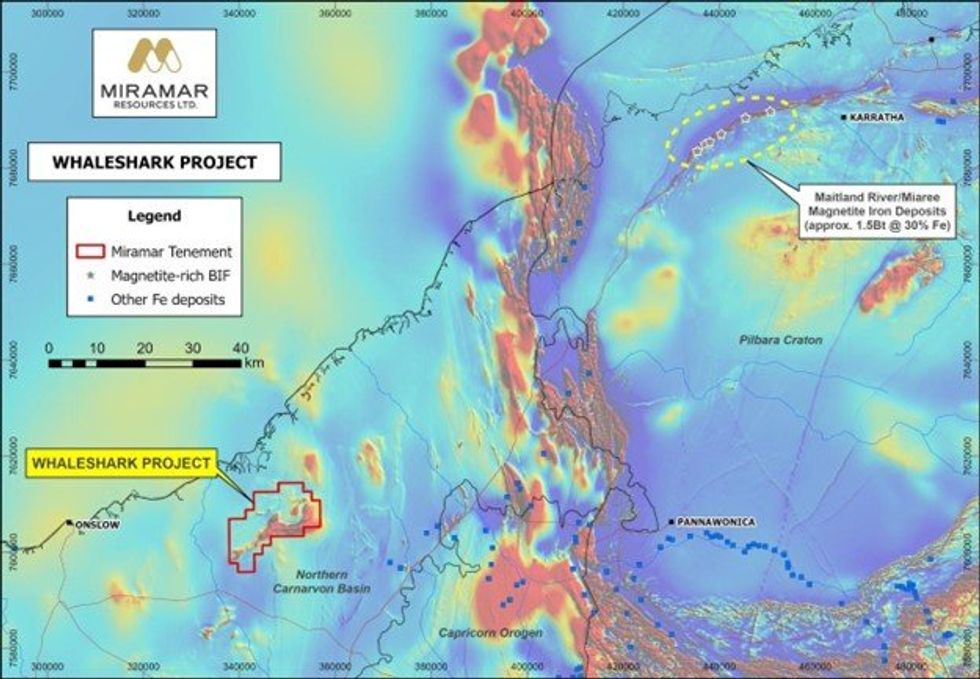
Figure 1. Regional magnetic image showing Whaleshark Project in relation to the Maitland River and Miaree magnetite iron deposits.
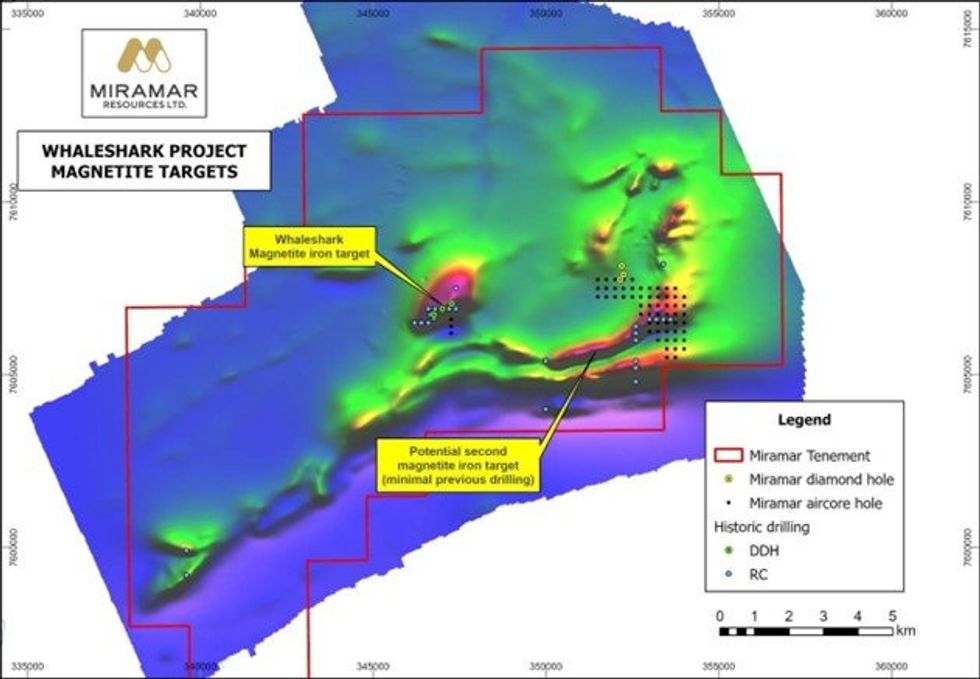
Figure 2. Magnetic image of Whaleshark Project showing magnetite iron targets.
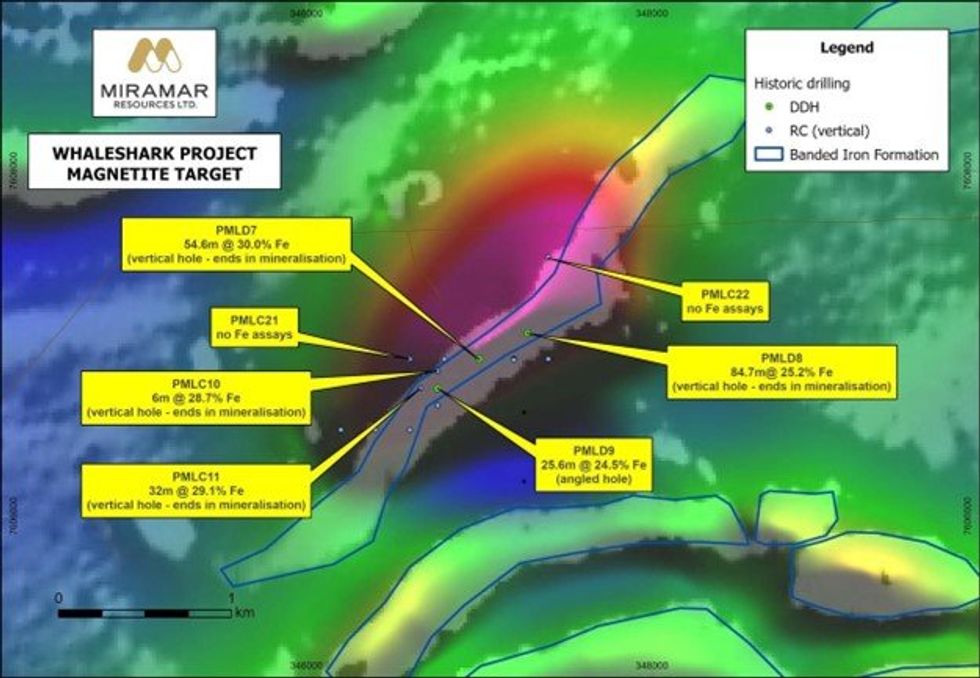
Figure 3. Magnetic image (RTP/2VD) of Whaleshark magnetite target showing historic drilling results.
A larger and virtually untested magnetite target is observed on the southern side of the granodiorite pluton.
Drill testing of the second magnetic anomaly is limited, with only a handful of historic RC holes that were not assayed for iron, and recent aircore holes completed by Miramar in 2022 that ended in 18-32% Fe.
In general, the basement is significantly shallower within this target, with average cover thickness in the order of 25-30m.
Click here for the full ASX Release
This article includes content from Miramar Resources Limited, licensed for the purpose of publishing on Investing News Australia. This article does not constitute financial product advice. It is your responsibility to perform proper due diligence before acting upon any information provided here. Please refer to our full disclaimer here.
Top 10 Copper Producers by Country
In 2024, concern grew about copper supply as copper mines in the top copper-producing countries continued to age without new mines to replace them.
Additionally, copper demand from electrification is expected to rise significantly in the coming years.
The competing forces of the global macroeconomic situation and a tightening supply and demand situation caused major swings in the copper price last year, and the red metal set a new all-time high in May 2024 as it moved above the US$5 per pound mark for the first time.
Despite a tight supply situation, demand from the energy transition has largely been muted as China, traditionally the largest consumer of copper for its infrastructure, works to stimulate its flagging economy.
The forecast for copper over the next few years is that the copper market will move into supply deficits, which in turn should provide more tailwinds for the price of copper and greater upside to company balance sheets.
For investors interested in copper, it’s worth looking at production by country. According to the latest US Geological Survey data, global copper production reached 23 million metric tons (MT) in 2024. Mining output figures for this article were supplemented with data provided by Mining Data Online (MDO).
Chile again took the crown to become the top copper producing country last year, but some of the others on the list may surprise you. Read on to find out the top 10 copper countries and what mines are driving each country's copper output.
1. Chile
Copper production: 5.3 million metric tons
In 2024, Chile produced 5.3 million metric tons of copper, making it the world’s largest copper producing country with about 23 percent of the total global copper output.
Naturally, many of the world's leading copper miners have substantial operations in Chile, including the state-owned Codelco, Anglo American (LSE:AAL,OTCQX:AAUKF), Glencore (LSE:GLEN,OTC Pink:GLCNF) and Antofagasta (LSE:ANTO,OTC Pink:ANFGF).
Chile is also home to BHP’s (ASX:BHP,NYSE:BHP,LSE:BHP) Escondida, the largest copper mine in the world with an annual output in the 2 million metric ton range. According to MDO, BHP owns a 57 percent stake in the operation, with Rio Tinto (ASX:RIO,NYSE:RIO,LSE:RIO) owning 30 percent and Mitsubishi (OTC Pink:MSBHF,TSE:8058) holding the remaining stake
According to BHP’s 2024 annual report, the company's portion of Escondida production came in at 1.13 million MT of copper in 2024.
However, Chile’s copper production is expected to rebound to record levels in 2025, according to S&P Global, to hit a projected 6 million MT as new mines ramp up their output.
2. Democratic Republic of Congo
Copper production: 3.3 million metric tons
In 2024, the Democratic Republic of Congo (DRC) produced 3.3 million metric tons of copper, accounting for more than 11 percent of global copper output. The DRC has increased its copper production rapidly in recent years, and its 2024 output marked a significant rise from the 2.93 million metric tons of copper produced the previous year.
One contributor to this increase is Phase 3 of the Ivanhoe Mines (TSX:IVN,OTCQX:IVPAF) Kamoa-Kakula project, which achieved commercial production in August 2024. A joint venture with partner Zijin Mining Group (OTC Pink:ZIJMY,SHA:601899), Kamoa-Kakula produced 437,061 MT of copper in 2024, an increase from the 393,551 MT produced in 2023. Ivanhoe is expecting further increases in production in 2025 and set its guidance for the year at 520,000 and 580,000 MT of copper.
3. Peru
Copper production: 2.6 million metric tons
In 2024, Peru produced 2.6 million metric tons of copper, according to USGS data. The total is down 160,000 MT from its copper output in 2023.
Among the factors impacting the declines was a 3.7 percent drop at Freeport McMoRan’s (NYSE:FCX) Cerro Verde, the largest copper mine in Peru. According to data from MDO, Cerro Verde produced 1.94 million metric tons of copper concentrate in 2023. Freeport McMoRan indicated in its Q1 2024 report that declines in its South American operations were due to lower volumes of stockpiled leach ore and lower milling rates associated with maintenance.
Other significant copper operations in Peru include Anglo American’s Quellaveco mine and Southern Copper’s (NYSE:SCCO) Tia Maria mine. The majority of copper produced in Peru is shipped to China and Japan, and South Korea and Germany are other top export destinations.
4. China
Copper production: 1.8 million metric tons
In 2024, China produced 1.8 million metric tons of copper. The total was marginally lower than the 1.82 million metric tons produced in 2023, but also marks a steady decline over the past few years, seeing production slip from a recent high of 1.91 million metric tons in 2021.
However, when it comes to refined copper production, China is by far the winner. In 2024, its refined copper production totaled 12 million metric tons, representing more than 44 percent of global refined copper production and six times the production of Chile, the next-top refinery producer. China also holds the world’s highest copper reserves at 190 million MT.
Zijin Mining Group, a leading metal producer in China, owns the Qulong copper-molybdenum-silver-gold mine in Tibet. The company purchased a 50.1 interest in the owner of the Qulong mine in 2024 and is working to consolidate 100 percent ownership. Zijin increased its mine production in 2024 and it is now the largest copper mine in China.
According to MDO, the Qulong mine produced 340 million pounds of copper in 2023. While its 2024 copper production is still being finalized, it is estimated to have increased to 366 million pounds.
5. Indonesia
Copper production: 1.1 million metric tons
In 2024, Indonesia produced 1.1 million metric tons of copper, passing the United States and Russia to become the fifth highest copper producer. The country's copper production has increased steadily in recent years, and is up significantly from 907,000 MT in 2023 and 731,000 MT in 2021.
Freeport McMoRan's Grasberg complex is the country’s largest copper mine. According to MDO data, the mine produced 1.66 billion pounds of copper in 2023.
Another of the country’s largest operations is PT Amman Mineral’s (IDX:AMMN,FWB:U4Z) Batu Hijau mine. While production in 2023 was modest compared to Grasberg at 542 million pounds of copper concentrate, it’s estimated that 2024 will see production increase significantly to 1.84 billion pounds as the mine begins processing high-grade ore from its Phase 7 cutback.
In mid-2024, Amman Minerals commissioned a smelting facility that will process 900,000 metric tons of copper concentrate annually to produce 222,000 MT of copper cathodes and 830,000 MT of sulfuric acid.
6. United States
Copper production: 1.1 million metric tons
The United States produced 1.1 million metric tons of copper in 2024. While only 30,000 metric tons less than its 2023 production totals, the country’s 2024 output was a sharp decline from the 1.23 million MT it produced in 2022.
The majority of US copper comes from Arizona, which accounts for 70 percent of domestic supply. Other states with significant copper output include Michigan, Missouri, Montana, Nevada and New Mexico. Overall, 17 mines are responsible for 99 percent of copper production in the United States.
Freeport McMoRan’s Morenci mine in Arizona, a joint venture with Sumitomo (TSE:8053), is the largest copper mine in the US. According to MDO data, the mine produced 700 million pounds of copper metal in 2024 and has 12.63 million pounds of proven and probable reserves.
Other significant operations include Freeport McMoRan’s Safford and Sierrita mines, at which copper production totaled 249 million MT and 165 million MT respectively.
7. Russia
Copper production: 930,000 metric tons
Russia produced 930,000 metric tons of copper in 2024, a sizable increase from the 890,000 MT produced the previous year.
One of the key contributions to the rise in Russian copper output is the ramp-up in Phase 1 production at Udokan Copper’s Udokan mine in Siberia. Although the mine experienced multiple fires at the very end of 2023, copper production was reported to be unaffected. The mine was expected to produce up to 135,000 metric tons of copper in 2024. This is expected to grow to 450,000 MT once Phase 2 comes online in 2028.
8. Australia
Copper production: 800,000 metric tons
In 2024, Australia produced 800,000 metric tons of copper, a slight increase from the 778,000 MT produced in 2023.
The country’s largest copper operation is BHP’s Olympic Dam mine in South Australia. According to MDO data, 2024 marked a 10 year high in total copper production for Olympic Dam at 216,000 metric tons.
The state of Queensland is home to the Mount Isa complex, run by a subsidiary of Glencore. While it is one of Australia’s largest copper producers, the operations will be closed in the second half of 2025.
Australia may have modest output compared to those at the top of the list, but it is tied with Peru for the second highest copper reserves in the world at 100 million metric tons, behind only China with 190 million metric tons.
9. Kazakhstan
Copper production: 740,000 metric tons
In 2024, Kazakhstan produced 740,000 metric tons of copper, on par with 2023’s production totals. Although its production was unchanged year-over-year, the country entered the top 10 copper producers list this year, leapfrogging over Mexico and Zambia.
Kazakhstan's copper output is up substantially compared to just a few years ago, with the country producing just 510,000 MT in 2021.
The nation plans to continue that trend, releasing a National Development Plan in February 2024 that aims to increase mineral production by 40 percent by 2029. The plan will involve increased exploration, project co-financing and tax incentives for investment.
Among the country’s largest mining companies is private firm KAZ Minerals, which owns the Aktogay mine. According to the company’s Q4 2024 production report, the mine produced 228,800 metric tons of copper during the year, a decline from the 252,400 MT produced in 2023.
10. Mexico
Copper production: 700,000 metric tons
Rounding out our list of top copper producers, Mexico produced 700,000 metric tons of copper in 2024, just 1,000 MT above its 2023 output.
The Buenavista del Cobre mine in Sonora, owned by Grupo Mexico (BMV:GMEXICOB), is the largest copper mine in the country. According to MDO data, the mine produced 725 million pounds of copper concentrate and 193 million pounds of copper cathode in 2023.
In addition, Grupo Mexico also owns Mexico’s second-largest copper mine, La Caridad, which produced 387,000 MT of copper concentrate and 51 million pounds of copper cathode in 2023.
Don’t forget to follow us @INN_Resource for real-time updates!
Securities Disclosure: I, Dean Belder, hold no direct investment interest in any company mentioned in this article.
Issue of shares and cleansing notice
Application for quotation of securities - ANX
Top 5 Canadian Mining Stocks This Week: Minsud Resources Up 47 Percent on Maiden Resource
Welcome to the Investing News Network's weekly look at the best-performing Canadian mining stocks on the TSX, TSXV and CSE, starting with a round-up of Canadian and US news impacting the resource sector.
Statistics Canada released its January consumer price index (CPI) figures on Tuesday (February 18). The data showed that inflation ticked up on a yearly basis to 1.9 percent from the 1.8 percent recorded in December. On a monthly basis, CPI rose 0.1 percent in January following a 0.4 percent decline in December.
The rise in inflation was owed to a 5.3 percent increase in energy prices on an annualized basis, primarily gasoline and natural gas, after recording a more modest 1 percent gain the previous month. Headlining the gains was an 8.6 percent jump in gasoline prices versus the same period last year and a 3.5 percent increase over December.
The agency also released its December mineral production survey on Thursday (February 20). The report showed overall increases in copper, gold and silver production and shipments compared to November’s totals.
Copper production increased by over 5 million kilograms to 38.93 million kilograms in December, up from 33.23 million kilograms the prior month. Shipments saw a similar increase, with 49.17 million kilograms shipped compared to 44.6 million kilograms shipped in November.
Gold production increased to 17,325 kilograms from 16,573 kilograms in November. Meanwhile, shipments of the precious metal increased even more, coming in at 23,217 kilograms compared to 14,332 kilograms in November.
As for silver, December saw the highest production and shipment levels for silver in 2024. Silver production increased to 33,074 kilograms, up significantly month-over-month from 24,959 kilograms. Silver shipments jumped even more at 36,984 kilograms, a considerable uptick from November’s 23,709 kilograms.
In mining news, Anglo American (LSE:AAL,OTCQX:AAUKF) announced that its 50.1 percent owned subsidiary Anglo American Sur and Chilean state mining company Codelco signed a memorandum of understanding to create a framework for implementing a joint mining plan for the companies’ adjacent Los Bronces and Andina mines in Chile.
Anglo American says the new operating company will optimize the use of processing capacity between the two mines. The companies expect that the mines will produce an additional 2.7 million metric tons of copper over a 21-year period starting in 2030, and generate an additional US$5 billion in pre-tax value. The companies will retain full ownership of their respective properties.
Markets and commodities react
US equity markets were broadly down this week, with the S&P 500 (INDEXSP:INX) losing 1.67 percent to end Friday (February 21) at 6,013.12 and the Nasdaq-100 (INDEXNASDAQ:NDX) falling 1.93 percent to 21,614.08. The Dow Jones Industrial Average (INDEXDJX:.DJI) sank the furthest, down 2.89 percent to 43.428.03.
In Canada, markets were also in decline. The S&P/TSX Venture Composite Index (INDEXTSI:JX) fell 2.48 percent on the week to close at 634.69 on Friday, the S&P/TSX Composite Index (INDEXTSI:OSPTX) posted a 2.15 percent loss to hit 25,147.03 and the CSE Composite Index (CSE:CSECOMP) dropped 2.59 percent to 132.46.
After hitting new all-time highs on Wednesday, the gold price remained in record territory on Friday, seeing a 1.78 percent increase on the week to close at US$2,934.24 per ounce at 4:00 p.m. EST. Silver also saw gains this week, moving up 1.22 percent to US$32.52.
In base metals, the copper price was in decline this week, shedding 2.13 percent throughout the week to close at US$4.59 per pound on the COMEX. Meanwhile, the S&P GSCI (INDEXSP:SPGSCI) was flat, shedding 0.08 percent to close at 569.41.
Top Canadian mining stocks this week
So how did mining stocks perform against this backdrop?
We break down this week’s five best-performing Canadian mining stocks below.
Data for this article was retrieved at 3:00 p.m. EST on Friday using TradingView's stock screener. Only companies trading on the TSX, TSXV and CSE with market capitalizations greater than C$10 million are included. Companies within the non-energy minerals and energy minerals sectors were considered.
1. Minsud Resources (TSXV:MSR)
Weekly gain: 47.06 percent
Market cap: C$156.7 million
Share price: C$1
Minsud Resources is a copper exploration company focused on advancing its operations in Argentina.
Its flagship project, Chita Valley, is located in San Juan and covers 19,883 hectares. The area hosts widespread porphyry copper-molybdenum-silver-gold mineralization and includes three core properties: the Chita, Brechas Vacas and the Minas de Pinto mineral concessions. Minsud’s primary target is its Chinchillones deposit.
Shares in Minsud saw recent gains following the release of a technical report for Chita Valley on February 14 reporting its January maiden mineral resource estimate (MRE) for the Chinchillones deposit. The deposit’s total indicated resource is 188 million metric tons (MT) of ore containing 466,000 MT of copper, 674,000 ounces of gold, 63.5 million ounces of silver, 6,800 MT of molybdenum and 291,000 MT of zinc.
The deposit also hosts an inferred resource of 573 million MT of ore containing 1.24 million MT of copper, 1.65 million ounces of gold, 166.6 million ounces of silver, 53,200 MT of molybdenum and 616,000 MT of zinc.
2. Kapa Gold (TSXV:KAPA)
Weekly gain: 32 percent
Market cap: C$11.58 million
Share price: C$0.165
Kapa gold is an exploration company focused on advancing the past-producing Blackhawk mine in San Bernardino County, California.
The project site is composed of seven patented and 178 contiguous federal lode claims covering 1,496.2 hectares. The property hosts multiple mineralized zones with previous exploration work revealing deposits with high grade gold, silver, lead and zinc. Historic production has seen grading from ramps and underground mines averaging 10 grams per metric ton (g/t) gold.
Kapa has not released news since January 7, when it announced that it was advancing baseline studies and surface exploration at Blackhawk. The company said the work was being conducted in preparation for a 2025 drill program, with data gathered being used to identify drill targets.
3. Power Metals (TSXV:PWM)
Weekly gain: 31.03 percent
Market cap: C$160.67 million
Share price: C$1.14
Power Metals is a lithium and cesium exploration company focused on its Case Lake project.
Located in Northeastern Ontario, the site is 10 kilometers by 9.5 kilometers in size and comprises 585 cell claims. Exploration at the site between 2017 and 2024 led to the discovery of pegmatite dykes bearing lithium, cesium and tantalum (LCT). Case Lake now consists of six spodumene dykes that form a mineralization trend of about 10 kilometers.
Assays from the site released on February 14 included a highlight of 8.07 meters grading 2.19 percent lithium oxide, 5.19 percent cesium oxide and 1,438 parts per million (ppm) tantalum. The results also included a 1 meter intersection bearing 1.85 percent lithium oxide, 11.7 percent cesium oxide and 208 ppm tantalum.
In addition to its most recent exploration news, Power Metals announced on February 10 that it had brought on DRA Global to begin work on a maiden mineral resource estimate and preliminary economic assessment for the Case Lake project. It expects to have the former completed by the end of Q1 2025, with the latter to follow in Q2.
Adding to Power Metals' recent share gains was a release on February 5 in which the company reported that it had been awarded a new exploration permit for Case Lake. The new permit will remain valid for the next three years and will be used to target newly identified cesium targets uncovered in late 2024.
While the company did not release news this week, it continued its upward trend from recent weeks.
4. Minco Silver (TSXV:MSV)
Weekly gain: 29.73 percent
Market cap: C$12.82 million
Share price: C$0.24
Minco Silver is a development company working to advance its Fuwan silver project in China’s Guangdong province.
The property consists of three exploration permits covering a total of 125.74 square kilometers. Exploration to date has largely been focused on an area hosting 2.8 kilometers by 10 kilometers of strike.
A 2009 feasibility study for the property included a total probable reserve estimate of 55.3 million ounces of silver across 9.12 million metric tons of ore with an average grade of 189 g/t.
Shares in Minco have seen gains this past week but the company has not released news.
5. K2 Gold (TSXV:KTO)
Weekly gain: 29.03 percent
Market cap: C$24.65 million
Share price: C$0.18
K2 Gold is a gold exploration and development company with a portfolio of three assets located in Canada and the United States.
The company’s Wels project in Canada is composed of 351 contiguous quartz claims covering 7,200 hectares near Beaver Creek, Yukon. According to the project page, K2 says the deposit is similar to Newmont’s (TSX:NGT,NYSE:NEM) nearby 4 million ounce Coffee gold deposit.
In the US, K2 owns its flagship Mojave gold project in Inyo County, California, which covers 5,830 hectares with 12 exploration targets. In addition to gold, Mojave also contains mineralization of copper, silver, lead and zinc.
The company’s final asset is the Si2 gold project in Esmeralda County, Nevada, US. The site consists of 118 Bureau of Land Management lode claims covering 986 hectares in the Walker Land trend. Exploration has indicated gold-bearing mineralization, with concentrated veins hosted by fault structures at depth.
On January 17, K2 announced that it signed an agreement with Orogen Royalties (TSXV:OGN) to accelerate its acquisition of a 100 percent stake in the Si2 project.
The new deal will see K2 pay Orogen C$250,000 in cash or common shares and a 2 percent net smelter return royalty to immediately acquire the property, replacing a January 2022 deal in which K2 had to make US$200,000 in cash payments and C$2.3 million in exploration expenditures.
The release also included results from an alteration study on Si2 drill core that determined the presence of an intact, low-sulfidation epithermal gold system.
K2 said the acquisition “allows us the flexibility to advance the project at our own pace as we approach the final steps in permitting at K2’s flagship Mojave project.
The Company’s most recent news came on February 21, when it said it had increased its previously announced non-brokered private placement to C$3 million in capital through the sale of 20 million units at a price of C$0.15 per share. The funds will be used for exploration and permitting at the Mojave gold project.
FAQs for Canadian mining stocks
What is the difference between the TSX and TSXV?
The TSX, or Toronto Stock Exchange, is used by senior companies with larger market caps, and the TSXV, or TSX Venture Exchange, is used by smaller-cap companies. Companies listed on the TSXV can graduate to the senior exchange.
How many companies are listed on the TSXV?
As of June 2024, there were 1,630 companies listed on the TSXV, 925 of which were mining companies. Comparatively, the TSX was home to 1,806 companies, with 188 of those being mining companies.
Together the TSX and TSXV host around 40 percent of the world’s public mining companies.
How much does it cost to list on the TSXV?
There are a variety of different fees that companies must pay to list on the TSXV, and according to the exchange, they can vary based on the transaction’s nature and complexity. The listing fee alone will most likely cost between C$10,000 to C$70,000. Accounting and auditing fees could rack up between C$25,000 and C$100,000, while legal fees are expected to be over C$75,000 and an underwriters’ commission may hit up to 12 percent.
The exchange lists a handful of other fees and expenses companies can expect, including but not limited to security commission and transfer agency fees, investor relations costs and director and officer liability insurance.
These are all just for the initial listing, of course. There are ongoing expenses once companies are trading, such as sustaining fees and additional listing fees, plus the costs associated with filing regular reports.
How do you trade on the TSXV?
Investors can trade on the TSXV the way they would trade stocks on any exchange. This means they can use a stock broker or an individual investment account to buy and sell shares of TSXV-listed companies during the exchange's trading hours.
Article by Dean Belder; FAQs by Lauren Kelly.
Don't forget to follow us @INN_Resource for real-time updates!
Securities Disclosure: I, Dean Belder, hold no direct investment interest in any company mentioned in this article.
Securities Disclosure: I, Lauren Kelly, hold no direct investment interest in any company mentioned in this article.
Teck Resources Reports Record Copper Production, Reassures Investors Amid Tariff Uncertainty
Teck Resources (TSX:TECK.A,TSX:TECK.B,NYSE:TECK) closed out 2024 with record copper production and strong financial results, despite ongoing trade uncertainties that could impact its operations.
The Vancouver-based mining giant released its unaudited Q4 results on Thursday (February 20), reporting adjusted EBITDA of C$835 million for the period, driven primarily by increased copper and zinc sales and robust metal prices.
"2024 was a transformational year as we repositioned Teck as a pure-play energy transition metals company with the sale of the steelmaking coal business and record annual copper production," said President and CEO Jonathan Price.
He highlighted Quebrada Blanca's performance, as well as 2024's C$1.8 billion in share buybacks and dividends.
In addition to hitting an annual record, Teck achieved its third consecutive quarter of record copper output in Q4.
The company produced 122,100 metric tons of copper in Q4, bringing its total for 2024 to 446,000 metric tons — up 50 percent from the previous year. Chile's Quebrada Blanca contributed 60,700 metric tons in the fourth quarter alone.
Teck's copper business generated C$732 million in gross profit before depreciation and amortization in Q4, up 160 percent year-on-year. Gross profit from the segment was C$299 million for the fourth quarter.
Red Dog contributed to a 24 percent year-on-year increase in zinc sales volume for Q4. The zinc business reported gross profit before depreciation and amortization of C$320 million in Q4, a 112 percent rise from a year ago.
Financially, Teck’s profit from continuing operations before taxes reached C$256 million for the quarter, while adjusted profit from continuing operations attributable to shareholders was C$232 million, or C$0.45 per share.
The company also reported a significant strengthening of its financial position.
Liquidity stood at C$11.3 billion as of Wednesday (February 19), including C$7.1 billion in cash. Teck also reduced its debt by C$196 million in the fourth quarter and by C$1.8 billion over the full year.
Price talks tariffs and Glencore collaboration
As the US continues to consider 25 percent tariffs on Canada, Price assured investors that the proposed levies, which remain on hold until at least March 4, would have minimal impact on Teck’s core business.
"Globally, we are witnessing a period of significant economic uncertainty and change that will alter trade flows and potentially impact global supply chains and market dynamics," he said in a conference call.
"Teck has a resilient business driven by the diversification of our products and operations," he added.
Price also noted that the company exports the bulk of its copper and zinc concentrates to Asia and Europe, shielding it from the most significant effects of the proposed tariffs.
BC Premier David Eby has urged the US to reconsider its tariff stance, pointing to Teck’s Trail smelter, which is located in the province, as a crucial supplier of rare and strategic metals.
"If the United States doesn’t get this metal from the Teck smelter in Trail, it’s not available at all," he said in January.
Teck’s Trail refinery produces zinc, lead and specialty metals such as germanium and indium, which are used in advanced electronics and military applications.
In the same conference call, Price expressed openness to a collaboration with Swiss mining giant Glencore (LSE:GLEN,OTC Pink:GLCNF). Glencore previously attempted a full takeover of Teck in 2023, but ultimately acquired only its coal business. Now discussions have emerged around a possible partnership in Chile, where Teck’s Quebrada Blanca mine and Glencore’s Collahuasi mine operate in close proximity.
Teck owns 60 percent of Quebrada Blanca, which recently underwent an expansion. While it is now up and running, it faced cost overruns and operational challenges during its ramp-up phase.
Don’t forget to follow us @INN_Resource for real-time news updates!
Securities Disclosure: I, Giann Liguid, hold no direct investment interest in any company mentioned in this article.
Electric Royalties Announces Interest Conversion Under Convertible Credit Facility
Electric Royalties Ltd. (TSXV:ELEC)(OTCQB:ELECF) ("Electric Royalties" or the "Company") announces that Gleason & Sons LLC (the "Lender") has elected to convert C$428,540.40 of accrued interest on the principal amount of the Company's convertible credit facility (the "Interest") under the amended and restated convertible loan agreement dated February 16, 2024 between the Lender and Company (the "A&R Agreement"), into 3,174,373 common shares of the Company (the "Conversion Shares"), at a conversion price of C$0.135 per Conversion Share (the "Interest Conversion"). Subject to acceptance of the TSX Venture Exchange (the "TSXV"), the Company expects to issue the Conversion Shares in February 2025.
The Interest Conversion is treated as a "Shares for Debt" transaction under Policy 4.3 of the TSX Venture Exchange (the "TSXV"), and the Interest shall be settled in consideration for the Conversion Shares, upon the terms of the A&R Agreement. Completion of the Interest Conversion is subject to the approval of the TSX Venture Exchange. All of the Conversion Shares issuable in connection with the Interest Conversion will bear applicable resale legends restricting the transfer of said Conversion Shares, including for a period of four months and one day from the distribution date under Canadian securities laws, and for a period of six months under U.S. securities laws.
The "related party transaction" requirements under Policy 5.9 of the TSXV and Multilateral Instrument 61-101 - Protection of Minority Security Holders in Special Transactions ("MI 61-101") do not apply as the Interest Conversion meets the exemption set forth under Section 5.1(h)(iii) of MI 61-101.
About Electric Royalties Ltd.
Electric Royalties is a royalty company established to take advantage of the demand for a wide range of commodities (lithium, vanadium, manganese, tin, graphite, cobalt, nickel, zinc and copper) that will benefit from the drive toward electrification of a variety of consumer products: cars, rechargeable batteries, large scale energy storage, renewable energy generation and other applications.
Electric vehicle sales, battery production capacity and renewable energy generation are slated to increase significantly over the next several years and with it, the demand for these targeted commodities. This creates a unique opportunity to invest in and acquire royalties over the mines and projects that will supply the materials needed to fuel the electric revolution.
Electric Royalties has a growing portfolio of 42 royalties in lithium, vanadium, manganese, tin, graphite, cobalt, nickel, zinc and copper across the world. The Company is focused predominantly on acquiring royalties on advanced stage and operating projects to build a diversified portfolio located in jurisdictions with low geopolitical risk, which offers investors exposure to the clean energy transition via the underlying commodities required to rebuild the global infrastructure over the next several decades toward a decarbonized global economy.
For further information, please contact:
Brendan Yurik
CEO, Electric Royalties Ltd.
Phone: (604) 364‐3540
Email: Brendan.yurik@electricroyalties.com
https://www.electricroyalties.com/
Neither the TSX Venture Exchange nor its Regulation Services Provider (as that term is defined in the policies of the TSX Venture Exchange), nor any other regulatory body or securities exchange platform, accepts responsibility for the adequacy or accuracy of this release.
Cautionary Statements Regarding Forward-Looking Information and Other Company Information
This news release includes forward-looking information and forward-looking statements (collectively, "forward-looking information") with respect to the Company within the meaning of Canadian securities laws. This news release includes information regarding other companies and projects owned by such other companies in which the Company holds a royalty interest, based on previously disclosed public information disclosed by those companies and the Company is not responsible for the accuracy of that information, and that all information provided herein is subject to this Cautionary Statement Regarding Forward-Looking Information and Other Company Information. Forward looking information is typically identified by words such as: believe, expect, anticipate, intend, estimate, postulate and similar expressions, or are those, which, by their nature, refer to future events. This information represents predictions and actual events or results may differ materially. Forward-looking information may relate to the Company's future outlook and anticipated events and may include statements regarding the financial results, future financial position, expected growth of cash flows, business strategy, budgets, projected costs, projected capital expenditures, taxes, plans, objectives, industry trends and growth opportunities of the Company and the projects in which it holds royalty interests.
While management considers these assumptions to be reasonable, based on information available, they may prove to be incorrect. Forward-looking statements involve known and unknown risks, uncertainties and other factors which may cause the actual results, performance or achievements of the Company or these projects to be materially different from any future results, performance or achievements expressed or implied by the forward-looking statements. These risks, uncertainties and other factors include, but are not limited to risks associated with general economic conditions; adverse industry events; marketing costs; loss of markets; future legislative and regulatory developments involving the renewable energy industry; inability to access sufficient capital from internal and external sources, and/or inability to access sufficient capital on favourable terms; the mining industry generally, recent market volatility, income tax and regulatory matters; the ability of the Company or the owners of these projects to implement their business strategies including expansion plans; competition; currency and interest rate fluctuations, and the other risks.
The reader is referred to the Company's most recent filings on SEDAR+ as well as other information filed with the OTC Markets for a more complete discussion of all applicable risk factors and their potential effects, copies of which may be accessed through the Company's profile page at sedarplus.ca and at otcmarkets.com.
Latest News
Latest Press Releases
Related News
TOP STOCKS
Investing News Network websites or approved third-party tools use cookies. Please refer to the cookie policy for collected data, privacy and GDPR compliance. By continuing to browse the site, you agree to our use of cookies.