Kairos Minerals

High-Grade Lithium Assays Confirm Significance of Spodumene-Bearing Pegmatite

Results of up to 1.91% Li2O just 4km from Pilbara Minerals’ Pilgangoora lithium-tantalum mine; Drilling being planned for September

Kairos Managing Director, Dr Peter Turner said: “The high-grade lithium results, combined with the confirmation of spodumene mineralogy, is a very exciting development.


Highlights

  • Five pegmatite samples from the Lucky Sump prospect at Mt York have returned exceptional assays including:
    • 1.91% Li2O & 103 ppm Ta (MYR393)
    • 1.56% Li2O & 115 ppm Ta (MYR401)
    • 0.58% Li2O & 167 ppm Ta (MYR396)
  • The spodumene-bearing pegmatite samples were discovered during routine earthmoving activities next to the flagship Mt York gold deposit
  • The spodumene pegmatites are part of a larger interpreted dyke swarm at Mt York
  • Planning underway to RC drill-test large area of Lucky Sump
“In light of these exceptional results, we plan to expedite planning to drill all of Lucky Sump. We intend to test the entire interpreted pegmatite dyke swarm, which is under cover, with the first RC drilling anticipated in September.

“We are in a Tier 1 destination for spodumene pegmatite projects with two world-class Li-Ta deposits (ASX:PLS, ASX:MRL) in the neighbourhood and we have demonstrated that we have the right fertile geology for significant Lithium-Caesium-Tantalum (LCT) pegmatite discoveries”.

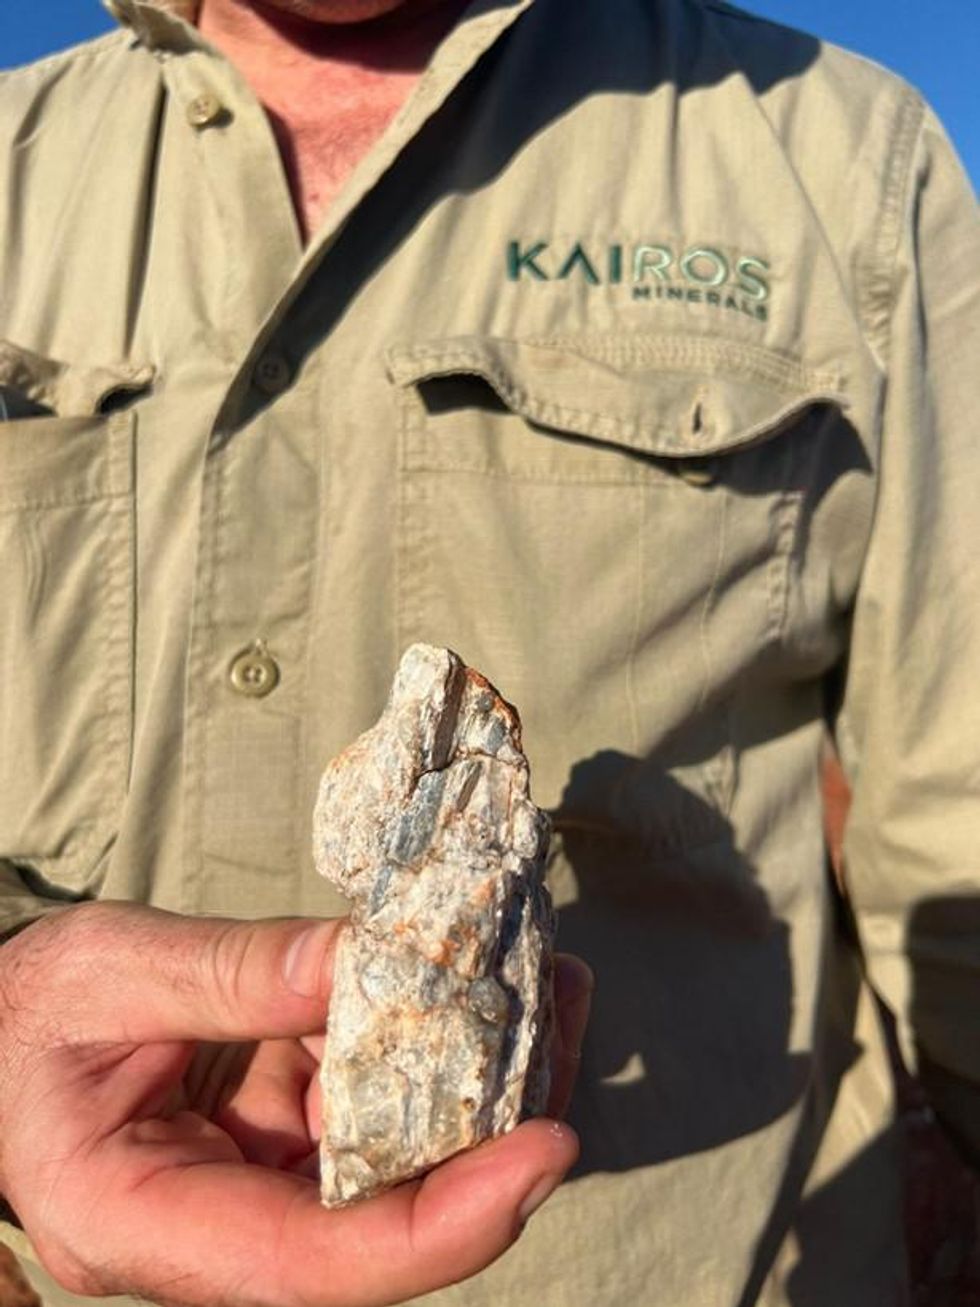
Figure 1. Kairos Geologist Campbell Watts holding a piece of spodumene-bearing pegmatite (MYR393 – 1.91% Li2O) discovered at ‘Lucky Sump’ during routine earth moving activities.

Five samples of pegmatites that were analysed by hyperspectral and XRD methods confirming the presence of spodumene mineralogy (see KAI Announcement dated 12 July 2022), were submitted to NAGROM Laboratories in Perth for chemical analysis. Photographs of the pegmatites are shown in Figure 2.

The samples were crushed and pulverised and a 200g subsample selected for Na-peroxide fusion with hydrochloric acid digestion. This method was selected as it is considered to be a complete dissolution of all resistate minerals they may contain the selected elements of interest. The analysis of the samples was conducted using inductively couple plasma mass spectrometry (ICP-MS) with the elements Li, Rb, Cs, Be, Mn, Fe, Ti and Ta selected. The results are shown in Table 1.

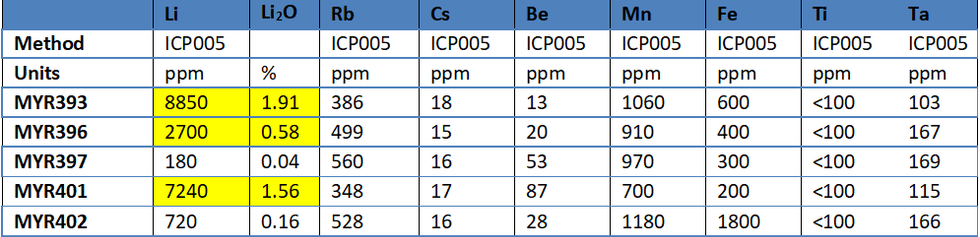
Table 1. Assay results from NAGROM Laboratory, Perth. Conversion of Li ppm results to Li2O involves a two-step process to divide the Li ppm result by 10,000 (conversion to Li %) and multiplying Li % by 2.153 to obtain the Li2O equivalent. Method ICP005 refers to NAGROM’s Inductively coupled plasma mass spectrometry analysis code.

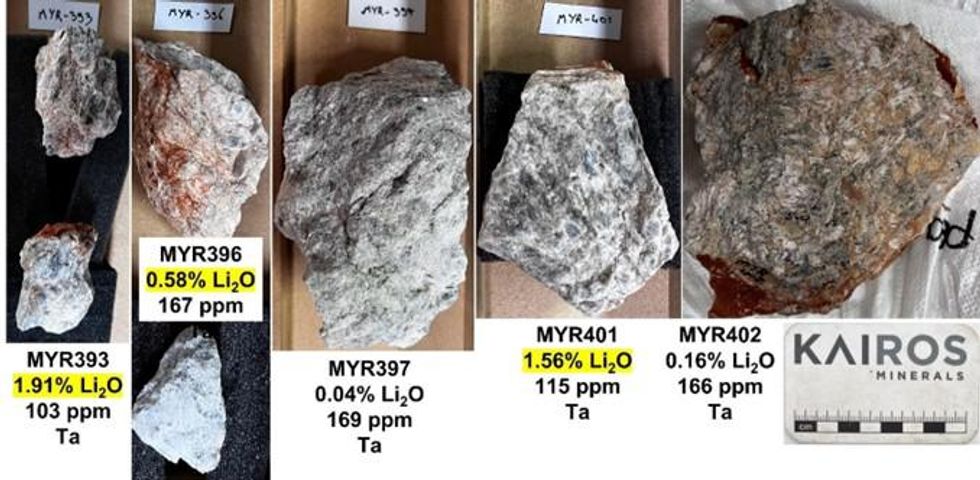
Figure 2. Lucky Sump pegmatite samples showing lithium and tantalum results.


Click here for the full ASX Release

This article includes content from Kairos Minerals, licensed for the purpose of publishing on Investing News Australia. This article does not constitute financial product advice. It is your responsibility to perform proper due diligence before acting upon any information provided here. Please refer to our full disclaimer here.

KAI:AU
The Conversation (0)
Kairos Minerals

Kairos Minerals

Developing Highly Prospective Gold Projects in a World-Class Gold District

Developing Highly Prospective Gold Projects in a World-Class Gold District Keep Reading...
Gold and silver bars in scale with green arrow pointing up. Text reads: "Weekly Editor’s Picks."

Editor's Picks: Gold, Silver Prices Gain Ground, Oil Trades Face Scrutiny

The gold price caught a tailwind this week as tensions between the US and Iran eased, first breaking US$4,600 per ounce and then pushing well above US$4,700.Silver was also on the move, briefly passing US$82 per ounce.The situation in the Middle East remains fluid, but at the time of this... Keep Reading...
Gold bars with financial chart overlay, showcasing market trends.

Top Gold Producers Log Record Q1 Margins Despite Price Swings

Following a chaotic first quarter that saw gold prices shatter the US$5,000 per ounce barrier before suffering a historic collapse, the world’s top gold producers delivered a string of record financial results. The first quarter of 2026 brought severe whiplash to the gold market. Driven by... Keep Reading...
Chris Temple, gold bars.

Chris Temple: Gold's Next Leg Up — Price Trigger, Key Headwinds

Chris Temple, founder, editor and publisher of the National Investor, shares his outlook for the gold price, explaining why it could still fall as low as US$3,500 per ounce. He also discusses what will trigger the yellow metal's next leg higher.Don't forget to follow us @INN_Resource for... Keep Reading...
Mini cart with gold bars on wooden surface, dark background.

WGC: Gold Demand Faces East/West Divide in Q1 2026

A strong gold price and steady demand for safe-haven assets led to record gold demand value in the first quarter of the year, according to the World Gold Council’s (WGC) latest report.The WGC published its latest Gold Demand Trends report on April 29, highlighting that investor and central bank... Keep Reading...
Gold map of the world over black background.

10 Largest Producers of Gold by Country

With gold prices surging to new all-time highs at the start of 2026, the top gold-producing countries are set to benefit significantly from a runaway bull market. After surging more than 80 percent since January 2025, the market's momentum peaked on January 28, when gold reached an all-time high... Keep Reading...

Interactive Chart

Latest Press Releases

Related News