
April 22, 2025
Sitka Gold Corp. (TSXV: SIG) (FSE: 1RF) (OTCQB: SITKF) ("Sitka" or the "Company") is pleased to announce recently received assay results from its ongoing 2025 diamond drilling campaign at its road accessible RC Gold Project ("RC Gold" or the "Project") located approximately 100 km east of Dawson City in Yukon's prolific Tombstone Gold Belt. Results from DDRCCC-25-075 ("Hole 75") returned 352.8 metres of 1.55 g/t gold, including 108.9 metres of 3.27 g/t gold and 45.0 metres of 4.52 g/t gold. Hole 75, which had over 130 instances of visible gold observed during logging of the drill core, was the first of two diamond drill holes completed at RC Gold during this year's winter drilling campaign. DDRCCC-25-076 ("Hole 76"), the second drill hole completed this winter, was drilled to a depth of 810.8 metres, the deepest hole ever drilled at Blackjack, for a total of 1,526.8 metres of diamond drilling completed during the winter drilling campaign. Assays are currently pending for Hole 76 where over 60 instances of visible gold were observed (see Figures 1 and 7).
- DDRCC-25-075 ("Hole 75") delivers best high-grade intercept drilled to date at Blackjack with 352.8 m of 1.55 g/t gold including 108.9 m of 3.27 g/t gold and 45.0 m of 4.52 g/t gold
- Hole 75 is the first diamond drill hole to be completed as part of a fully funded 30,000 m drilling program planned at RC Gold for 2025
- Results from Hole 75 extend the high-grade gold zone discovered late last year in Hole 68
- Assay results from Hole 75 showcase the persistence and continuity of this higher-grade gold zone (see Table 3) with grades that appear to be increasing with depth
- These results further endorse a potential underground mining scenario below Blackjack's existing pit-constrained mineral resources of 1.29 Moz grading 1.01 g/t gold indicated and 1.04 Moz grading 0.94 g/t gold inferred
- Assays are currently pending for DDRCCC-25-076 ("Hole 76") which was drilled to a hole depth of 810.8 m, the deepest hole drilled to date at Blackjack, and had over 60 instances of visible gold observed in the drill core (see Figures 1 and 7).
Table 1: Highlights from most recent assay results
Hole ID | From (m) | To (m) | Interval (m)* | Gold (g/t) |
DDRCCC-25-075 | 341.5 | 694.3 | 352.8 | 1.55 |
including | 501.4 | 610.3 | 108.9 | 3.27 |
including | 501.4 | 513.0 | 11.6 | 4.44 |
and | 539.4 | 584.4 | 45.0 | 4.52 |
*Intervals are drilled core length as insufficient drilling has been completed at this time to calculate true widths.
"2025 is off to an excellent start with the first drill hole of the year producing some of the best gold intercepts encountered to date at our RC Gold project," commented Cor Coe, Director and CEO of Sitka Gold. "Initial observations of Hole 75, including numerous instances of visible gold, indicated that we had drilled through an area of strong gold mineralization and this has now been confirmed by these assay results. Hole 75 continues to highlight the quality of the gold system present at the Blackjack deposit while greatly expanding the higher-grade gold zone discovered at depth late last year in Hole 68 which remains open both laterally and to depth. The increasing gold values we are seeing at depth appear to have the grades and continuity required for a possible underground extraction scenario below the current pit constrained resources at Blackjack and suggest that we could be getting closer to the source of the Blackjack gold deposit as we drill deeper into the system.
"These results build on our previous success at Blackjack and show that we have really just started to unlock the potential of this large, contiguous 431 square kilometre gold district where 11 intrusions have been identified on surface to date, all of which have associated intrusion related gold mineralization present and are considered high-priority targets for future exploration. The fact that we have been able to produce a pit-constrained mineral resource estimate of 1.3 million ounces of indicated gold at 1.01 g/t gold and 1.0 million ounces of inferred gold at 0.94 g/t gold at the Blackjack deposit with just 18,799 metres of drilling underscores the potential of the additional 30,000 metres of drilling planned at RC Gold for this year. We are now waiting on the results from hole 76, which again produced multiple instances of visible gold and extended the vertical depth of mineralization at the Blackjack zone to over 700 metres from surface, being the deepest drill hole completed to date at the RC Gold project. 2025 is shaping up as an exciting and pivotal year for Sitka as we push to continue creating shareholder value by rapidly advancing our flagship RC Gold project."
Figure 1: Cross Section for holes DDRCCC-25-075 and DDRCCC-25-076. Hole 75 is approximately a 70 metre step-out from Hole 68 which intersected 93.0 m of 2.57 g/t gold near the bottom of the hole.
To view an enhanced version of this graphic, please visit:
https://images.newsfilecorp.com/files/6144/249328_bf622703d4b8c841_002full.jpg
Figure 2: Plan map of drilling at the Blackjack Deposit showing the location of holes DDRCCC-25-075 (this release), -076 as well as DDRCCC-24-068.
To view an enhanced version of this graphic, please visit:
https://images.newsfilecorp.com/files/6144/249328_bf622703d4b8c841_003full.jpg
Figure 3: The Clear Creek Intrusive Complex in the western portion of the RC Gold Project is a cluster of intrusions all with known gold mineralization and numerous current drill target areas highlighted by the magenta hatched areas.
To view an enhanced version of this graphic, please visit:
https://images.newsfilecorp.com/files/6144/249328_bf622703d4b8c841_004full.jpg
Figure 4: Longitudinal section of completed drill holes at the Blackjack Zone. Higher-grade mineralization is defined in a southeast plunging mineralized corridor with gold grades increasing at depth, as observed with the increasing prevalence of higher-grade gold results in recently completed drill core (purple colour), and suggests that drilling is vectoring towards the source of this gold system. The pit-constrained mineral resource shell from the 2023 MRE is shown in orange with the added resources from the updated MRE published earlier this year shown in yellow (see news release dated February 26, 2025).
To view an enhanced version of this graphic, please visit:
https://images.newsfilecorp.com/files/6144/249328_bf622703d4b8c841_005full.jpg
Figure 5: Examples of drill core from the interval beginning at 539.4 m which contains 45.0 m of 4.52 g/t gold that shows strongly altered and variably textured quartz monzonite. Pink flagging tape marks veins where occurrences of visible gold were noted by Sitka's geological crew.
To view an enhanced version of this graphic, please visit:
https://images.newsfilecorp.com/files/6144/249328_bf622703d4b8c841_006full.jpg
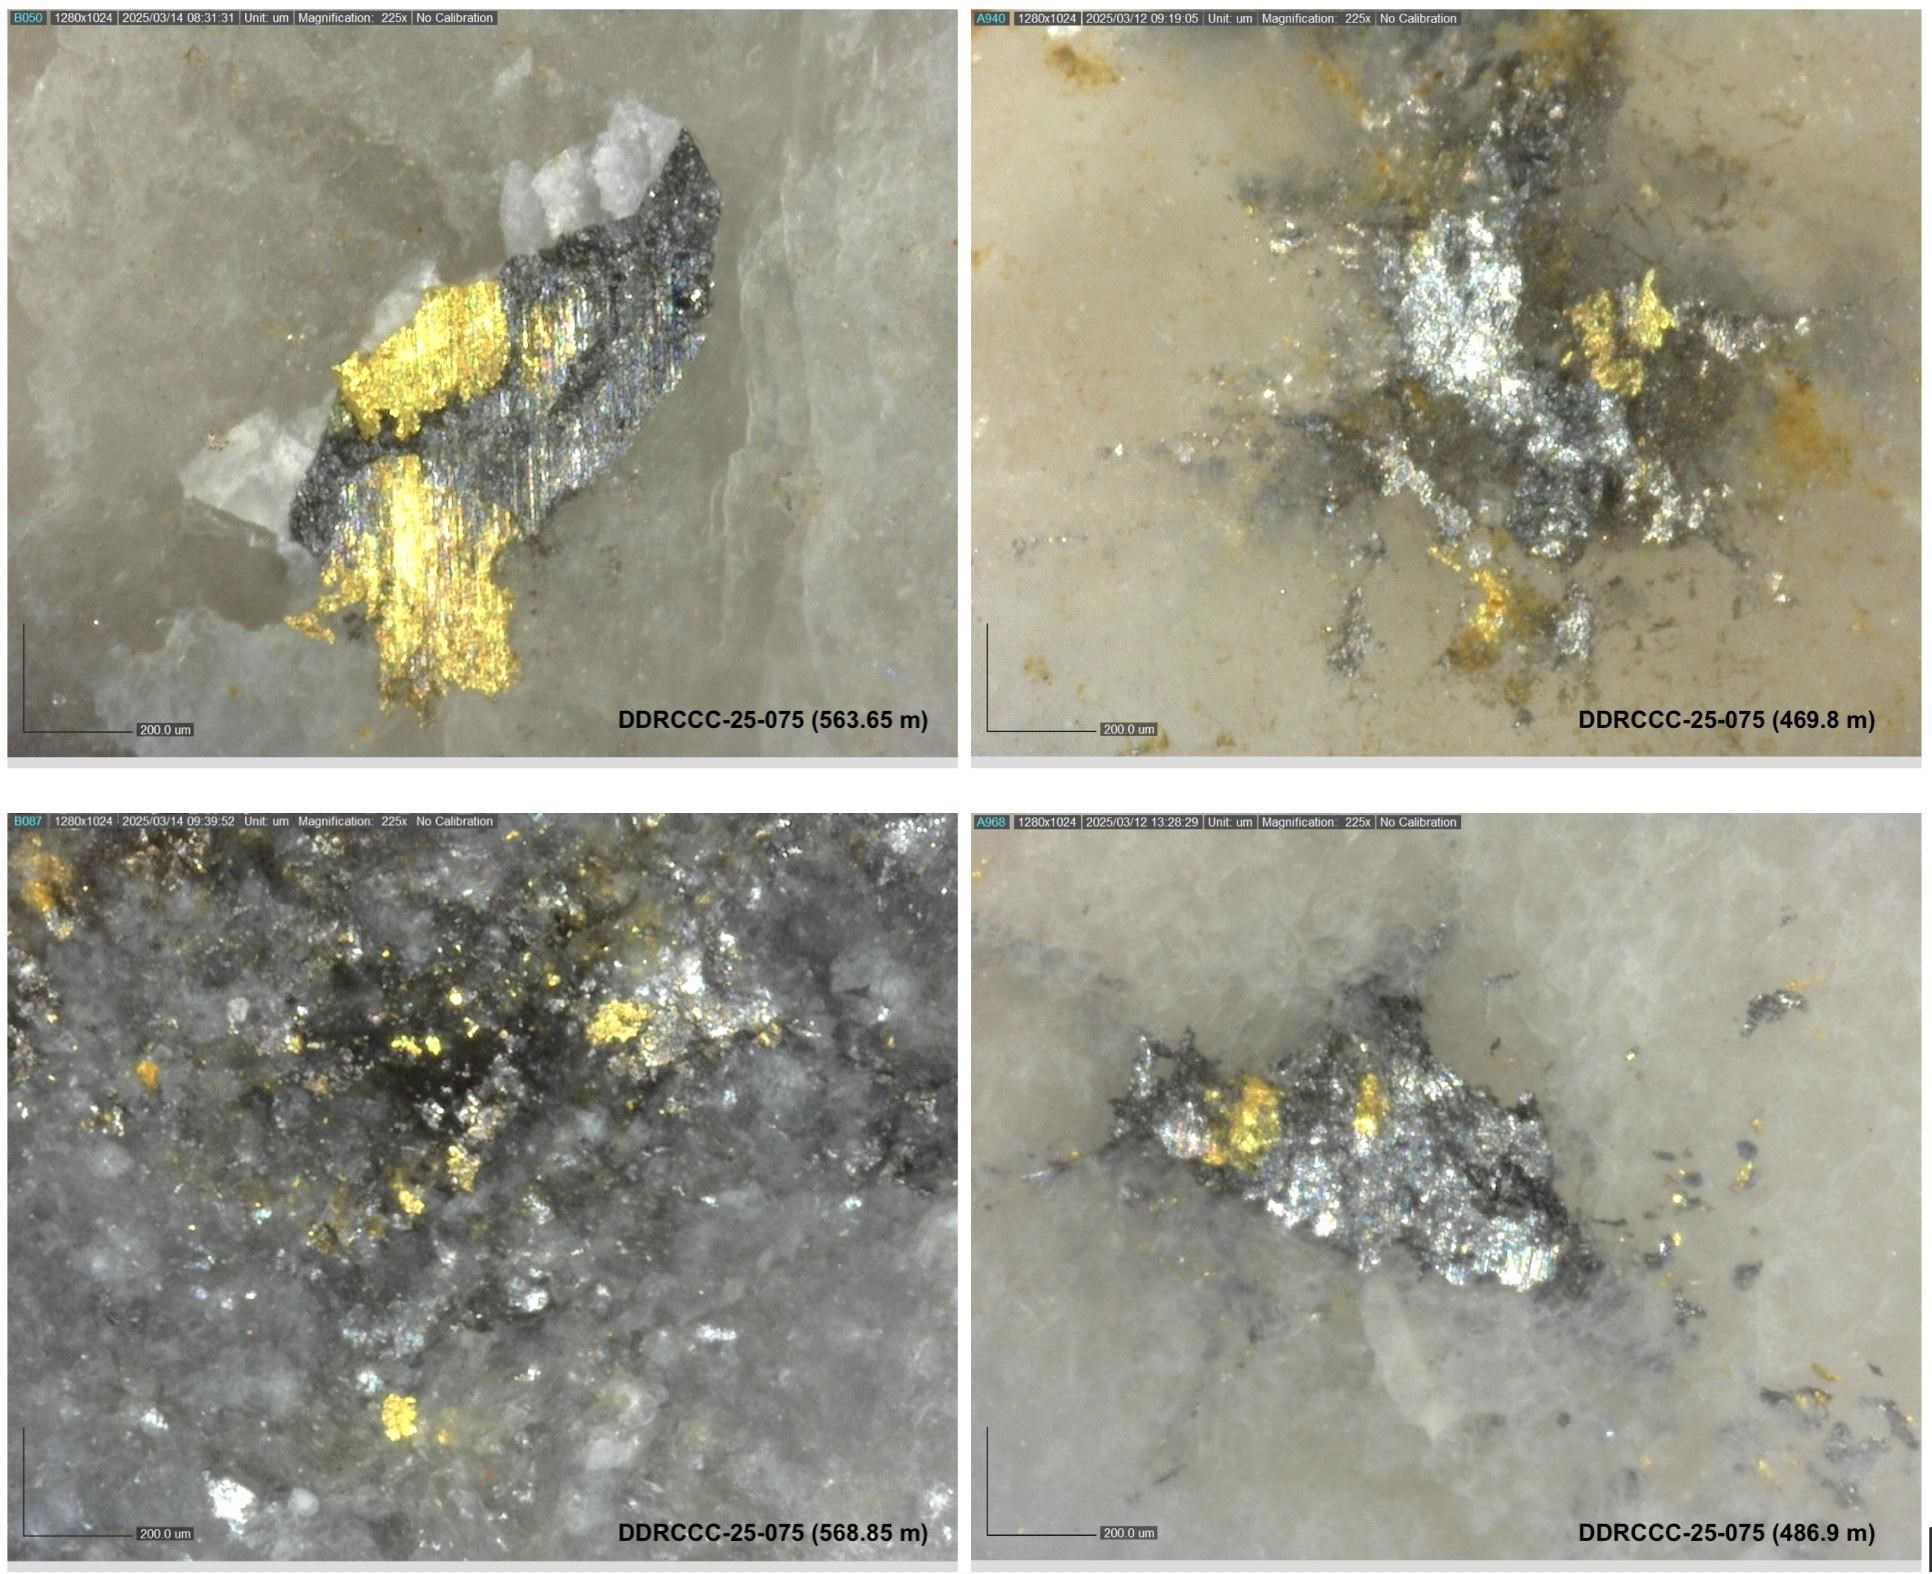
Figure 6: Examples of instances of visible gold observed throughout hole DDRCCC-25-075. Visible gold is found in sheeted quartz veins and is often associated with bismuthinite, scheelite, and arsenopyrite. Additional images of visible gold observed in Hole 75 can be viewed HERE.
To view an enhanced version of this graphic, please visit:
https://images.newsfilecorp.com/files/6144/249328_bf622703d4b8c841_007full.jpg
Table 2 - Summary of significant drill hole assays from this release
Hole ID | From (m) | To (m) | Length (m) | Gold (g/t) |
DDRCCC-25-075 | 116.3 | 123.0 | 6.7 | 2.21 |
including | 116.3 | 117.3 | 1.0 | 12.05 |
and | 341.5 | 694.3 | 352.8 | 1.55 |
including | 469.5 | 470.5 | 1.0 | 8.22 |
including | 407.0 | 694.3 | 287.3 | 1.80 |
including | 486.5 | 487.6 | 1.1 | 7.99 |
including | 409.5 | 694.3 | 284.8 | 1.82 |
including | 409.5 | 610.3 | 200.7 | 2.35 |
including | 501.4 | 610.3 | 108.9 | 3.27 |
including | 501.4 | 513.0 | 11.6 | 4.44 |
including | 504.4 | 505.4 | 1.0 | 8.73 |
including | 539.4 | 584.4 | 45.0 | 4.52 |
including | 556.4 | 558.0 | 1.6 | 9.71 |
including | 648.9 | 694.3 | 45.4 | 0.92 |
*Intervals are drilled core length as insufficient drilling has been completed at this time to calculate true widths.
DDRCCC-25-075
Drill hole DDRCCC-25-075 was drilled to a length of 715.97 metres at an azimuth of 037o and a dip of -65o to step out from the high-grade mineralization that returned 93.0 metres of 2.57 g/t gold starting at 589.5 metres in Hole 68 last year and extended gold mineralization at depth approximately 70 metres to the northeast of Hole 68. This drill hole intersected several broad zones of feldspar megacrystic, quartz monzonite cross cutting hornfels biotite schist of the Yuzesyu Formation. These intrusions, and locally the metasediments, are cut by abundant 1-2 centimetre sheeted quartz veins with centimetre scale quartz sericite alteration halos. A significant zone of strongly altered, variable textured quartz monzonite was intersected from ~350 m to 620 metres. Over 130 instances of visible gold were observed in sheeted quartz veins, often associated with bismuthinite, scheelite, and arsenopyrite throughout the interval, consistent with observations of mineral associations in all previous drilling.
Table 3 - Individual assay intervals for the composite 45 metres of 4.52 g/t gold in Hole 75 which demonstrate the continuous and persistent high-grade gold mineralization at depth
To view an enhanced version of this graphic, please visit:
https://images.newsfilecorp.com/files/6144/249328_bf622703d4b8c841_008full.jpg
Figure 7: Examples of instances of visible gold observed throughout hole DDRCCC-25-076. Visible gold is found in sheeted quartz veins and is often associated with bismuthinite, scheelite, and arsenopyrite. Additional images of visible gold observed in Hole 76 can be viewed HERE.
To view an enhanced version of this graphic, please visit:
https://images.newsfilecorp.com/files/6144/249328_sitkafig7.jpg
Quality Assurance/Quality Control
On receipt from the drill site, the HTW/NTW-sized drill core was systematically logged for geological attributes, photographed and sampled at Sitka's core logging facility. Sample lengths as small as 0.3 m were used to isolate features of interest, otherwise a default 2 m downhole sample length was used. Each sample is identified by a unique sample tag number which is placed in the bag containing the core to be assayed. Core was cut in half lengthwise along a predetermined line, with one-half (same half, consistently) collected for analysis and one-half stored as a record. Standard reference materials, blanks and duplicate samples were inserted by Sitka personnel at regular intervals into the sample stream. Bagged samples were placed in secure bins to ensure integrity during transport. They were delivered by Sitka personnel or a contract expeditor to ALS Laboratories' preparatory facility in Whitehorse, Yukon, with analyses completed in North Vancouver.
ALS is accredited to ISO 17025:2005 UKAS ref. 4028 for its laboratory analysis. Samples were crushed by ALS to over 70 per cent passing below two millimetres and split using a riffle splitter. One-thousand-gram splits were pulverized to over 85 per cent passing below 75 microns. Gold determinations are by fire assay with an inductively coupled plasma mass spectroscopy (ICP-AES) finish on 50 g subsamples of the prepared pulp (ALS code: Au-ICP-22). Any sample returning over 10 g/t gold was re-analyzed by fire assay with a gravimetric finish on a 50 g subsample (ALS code: Au-GRA21). In addition, a 51-element analysis was performed on a 0.5 g subsample of the prepared pulps by an aqua regia digestion followed by an inductively coupled plasma mass spectroscopy (ICP-MS) finish (ALS code: ME-MS41).
About the Flagship RC Gold Project
The RC Gold Project consists of a 431 square kilometre contiguous district-scale land package located in the heart of Yukon's Tombstone Gold Belt. The project is located approximately 100 kilometres east of Dawson City, which has a 5,000 foot paved runway, and is accessed via a secondary gravel road from the Klondike Highway which is usable year-round and is an approximate 2 hour drive from Dawson City. It is the largest consolidated land package strategically positioned mid-way between the Eagle Gold Mine and the past producing Brewery Creek Gold Mine.
The RC Gold Project now has pit-constrained mineral resources that are contained in two zones: the Blackjack and Eiger gold deposits with 1,291,000 ounces of gold grading 1.01 g/t gold in an indicated category and 1,044,000 ounces of gold grading 0.94 g/t gold in an inferred category at Blackjack and 440,000 ounces of gold grading 0.50 g/t gold in an inferred category at Eiger. These resource estimate numbers are supported by the recently updated technical report for RC Gold, prepared in accordance with NI 43-101 standards, entitled "Clear Creek Property, RC Gold Project NI 43-101 Technical Report Dawson Mining District, Yukon Territory", prepared by Ronald G. Simpson, P. Geo., of GeoSim Services Inc. with an effective date of January 21, 2025. This report is available on SEDAR+ (http://www.sedarplus.ca) and on the Company's website (www.sitkagoldcorp.com).
Both of these deposits begin at surface, are potentially open pit minable and amenable to heap leaching, with initial bottle roll tests indicating that the gold is not refractory and has high gold recoveries of up to 94% with minimal NaCN consumption (see News Release July 13, 2022).
As of the end of 2024, 72 diamond drill holes have been drilled into this system by the Company for a total of approximately 25,136 metres. Other targets drilled to date include the Saddle, Josephine, Rhosgobel and Pukelman zones. The resource expansion drilling in 2023 at Blackjack produced results of up to 219.0 m of 1.34 g/t gold Including 124.8 m of 2.01 g/t gold and 55.0 m of 3.11 g/t gold in drill hole DDRCCC-23-047 (see news release dated September 26, 2023) and in 2024 results of up to 678.1 metres of 1.04 g/t gold starting from surface in DDRCCC-24-068, including 409.5 metres of 1.36 g/t gold, 93.0 metres of 2.57 g/t gold and 5.5 metres of 17.59 g/t gold (see news release dated October 21, 2024).
A planned 30,000 metre diamond drilling program for 2025 is currently underway at RC Gold.
RC Gold Deposit Model
Exploration on the Property has mainly focused on identifying an intrusion-related gold system ("IRGS"). The Property is within the Tombstone Gold Belt which is the prominent host to IRGS deposits within the Tintina Gold Province in Yukon and Alaska. Notable deposits from the belt include: Fort Knox Mine in Alaska with current Proven and Probable Reserves of 230 million tonnes at 0.3 g/t gold (2.471 million ounces; Sims 2018)(1); Eagle Gold Mine with current Measured and Indicated Resources of 233 million tonnes at a grade of 0.57 g/t gold at the Eagle Main Zone (4.303 million ounces; Harvey et al, 2022)(2); the Brewery Creek deposit with current Indicated Mineral Resource of 22.2 million tonnes at a gold grade of 1.11 g/t (0.789 million ounces; Hulse et al. 2020)(3); the Florin Gold deposit with a current Inferred Mineral Resource of 170.99 million tonnes grading 0.45 g/t gold (2.47 million ounces; Simpson 2021)(4); the AurMac Project with an Inferred Mineral Resource of 347.49 million tonnes grading 0.63 gram per tonne gold (7.00 million ounces)(5) and the Valley Deposit, with a current Indicated Mineral Resource of 4.05 million oz gold at 1.66 g/t gold and an additional Inferred Mineral Resource of 3.26 million oz at 1.25 g/t gold(6). The technical and scientific information disclosed from neighboring properties does not necessarily apply to the current project or property being disclosed.
(1) Sims J. Fort Knox Mine Fairbanks North Star Borough, Alaska, USA National Instrument 43-101 Technical Report. June 11, 2018. https://s2.q4cdn.com/496390694/files/doc_downloads...
(2) Harvey N., Gray P., Winterton J., Jutras M., Levy M.,Technical Report for the Eagle Gold Mine, Yukon Territory, Canada. Victoria Gold Corp. December 31, 2022. https://vgcx.com/site/assets/files/6534/vgcx_-_202...
(3) Hulse D, Emanuel C, Cook C. NI 43-101 Technical Report on Mineral Resources. Gustavson Associates. May 31, 2020. https://minedocs.com/22/Brewery-Creek-PEA-01182022...
(4) Simpson R. Florin Gold Project NI 43-101 Technical Report. Geosim Services Inc. April 21, 2021. https://sedar.com/GetFile.do?lang=EN&docClass=24&i... d=4984158
(5) Thornton T., Jutras M., Malhotra D. Technical Report Aurmac Property Mayo Mining District, Yukon Territory, Canada. JDS Energy and Mining Inc. February 6, 2024. https://banyangold.com/site/assets/files/5251/bany...
(6) Burrell H., Redmond D.J., Haggarty P., Rogue Gold Project: NI 43-101 Technical Report and Mineral Resource Estimate, Yukon Territory, Canada. Snowline Gold Corp. May 15, 2024. https://snowlinegold.com
Upcoming Events
Sitka Gold will be attending and/or presenting at the following events*:
- 121 Mining Investment - London, England: May 12 - 13, 2025
- Canaccord Global Metals and Mining Conference - Henderson, NV: May 20 - 22, 2025
- Yukon Mining Alliance - Dawson City, Yukon: July 9 - 14, 2025
- Takestock Stampede - Calgary, AB: July 2, 2025
*All events are subject to change.
About Sitka Gold Corp.
Sitka Gold Corp. is a well-funded mineral exploration company headquartered in Canada with over $25 million in its treasury and no debt. The Company is managed by a team of experienced industry professionals and is focused on exploring for economically viable mineral deposits with its primary emphasis on gold, silver and copper mineral properties of merit. Sitka is currently advancing its 100% owned, 431 square kilometre flagship RC Gold Project located within the Tombstone Gold Belt in the Yukon Territory. The Company is also advancing the Alpha Gold Project in Nevada and currently has drill permits for its Burro Creek Gold and Silver Project in Arizona and the Coppermine River Project in Nunavut.
*For more detailed information on the Company's properties please visit our website at www.sitkagoldcorp.com.
The scientific and technical content of this news release has been reviewed and approved by Gilles Dessureau, P.Geo., Vice President of Exploration of the Company, and a Qualified Person (QP) as defined by National Instrument 43-101.
ON BEHALF OF THE BOARD OF DIRECTORS OF
SITKA GOLD CORP.
"Donald Penner"
President and Director
For more information contact:
Donald Penner
President & Director
778-212-1950
dpenner@sitkagoldcorp.com
or
Cor Coe
CEO & Director
604-817-4753
ccoe@sitkagoldcorp.com
Neither TSX Venture Exchange nor its Regulation Services Provider (as that term is defined in policies of the TSX Venture Exchange) accepts responsibility for the adequacy or accuracy of this release.
Cautionary and Forward-Looking Statements
This release includes certain statements and information that may constitute forward-looking information within the meaning of applicable Canadian securities laws. Forward-Looking statements relate to future events or future performance and reflect the expectations or beliefs of management of the Company regarding future events. Generally, forward-looking statements and information can be identified by the use of forward-looking terminology such as "intends" or "anticipates", or variations of such words and phrases or statements that certain actions, events or results "may", "could", "should", "would" or "occur". This information and these statements, referred to herein as "forward‐looking statements", are not historical facts, are made as of the date of this news release and include without limitation, statements regarding discussions of future plans, estimates and forecasts and statements as to management's expectations and intentions and the Company's anticipated work programs.
These forward‐looking statements involve numerous risks and uncertainties and actual results might differ materially from results suggested in any forward-looking statements. These risks and uncertainties include, among other things, market uncertainty and the results of the Company's anticipated work programs.
Although management of the Company has attempted to identify important factors that could cause actual results to differ materially from those contained in forward-looking statements or forward-looking information, there may be other factors that cause results not to be as anticipated, estimated or intended. There can be no assurance that such statements will prove to be accurate, as actual results and future events could differ materially from those anticipated in such statements. Accordingly, readers should not place undue reliance on forward-looking statements and forward-looking information. Readers are cautioned that reliance on such information may not be appropriate for other purposes. The Company does not undertake to update any forward-looking statement, forward-looking information or financial out-look that are incorporated by reference herein, except in accordance with applicable securities laws. We seek safe harbor.
SIG:CA
The Conversation (0)
2h
John Feneck: Key Gold, Silver Price Levels, 10+ Mining Stocks I'm Watching
John Feneck, portfolio manager and consultant at Feneck Consulting, shares his updated outlook for gold and silver prices, outlining key support and resistance levels.
He also discusses precious metals and critical minerals stocks that he's watching.
Don't forget to follow us @INN_Resource for real-time updates!
Securities Disclosure: I, Charlotte McLeod, hold no direct investment interest in any company mentioned in this article.
Keep reading...Show less
2h
Top 10 Biggest Gold Mines in Australia
Australia is currently tied with Russia for second place in global gold production.
With gold's price trading at historic highs, it's a good time for investors to find out more about gold mines in Australia.
Learning about Australia's biggest gold mines is a good place to start. Read on for a look at where gold is mined in Australia and how much gold is produced at the biggest Australian gold mines.
Where is gold mined in Australia?
One of the nation's more prolific gold-mining areas is Western Australia, which according to the Fraser Institute is one of the best mining jurisdictions in the world. Unsurprisingly, the area has attracted major miners like Rio Tinto (ASX:RIO,LSE:RIO,NYSE:RIO) and BHP (ASX:BHP,NYSE:BHP,LSE:BLT).
In fact, gold was the second most valuable commodity in Western Australia in 2023 - 2024, only behind liquefied natural gas; gold sales came in a record AU$20 billion during that time.
Overall, according to statistical data provided by the government of Western Australia, the state alone produced 211.22 tonnes of gold in 2023/2024, compared to just 80.73 tonnes of gold produced in the rest of the country.
Within Western Australia, the Pilbara region has renewed interest and helped increase the country’s consistent gold output. Covering more than half a million square kilometres, the Pilbara area is one of the most resource-rich regions in the state. And while the Pilbara area is better known as an iron ore hotspot, it's currently in the midst of a small gold rush thanks to a major discovery in 2017 by Novo Resources (TSXV:NVO,OTCQX:NSRPF) and Artemis Resources (ASX:ARV,OTCQB:ARTTF).
Some geologists have compared the geology of the Pilbara Craton with South Africa’s Witwatersrand Basin, which is home to the Earth’s largest known gold reserves and is responsible for over 40 percent of worldwide gold production.
Both the Pilbara and Witwatersrand are similar in age and composition, sitting on top of the Archean granite-greenstone basement. The Pilbara area hosts numerous small mesothermal gold deposits containing conglomerate gold — mineralisation known to hold large, high-grade gold nuggets.
What are the biggest Australian gold mines?
Below is a tour of the 10 largest gold mines in Australia in terms of 2024 gold production, including information on their operations and 2025 guidance. Data is taken from company reports and MiningDataOnline.
1. Boddington
The Boddington open-pit gold and copper mine entered production in 2009 and is located 16 kilometres from Boddington, Western Australia. Once a three-way joint venture, Newmont (TSX:NGT,NYSE:NEM) became the sole owner of Boddington in 2009.
In calendar year 2024, Boddington produced 590,000 ounces of gold, down from 745,000 ounces produced in 2023, as the planned mine sequence means operations are currently focused on a section with lower gold grades. This will continue to impact output in 2025 as well, leading Newmont to set guidance at 560,000 ounces of gold for the year.
However, the company is working on laybacks in the North and South pits that should provide access to ore bodies with higher gold grades, which it says will help increase production once completed in 2026.
The mine produced 126,000 ounces of gold in the first three months of 2025.
2. Cadia Valley
Located in New South Wales, Cadia Valley is now owned and operated by Newmont following its acquisition of Newcrest Mining in November 2023.
Once the biggest gold mine in Australia, Cadia’s production numbers have been in decline in recent years, slipping from 843,000 ounces of gold in 2020 to 464,000 ounces in 2024. Output is expected to continue to decline in 2025, with Newmont setting guidance at 280,000 ounces.
The company is transitioning to operations in panel cave 2-3, from which peak production is expected from 2027 to 2032. It is also developing panel cave 1-2 with production planned to begin in 2027.
Cadia produced 103,000 ounces of gold in the first quarter of 2025.
3. KCGM
Northern Star Resources (ASX:NST,OTC Pink:NESRF) owns the Kalgoorlie Consolidated Gold Mines (KCGM) operations, home to the famous Super Pit, which is actually named the Fimiston open pit. KCGM also hosts the Fimiston and Mount Charlotte underground mines and the Fimiston and Gidji processing plants.
Northern Star became the sole owner of the KCGM operations in February 2021.
KCGM is located in the legendary Golden Mile, which was once reputed to be the richest square mile on Earth, and the operations sit on 13.27 million ounces of gold reserves. The operations reached the milestone of 50 million ounces of gold production in 2019.
In Northern Star's fiscal year 2023/2024, KCGM produced 449,032 ounces of gold. In mid-2023, Northern Star launched a AU$1.5 billion expansion project at KCGM's Fimiston processing plant that is expected to increase gold production to 900,000 ounces per year by 2029.
KGCM produced 117,703 ounces of gold during the first three months of 2025.
4. Tropicana
Located in Western Australia, the Tropicana gold mine is co-owned by AngloGold Ashanti (ASX:AGG,NYSE:AU) and Regis Resources (ASX:RRL,OTC Pink:RGRNF) through a 70/30 joint venture.
the mine spans 3,600 square kilometres and stretches over close to 160 kilometres in strike length along the Yilgarn Craton and Fraser Range mobile belt collision zone. The regional geology is dominated by granitoid rocks, making it a rare example of a large gold deposit within high-grade metamorphic rocks that have undergone widespread recrystallisation and melting.
In calendar 2024, Tropicana produced 426,000 ounces of gold, with AngloGold Ashanti’s 70 percent accounting for 313,000 ounces and the rest attributed to Regis.
As part of AngloGold Ashanti's commitment to lowering its carbon footprint, a 62 megawatt wind and solar facility is currently under construction at Tropicana. The project is expected to be completed during the first quarter of 2025 and will reduce greenhouse gas emissions at the site by an estimated 65,000 per year.
Tropicana produced 100,000 ounces of gold during the fourth quarter of 2024.
5. Tanami
Tanami has been fully owned and operated by Newmont since 2002 and is located in the Northern Territory's remote Tanami Desert. Both the mine and the plant are located on Aboriginal freehold land that is owned by the Warlpiri people and managed on their behalf by the Central Desert Aboriginal Lands Trust.
Tanami is a fly-in, fly-out operation in one of Australia’s most remote locations. The asset is 270 kilometres away from its closest neighbours, the remote Aboriginal community of Yuendumu.
In 2024, Tanami produced 408,000 ounces of gold, down from the 448,000 ounces the previous year.
Newmont announced the Tanami Expansion 2 project in October 2023, and expects commercial production to start in the second half of 2025. Once complete, it is expected to extend the mine's life beyond 2040 and increase its annual gold production by approximately 150,000 to 200,000 ounces for the initial five years.
Newmont has projected that 2025 will see a further decrease to 380,000 ounces due to lower grades. According to the company, 60 percent of that production is expected during the second half of the year as the mine expansion comes online.
Tanami produced 78,000 ounces of gold in the first three months of 2025.
6. Cowal
Owned by Evolution Mining, Cowal is the company's largest gold-producing asset. The mine is located near Bland Shire in New South Wales within the traditional lands of the Wiradjuri people.
In 2023, Evolution marked important milestones in the mine’s development with the ramp-up in production of its newly cutback Stage H portion of its open pit mine and the early completion of its underground mine.
The new underground portion of Cowal helped to deliver a record production in its fiscal year 2024 of 312,644 ounces of gold versus 276,314 ounces during its fiscal 2023.
Due to high gold prices and strong production numbers, the company reported that it has been able to repay capital costs for the acquisition and expansion at Cowal. In total, the mine generated AU$604.9 million in fiscal 2024 ended June 30, 2024.
Cowal produced 80,657 ounces of gold in the quarter ended March 31, 2025.
7. St. Ives
Owned and operated by Gold Fields (NYSE:GFI,JSE:GFI), St. Ives consists of multiple open-pit and underground mines near Kambalda in Western Australia.
In Gold Fields’ 2024 annual report, the company detailed that output from St. Ives came in at 331,200 ounces of gold during the calendar year, a slight decline from the 371,800 ounces achieved in 2023 due to lower grades.
In March 2024, Gold Fields announced the construction of a microgrid project at St. Ives that will add 42 megawatts (MW) of wind and 35 MW of solar, generating 73 percent of the operation’s electrical requirements. The company expects the microgrid to be operational toward the end of 2025. Overall, it is projected to reduce scope 1 and 2 emissions at the mine by 50 percent in 2030.
St. Ives produced 85,200 ounces of gold in Q1 2025, up 24 percent year over year.
8. Jundee
Jundee is located in the Northern Goldfields region of Western Australia and is owned by Northern Star, which purchased it from Newmont in 2014 for AU$82.5 million. The property is part of Northern Star's Yandall operations, and is well known due to the fact that it solely uses underground mining after transitioning from an open pit operation. Along with Cadia Valley, Jundee is one of the lowest-cost gold producers on this list.
The asset produced 280,963 ounces of gold in the company’s fiscal 2024 ended June 30 2024, lower than the 320,201 ounces produced the previous year. Production at Jundee was impacted by a fire in the processing plant in the June quarter that resulted in 10 days of unplanned downtime.
In June of 2023, Northern Star announced it would be integrating 24 MW of wind and 16.9 MW of solar into its existing gas power station network and would be supplementing the entire system with 12 MW of battery energy storage.
The windfarm was completed in 2025, and renewable generation is expected to account for 56 percent of the mine's power and contribute to a 36 percent reduction in Northern Star’s carbon footprint.
During the March quarter of 2025, Jundee produced 64,373 ounces of gold.
9. Duketon South
Owned by Regis Resources (ASX:RRL,OTC Pink:RGRNF), Duketon South is located in the North Eastern Goldfields of Western Australia. The operation is composed of the Garden Well and Rosemont operations, with both hosting open pit and underground mines.
The primary processing facility at Garden Well has a 5 million tonne per annum throughput rate with a two-stage crushing circuit, scrubber and ball mill, as well as a 7.5 million tonne per annum carbon-in-leach circuit, which also handles slurry from Rosemont.
In the company’s fiscal 2024 report, Regis Resources indicated production had decreased to 244,455 ounces of gold for the year ended June 30 from 252,672 ounces produced in 2023.
In May 2024, Regis announced it approved development for a new underground mining area at Garden Well and an extension to the Rosemont underground mine. Once these are complete, Regis is projecting annual production of 100,000 to 120,000 ounces of additional capacity by fiscal 2027.
During the quarter ending March 31, Duketon South produced 58,100 ounces of gold.
10. Fosterville
Fosterville, which is owned by Agnico Eagle Mines (TSX:AEM,NYSE:AEM), is a high-grade, low-cost underground gold mine located in the state of Victoria.
The mine has been operational since 1989, with a lifetime production of over 16 million ounces of gold. The asset produced 225,203 ounces of gold in calendar 2024, a decrease from the 278,000 ounces produced in 2023. Agnico Eagle attributes the decrease to lower grades as it processes the remaining areas of the Swan zone.
The company has forecast continued declines from Fosterville putting guidance at 140,000 to 160,000 ounces in 2025.
Fosterville produced 43,615 ounces of gold during the first quarter of 2025.
How to invest in Australian gold stocks?
Investing in Australian gold stocks is similar to stocks in other sectors. Gold companies issue shares on stock exchanges that are available for investors to trade. When you purchase shares of a gold stock, you are essentially purchasing a stake in the company.
Many gold companies in Australia are listed on the ASX, making them easily accessible to Australian investors. To invest in the companies that are listed on international exchanges, Australian investors will have to use a broker that has access to that market.
For North American investors looking to invest in Australian gold companies, some are dual-listed on Canadian and US stock exchanges as well, making them more accessible.
As for deciding which type of gold company to invest in, whether you choose to invest in gold-mining stocks or gold companies at the development or exploration stage should be based on your risk tolerance. In general, established companies that are producing metal are more stable and less risky than smaller companies that are still exploring for gold or building a mine.
Although no investing strategy is 100 percent foolproof, experts often recommend gold stocks as a way to hedge exposure to general stock market. That's because they tend to move in tandem with the price of gold.
For more ideas in how to invest in Australian gold stocks, check out our articles on the biggest ASX-listed gold stocks and the top-gaining ASX gold stocks year-to-date.
This is an updated version of an article first published by the Investing News Network in 2019.
Don’t forget to follow us @INN_Australia for real-time updates!
Securities Disclosure: I, Dean Belder, currently hold no direct investment interest in any company mentioned in this article.
Keep reading...Show less
3h
Gold Surge: Economic Uncertainty Fuels Next Wave of Exploration
Amid persistent economic volatility and geopolitical tensions, gold remains a reliable safe-haven investment. Analysts believe this strength isn't merely a short-term reaction, but rather a reflection of deeper structural factors that are reshaping the global economic landscape and driving a renaissance in gold exploration.
The precious metal's price has maintained remarkable resilience, reaching an all-time high of US$3,500 per ounce on April 22, 2025, spurred on by converging factors that have created an exceptionally favorable environment.
Central banks worldwide have emerged as significant buyers of the yellow metal, adding to their reserves at the fastest pace in decades. According to the World Gold Council, central banks’ annual net gold purchases reached 1,037 metric tons in 2023, just shy of 2022's record amount. Their buying reflects growing concerns about currency debasement and the search for assets that can maintain value during periods of economic stress.
Meanwhile, persistent inflation concerns, despite fluctuating interest rates, have kept investors vigilant about preserving wealth. Geopolitical tensions across multiple regions have further enhanced gold's appeal as a safe haven asset.
From ongoing conflicts in Eastern Europe to trade tensions between major economies, the global political landscape continues to generate uncertainty that drives capital toward precious metals.
Perhaps most telling has been the gradual shift in investor sentiment from high-growth tech stocks toward tangible assets and commodities. This rotation reflects a broader reassessment of risk in investment portfolios after years of market volatility.
Supply challenge: A crisis in plain sight
While demand dynamics have captured headlines, a less-discussed but equally important factor supporting gold's outlook is the emerging supply crunch. The gold-mining industry faces a silent crisis: declining discovery rates coupled with aging mines approaching the end of their productive lives.
Major gold producers are struggling to maintain their production levels as reserves deplete faster than they can be replaced. According to a report by McKinsey & Company, gold reserves have declined by approximately 25 percent since their peak in 2012, despite rising exploration budgets in recent years.
The challenge stems from the fundamental difficulty in finding new, economically viable gold deposits. The easy-to-find surface deposits have largely been discovered, forcing exploration to go deeper, into more remote regions and into jurisdictions that may carry higher operational risks.
This supply constraint isn't likely to resolve quickly. The timeline from initial discovery to production typically spans 10 to 15 years, meaning that today's exploration success won't translate into new supply until well into the next decade. This lag creates a structural support for gold prices that could persist regardless of short-term economic fluctuations.
Capital returns to exploration
Recognizing both the price strength and supply challenges, investors are once again directing capital toward gold exploration companies. After years of underinvestment following the previous gold bull market's end, financing for junior miners has seen a remarkable resurgence.
The financing revival has been accompanied by increased M&A activity as major producers look to secure future production pipelines by acquiring promising juniors.
This M&A trend provides an additional potential catalyst for investors in exploration companies, as successful discoveries can attract premium takeover offers from producers desperate to replenish their reserves.
This shifting paradigm is revitalizing exploration efforts across multiple regions. Canada's historic mining districts continue to attract attention, while West African nations like Burkina Faso, Mali and Côte d'Ivoire have emerged as exploration hotspots. Perhaps most interesting is the renewed focus on Colombia, a country with rich mineral potential that remains relatively underexplored due to its complex history.
Colombian opportunity: Quimbaya Gold's strategic position
One company positioned to benefit from these trends is Quimbaya Gold (CSE:QIM,OTCQB:QIMGF), a Canadian gold exploration company focused on unlocking high-grade gold opportunities in Colombia’s prolific Antioquia region, which produces over half of the country’s gold.
The company’s investment value proposition lies in its strategic landholdings totaling over 59,000 hectares across three highly prospective projects: Tahami, Berrio and Maitamac. These projects are located in well-established mining districts and positioned near major gold operations, offering both geological upside and infrastructure advantages.
The flagship Tahami project, covering 17,087 hectares, is particularly well positioned adjacent to Aris Mining's (TSX:ARIS,NYSEAMERICAN:ARMN) Segovia mine — one of the highest-grade gold mines globally, which produced 220,000 ounces in 2024. This proximity to a world-class operation enhances Tahami’s exploration potential, and Quimbaya is advancing the project through detailed mapping, LiDAR surveys, streaming, rock and soil samples and Mobile Metal Ion soil sampling to delineate drill targets.
Supporting its exploration efforts, Quimbaya has secured a five year drilling agreement with Independence Drilling, committing to 100,000 meters of drilling. The structure of the deal, with the drilling contractor accepting up to 100 percent payment in Quimbaya shares, is a vote of confidence in the company’s prospects and aligns both parties' interests.
Quimbaya has also established a 50/50 joint venture with Denarius Metals (OTCQX:DNRSF) for the Tahami project, which complements Quimbaya's ongoing exploration efforts. Both parties are focused on finalizing a definitive agreement as soon as possible.
In addition to Tahami, the Berrio project, spanning 8,746 hectares in the Low Magdalena region, benefits from a history of medium-scale gold mining over the past 50 years, indicating a strong geological foundation. Meanwhile, the 33,223 hectare Maitamac project, located 80 kilometers south of Medellín, is emerging as a potentially significant new gold metallogenic district, offering blue-sky exploration potential.
Recent capital raising activity, including a C$2.7 million private placement, has further strengthened Quimbaya’s financial position, allowing it to accelerate its exploration programs across all three properties.
With a strong portfolio, experienced technical partners, and a clear strategy targeting high-grade gold systems in a proven jurisdiction, Quimbaya presents a compelling opportunity for investors seeking exposure to early stage gold exploration with district-scale upside in Colombia.
Investor takeaway
As the gold market dynamics continue to evolve, one thing remains clear: exploration success is crucial to the industry's long-term sustainability. While production from existing mines can be optimized incrementally, only new discoveries can meaningfully address the looming supply shortfall.
For investors, this creates an opportunity to participate in the gold market beyond simply holding the physical metal or shares in established producers. Early stage exploration companies offer potential for outsized returns, albeit with corresponding risk levels. The most successful investors in this space typically build portfolios of exploration companies, recognizing that while some projects will inevitably disappoint, others may deliver returns that more than compensate for the failures.
The risk/reward equation in gold exploration has shifted favorably in recent years. With major producers trading at historically high multiples to their reserves and struggling to replace production organically, successful explorers can command premium valuations. Investors who can identify quality projects and management teams before major discoveries have the potential to achieve significant returns.
Companies like Quimbaya exemplify the opportunity at hand — targeting underexplored regions with substantial discovery potential at precisely the moment when new deposits are most needed and valued.
This INNspired article is sponsored by Quimbaya Gold (CSE:QIM,OTCQB:QIMGF,FWB:K05). This INNspired article provides information which was sourced by the Investing News Network (INN) and approved by Quimbaya Goldin order to help investors learn more about the company. Quimbaya Gold is a client of INN. The company’s campaign fees pay for INN to create and update this INNspired article.
This INNspired article was written according to INN editorial standards to educate investors.
INN does not provide investment advice and the information on this profile should not be considered a recommendation to buy or sell any security. INN does not endorse or recommend the business, products, services or securities of any company profiled.
The information contained here is for information purposes only and is not to be construed as an offer or solicitation for the sale or purchase of securities. Readers should conduct their own research for all information publicly available concerning the company. Prior to making any investment decision, it is recommended that readers consult directly with Quimbaya Goldand seek advice from a qualified investment advisor.
Keep reading...Show less
8h
Missouri Set to Recognize Gold and Silver as Legal Tender, Critics Raise Implementation Concerns
Missourians may soon be able to pay their taxes — and possibly their grocery bills — with gold and silver.
The Missouri General Assembly has passed a Republican-backed amendment to a wide-ranging finance bill that recognizes precious metals as legal tender. It would require state government entities to accept electronic forms of gold and silver — known as “electronic specie currency” — for public debts, including taxes.
The bill, now awaiting action by Republican Governor Mike Kehoe, has sparked both curiosity and concern. It stops short of mandating that private businesses accept physical or digital precious metals, but allows them to do so voluntarily.
“The goal is about restoring economic and political freedom back to everyday Missourians,” Representative Bill Hardwick, a Dixon Republican and a primary sponsor of the legislation, told the Kansas City Star. He has pushed versions of the so-called "Constitutional Money Act" for several years alongside members of the Missouri Freedom Caucus.
If signed into law, Missouri would become one of the few states to recognize gold and silver as legal tender — echoing a similar law passed by Utah in 2011 and proposals floated in other Republican-led states like Florida and Louisiana.
Supporters say the measure offers an alternative to the US dollar, which they argue is being devalued by inflation and poor federal monetary policy. However, the bill came as a surprise to some in the Capitol — it drew limited discussion on the House floor, and its full text was unavailable more than 24 hours after its passage, raising implementation questions.
State Representative Kemp Strickler, a Democrat from Lee’s Summit, expressed skepticism about the precious metals provision, though he ultimately voted “present” due to supporting other parts of the broader financial legislation.
“Not a fan of that part of it,” Strickler said. “Assuming it gets signed, we’re in the ‘how do we implement’ stage.”
He added that he expects most private businesses will likely decline to accept gold or silver as payment, given the complexities involved. “I would think this would be a huge challenge for private businesses,” he added.
Implementation may indeed be the most complicated part. The amendment calls on the Missouri Department of Revenue to develop rules and infrastructure for accepting electronic specie by August, when the bill would take effect.
Hardwick suggested that emerging payment technologies could facilitate transactions in gold or silver through digital and paper-based equivalents. But critics say the idea remains largely symbolic and potentially unworkable.
“So when I go to a gas station and buy a Coke, a 20 ounce Coke, and I’d say, you know, here’s my gold … Are they gonna give me back money in gold?” former Senate Minority Leader John Rizzo, a Democrat from Independence, said in 2023.
Business groups have been more measured in their responses.
The Missouri Chamber of Commerce and Industry opposed earlier versions of the bill that would have forced private businesses to accept gold and silver. But the final version was softened to remove that requirement.
The bill’s momentum comes amid a broader push by conservative lawmakers across the country to reassert state-level authority over monetary policy and hedge against federal economic policies they view as reckless.
Earlier this year, Utah legislators passed a bill to create a precious metals-backed electronic payment system, although Republican Governor Spencer Cox later vetoed it. In Florida, similar legislation has gained traction, with Governor Ron DeSantis voicing support. Louisiana lawmakers have also introduced, but not passed, related bills.
Whether the legislation becomes law now rests with Kehoe, who has not indicated how he will proceed. “The bill will receive a thorough review by Governor Kehoe and his team,” said spokesperson Gabby Picard in an email.
Though some proponents remain optimistic that alternative currency systems can gain traction, the real test will come in how — and whether — the state implements the law in a way that is practical and secure.
For now, gold and silver may be legal tender in theory; however, whether that translates into everyday transactions at gas stations, grocery stores or tax offices remains to be seen.
Don't forget to follow us @INN_Resource for real-time news updates!
Securities Disclosure: I, Giann Liguid, hold no direct investment interest in any company mentioned in this article.
Keep reading...Show less
8h
Heaven’s Earthly Treasures: Behind the Metallurgy of the Papal Symbols
As white smoke billowed from the Sistine Chapel's chimney and the bells of St. Peter’s Basilica rang out, Robert Francis Prevost, now known as Pope Leo XIV, was casting history in gold.
The newly elected pontiff is not only the first American pope, but also the latest successor in a long line of men robed in ancient symbols and tradition — as well as precious metals.
The Vatican, for all its spiritual power and theological doctrine, is also quite literally a treasury.
From the moment a pope is elected, he is adorned with regalia that is steeped in centuries of meaning, and often crafted from some of the world’s most valuable resources.
This article explores the material makeup of the modern papacy — what it's made of, and what it means.
The Fisherman’s Ring
At the center of every pontificate is a single golden symbol: the Fisherman’s Ring.
A custom-made signet bearing the image of St. Peter fishing — a nod to the Pope’s spiritual ancestry — the aptly named Fisherman’s Ring is a badge of papal authority. Historically, it also functioned as a seal for papal documents, though its use for that purpose was discontinued in 1842.
Gold is the traditional material, but recent pontificates have brought slight variations. Pope Benedict XVI’s ring was solid gold; Pope Francis chose gold-plated silver — a subtle nod to austerity.
The composition of Pope Leo XIV’s ring has not yet been confirmed.
Whatever its exact alloy, the symbolism remains rich. The ring is destroyed upon a pope’s death or resignation — shattered with a ceremonial hammer to prevent forgery, a powerful image of the transience of power.
The tiara’s glittering past
While Pope Leo XIV, like his recent predecessors, is unlikely to don the papal tiara — a triple-crowned headpiece entrenched in medieval grandeur — it remains one of the most opulent artifacts in Vatican history.
Traditionally crafted from silver and often adorned with diamonds, emeralds, sapphires and rubies, the tiara’s structure symbolized the pope’s threefold authority: to teach, to govern and to sanctify.
One of the most extravagant examples belonged to Pope Paul II in the 1460s; he wore a tiara encrusted with gems worth over 200,000 florins — more than US$22 million in today’s dollars. Another tiara, worn by Pope Julius II in 1503, was valued at 200,000 ducats (each ducat containing 3.5 grams of pure gold). These tiaras, now museum pieces, remain potent reminders of the Church’s historical wealth and the metals that shaped its regalia.
The modern papacy, however, has moved away from such ostentation.
Pope Paul VI was the last to wear the tiara. In 1963, just months after his coronation, he donated his own gold- and jewel-encrusted tiara to benefit the poor — a decision echoed by his successors.
The pectoral cross
Another item of note in the papal wardrobe is the pectoral cross, typically suspended from a gold or silver cord and worn over the chest. This cross often contains a relic and represents the pope’s role as shepherd of the Catholic Church, as well as a constant reminder of his burden: to bear the sins of humanity as Christ did.
Recent popes have had pectoral crosses made of solid silver or gold, often customized with inscriptions or sacred imagery. Pope Francis, for example, wore a simple silver pectoral cross featuring the image of the Good Shepherd.
The gold-embroidered red stole
Worn across the shoulders, the papal stole is not metallic, but is trimmed with elaborate gold embroidery — often hand-stitched using fine gold thread, sometimes even containing 24 karat accents.
The red stole signifies the pope’s priestly consecration and his spiritual role as a “good shepherd,” bearing the yoke of Christ. The golden accents of the stole reflect centuries of textile and metalcraft traditions.
Keys to the kingdom
Perhaps the most iconic symbol of the papacy is the crossed keys — one gold, one silver — typically shown bound by a red cord. These appear on everything from the Vatican’s flag to the papal seal and the mosaics embedded in the marble floors of St. Peter’s Basilica. The gold key represents the spiritual authority of heaven; the silver key, the temporal authority of the church on Earth. The downward-facing grips symbolize that both are wielded by the pope himself.
The materials — silver and gold — aren’t incidental; they signal divine access and earthly power alike.
The miter
Though no longer crowned with tiaras or enthroned on palanquins, modern popes still wear the miter, a ceremonial headdress. Today’s miters are typically made of silk, but many are embroidered with gold or silver threads, and some include small gemstone inlays.
Each miter is a handcrafted object, often given as a gift by a nation, religious order or diocese.
A papacy of substance and symbols
As the chants of, "Viva il papa!" echo across St. Peter’s Square, and as Pope Leo XIV blesses the faithful, he does so not just with words — but with a legacy etched in precious metals.
In the end, it’s a reminder that even in matters of the soul, the Earth’s treasures still shine.
Don't forget to follow us @INN_Resource for real-time news updates!
Securities Disclosure: I, Giann Liguid, hold no direct investment interest in any company mentioned in this article.
Keep reading...Show less
9h
Riverside Resources Sets Date to Receive Spinout Shares of Blue Jay Gold Corp
Riverside Resources Inc. (TSXV: RRI) (OTCQB: RVSDF) (FSE: 5YY) ("Riverside" or the "Company"), is excited to announce the date and steps to effect the previously announced spin-out of its subsidiary, Blue Jay Gold Corp. ("Blue Jay"), on May 22, 2025. Shareholders of Riverside as of 12:01 a.m. on such date (the "Effective Time") will be entitled to receive one (1) new common share of Riverside (the "New Riverside Shares") and one (1) common share of Blue Jay (the "Blue Jay Spinout Shares") for every five (5) common shares of Riverside ("Riverside Shares") held at the Effective Time. To receive Blue Jay Spinout Shares, investors must purchase Riverside Shares no later than the close of trading on May 21, 2025. Shareholders who purchase Riverside Shares on or after May 22, 2025, will not be entitled to participate in the share distribution. Blue Jay is expected to make an application to list its shares on the TSXV. This share reorganization follows a structure similar to Riverside's previous transaction with Capitan Silver. In that prior case, the shares saw positive appreciation, and both Riverside and Capitan advanced their respective business strategies.
"We are excited to move forward with the planned next step in Blue Jay Gold Corp.'s growth, with the spin-out of the Blue Jay shares held by Riverside going 100% to existing shareholders, and we appreciate the continued support of our shareholders as we deliver this value directly to them," stated John-Mark Staude, President and CEO of Riverside Resources. "This corporate action is consistent with our project generator business model, which we have successfully executed for over 18 years. It allows Riverside to maintain upside exposure through asset royalties while enabling Blue Jay to pursue its own focused growth strategy and existing shareholders to receive the benefits from the years of work the Company has put in building this Ontario asset portfolio. We believe this spin-out presents an exciting new opportunity for investors as Blue Jay moves toward becoming a publicly listed exploration company. I remain fully invested, holding shares, and am enthusiastic about the future of both Blue Jay and Riverside."
"Blue Jay will initially remain as a private reporting company as it prepares for its public listing, offering Blue Jay and Riverside shareholders a rare early-stage position typically reserved for pre-IPO investors. This structure allows for the alignment of strategic milestones and investor visibility ahead of listing on the TSX Venture Exchange," stated CEO of Blue Jay, Geordie Mark. "Having taken on the helm and now leading Blue Jay is a great opportunity as the portfolio is strong, team keen and we look forward to building a great Canadian gold company starting from this initial pre-listing state with the capital we have already raised and moving ahead with the Riverside shareholder base."
For more context on the strategic rationale and shareholder benefits of the Blue Jay Gold Corp. spin-out, we invite investors to watch a recent video interview featuring Geordie Mark and Riverside Resources CEO John-Mark Staude. In the discussion, they outline the structure of the transaction, the vision for Blue Jay Gold as a standalone exploration company, and how Riverside shareholders will continue to benefit through retained royalties and equity exposure. The full video is available here: https://youtu.be/PrYeRon0cj0
Riverside and Blue Jay consider it in their respective best interests, and in the interests of their shareholders and other stakeholders, to proceed with effecting the Arrangement to enable each company to pursue their respective and distinct growth strategies as separate entities.. Blue Jay is actively engaged with the TSX Venture Exchange to complete the listing of the Blue Jay Shares in the second half of 2025, subject to meeting the TSXV's initial listing requirements and aligning with the Company's ongoing strategic and accretive growth initiatives.
The 14,956,693 Blue Jay Spinout Shares currently held by Riverside will be distributed to Riverside's shareholders in connection with Riverside's previously announced plan of arrangement under section 288 of the Business Corporation Act (British Columbia) (the "Arrangement") The Arrangement will be effected pursuant to the arrangement agreement dated January 27, 2025 between Blue Jay and Riverside (the "Arrangement Agreement"), and approved by shareholders at the annual general and special shareholders meeting held March 31, 2025.
At the effective time of the Arrangement on May 22, 2025, each existing Riverside Share will be exchanged for one new New Riverside Share and 1/5th of a Blue Jay Spinout Share, subject to adjustment in accordance with the Arrangement Agreement. Holders of Riverside options are entitled to receive the same number of New Riverside Shares and 1/5th of that number of Blue Jay Shares. On completion of the Arrangement, Riverside shareholders and holders of Riverside options will maintain their interest in Riverside and will obtain a proportionate interest in Blue Jay. There are no share warrants in either Riverside or Blue Jay.
Following the completion of the Arrangement, Blue Jay will be a reporting issuer in Alberta, British Columbia and Ontario and will meet and comply with all of its timely and continuous disclosure requirements, as required under applicable Canadian securities laws. Blue Jay's public disclosure documents will be made available and filed on Blue Jay's profile on SEDAR+ at www.sedarplus.ca following the Arrangement.
Riverside will retain a 2% net smelter return (NSR) royalty on each of Blue Jay's three properties, ensuring continued exposure to the success and upside of these assets.
How to Receive the New Riverside Shares and Blue Jay Shares
To receive the New Riverside Shares and the Blue Jay Shares to which they are entitled, registered shareholders of Riverside who hold their Riverside common shares (the "Riverside Shares") in certificated form are required to submit a Letter of Transmittal (which is available on the Company's SEDAR+ profile at www.sedarplus.ca to Endeavor Trust Corporation ("Endeavor"), as depositary, to exchange their Riverside Shares for certificates or direct registration system ("DRS") statements representing the New Riverside Shares and the Blue Jay Shares to which they are entitled under the Arrangement. Registered shareholders who hold their Riverside Shares through DRS statements will automatically receive DRS statements for the New Riverside Shares and Blue Jay Shares at the registered address maintained by Endeavor and are not required to submit a Letter of Transmittal to Endeavor.
Beneficial shareholders of Riverside who hold their Riverside Shares through an intermediary, broker or other agent will automatically receive their New Riverside Shares and Blue Jay Spinout Shares to which they are entitled pursuant to the Arrangement and should contact such intermediary, broker or other agent with questions on their New Riverside Shares and Blue Jay Shares.
The Arrangement Agreement and additional details about the Arrangement are included in the Company's management information circular dated February 18, 2025, copies of which are each available on Riverside's SEDAR+ profile at www.sedarplus.ca and on the Company's website at www.rivres.com.
About Blue Jay Gold Corp
Blue Jay Gold Corp. is a Canadian gold exploration company focused on high-grade discovery in Ontario's prolific Beardmore-Geraldton and Wawa Greenstone Belts, regions known for hosting numerous past-producing and active gold mines. The Company's flagship asset, the Pichette Project, features extensive banded iron formation (BIF) trends and high-grade historical gold intercepts, offering near-surface discovery potential. With three strategically located projects and a leadership team experienced in geology and capital markets, Blue Jay Gold is advancing a disciplined, modern exploration strategy in one of Canada's most prospective and mining-friendly jurisdictions.
About Riverside Resources Inc.
Riverside is a well-funded exploration company driven by value generation and discovery. The Company has over $4M in cash, no debt and less than 75M shares outstanding with a strong portfolio of gold-silver and copper assets and royalties in North America. Riverside has extensive experience and knowledge operating in Mexico and Canada and leverages its large database to generate a portfolio of prospective mineral properties. In addition to Riverside's own exploration spending, the Company also strives to diversify risk by securing joint-venture and spin-out partnerships to advance multiple assets simultaneously and create more chances for discovery. Riverside has properties available for option, with information available on the Company's website at www.rivres.com.
For additional information contact:
John-Mark Staude President, CEO Riverside Resources Inc. info@rivres.com Phone: (778) 327-6671 Fax: (778) 327-6675 Web: www.rivres.com | Eric Negraeff Investor Relations Riverside Resources Inc. Phone: (778) 327-6671 TF: (877) RIV-RES1 Web: www.rivres.com |
Certain statements in this press release may be considered forward-looking information. These statements can be identified by the use of forward-looking terminology (e.g., "expect"," estimates", "intends", "anticipates", "believes", "plans"). Such information involves known and unknown risks -- including the availability of funds, that the Arrangement may not occur within the timelines contemplated or at all, that the listing of the Blue Jays on the TSXV is subject to the approval of the TSXV which may not be obtained on terms acceptable to Blue Jay or at all, the ability of Blue Jay to raise sufficient capital to pursue its growth strategy and meet the listing requirements of the TSXV and , the results of financing and exploration activities, the interpretation of exploration results and other geological data, or unanticipated costs and expenses and other risks identified by Riverside in its public securities filings that may cause actual events to differ materially from current expectations. Readers are cautioned not to place undue reliance on these forward-looking statements, which speak only as of the date of this press release.
Neither the TSX Venture Exchange nor its Regulation Services Provider (as that term is defined in the policies of the TSX Venture Exchange) accepts responsibility for the adequacy or accuracy of this release.
Keep reading...Show less
Latest News
Latest Press Releases
Related News
TOP STOCKS
American Battery4.030.24
Aion Therapeutic0.10-0.01
Cybin Corp2.140.00
Investing News Network websites or approved third-party tools use cookies. Please refer to the cookie policy for collected data, privacy and GDPR compliance. By continuing to browse the site, you agree to our use of cookies.