The Conversation (0)
Tinka Resources Limited ("Tinka" or the "Company") (TSXV:TK)(BVL:TK)(OTCQB:TKRFF) is pleased to announce the results from an updated Preliminary Economic Assessment ("PEA") on the Company's 100%-owned polymetallic Ayawilca project ("Ayawilca" or the "Project") in central Peru. The updated PEA shows Ayawilca to be an excellent base metals project with significant enhancements from the previous PEA study. The Project now features a smaller, more efficient zinc-silver-lead plant, introduces a separate tin plant for additional revenue and commodity diversification and highlights the development path forward for Ayawilca to become a producing mine
PEA Highlights:
- Robust economics: After-tax Net Present Value ("NPV") at 8% discount of US$434 million (pre-tax NPV8% of US$732 million) and after-tax Internal Rate of Return ("IRR") of 25.9% (pre-tax IRR of 34.8%).
- Payback period after-tax of 2.9 years (pre-tax of 2.4 years).
- Initial Capital Expenditure ("Capex") of US$382 million.
- Long 21-year life of mine ("LOM") for a 2.0 million tonnes per annum (Mtpa) zinc-silver-lead operation with 15‑years of tin production at 0.3 Mtpa.
- Average C1 cash cost of US$0.55/pound zinc and all in sustaining cost ("AISC") of US$0.68/ pound zinc.
- Average annual metal production (in concentrate) of 200 million pounds of zinc (90,000 tonnes Zn), 3.26 million pounds of tin (1,500 tonnes Sn), 560,000 ounces of silver and 5.7 million pounds of lead (2,590 tonnes Pb).
- Zinc Zone Indicated Mineral Resource tonnage increased 49% from the previous Mineral Resource estimate.
- Tin Zone Indicated Mineral Resource declared for the first time.
- Excellent location in a world-class mining jurisdiction, close to a zinc smelter and port.
- Compact mine footprint and planned use of filtered tailings technology provides the lowest risk and most water-efficient solution for tailings storage while 40% of tailings to be stored underground as backfill.
Dr. Graham Carman, Tinka's President and CEO, stated:
"We are very pleased to release the results of the updated 2024 PEA for the Ayawilca project. We believe the results of the PEA show Ayawilca to be an outstanding polymetallic project with several improvements from the previous study. While zinc continues to be the primary revenue source, Ayawilca's polymetallic nature includes important contributions from tin and silver providing valuable commodity diversification. The updated PEA is marked by the incorporation of a smaller, more efficient, zinc-silver-lead plant and a separate tin plant and a more compact mine footprint. Despite an increase in the initial capex, due to efficiencies in the mine design there was no significant impact on valuation. The strong financial metrics include an after-tax NPV8% of US$434 million, an after-tax IRR of 25.9%, and a post-tax payback period of only 2.9 years which highlight the potential for Ayawilca to become a producing mine."
"A revised Mineral Resource estimation has significantly improved the level of confidence in the resource as a result of an additional 11,000 metres of drilling completed in 2023. The Zinc Zone Indicated Mineral Resource tonnage has increased 49% over the previous estimate while zinc content has increased by 22% and silver content by 45%. The Tin Inferred Mineral Resource has increased in tonnage and metal content by 51% and 13%, respectively, while a Tin Indicated Mineral Resource is declared for the first time. The Company has chosen to adopt the highest standard for reporting underground mine resources to satisfy the "Reasonable Prospects for Eventual Economic Extraction (RPEEE)" as required by CIM (2014) in the demonstration of spatial continuity of mineralization within potentially mineable shapes (i.e., stopes). With the market increasingly moving towards RPEEE resource reporting for underground deposits, we are adopting this method of resource reporting for the first time."
"The use of filtered tailings is the lowest risk and most water-efficient solution for tailings storage at surface, and highlights our commitment to minimize environmental risks. The storage of a substantial quantity of tailings as backfill underground also reduces surface tailings storage, again helping to minimize the environmental impact."
"There remains significant exploration potential for further discoveries at Ayawilca, and several of the resource bodies remain open at depth, with a potential feeder system remaining largely untested by drilling particularly at the Tin Zone."
The results of the PEA update will be disclosed in an independent technical report in accordance with National Instrument 43-101 Standards of Disclosure for Mineral Projects ("NI 43-101") and prepared by independent consulting firm SRK Consulting (UK) ("SRK") with specific subject matter expertise including Transmin Metallurgical consultants ("Transmin"), Envis Peru S.A.C. ("Envis") tailings consultants and MineFill Services ("MineFill") backfill consultants. SLR Consulting (Canada) Ltd ("SLR") has prepared the updated Mineral Resource estimate for the PEA update. A National Instrument 43-101 Technical Report ("the Technical Report") will be filed on SEDAR within 45 days.
Note: The PEA is preliminary in nature and includes Inferred Mineral Resources that are considered too speculative geologically to have the economic considerations applied to them that would enable them to be categorized as Mineral Reserves, and there is no certainty that the preliminary economic assessment will be realized. Mineral Resources are not Mineral Reserves and do not have demonstrated economic viability.
A summary of the key financial information for the updated PEA is provided in Table 1.
Financial Summary - Base Case | Pre-tax |
| NPV (8% discount rate) IRR Payback period | US$731.7 million 34.8% 2.4 years |
| Pre-production capital expenditure (Capex)1 Sustaining Capex Life of Mine (LOM) Capex C1 Cash Cost / Pound of Payable Zinc All-in Sustaining Cost (AISC) / Pound of Payable Zinc Closure Cost | US$382 million US$313 million US$695 million US$0.55 US$0.68 US$20 million |
Notes: 1 Includes contingencies of US$76 million.
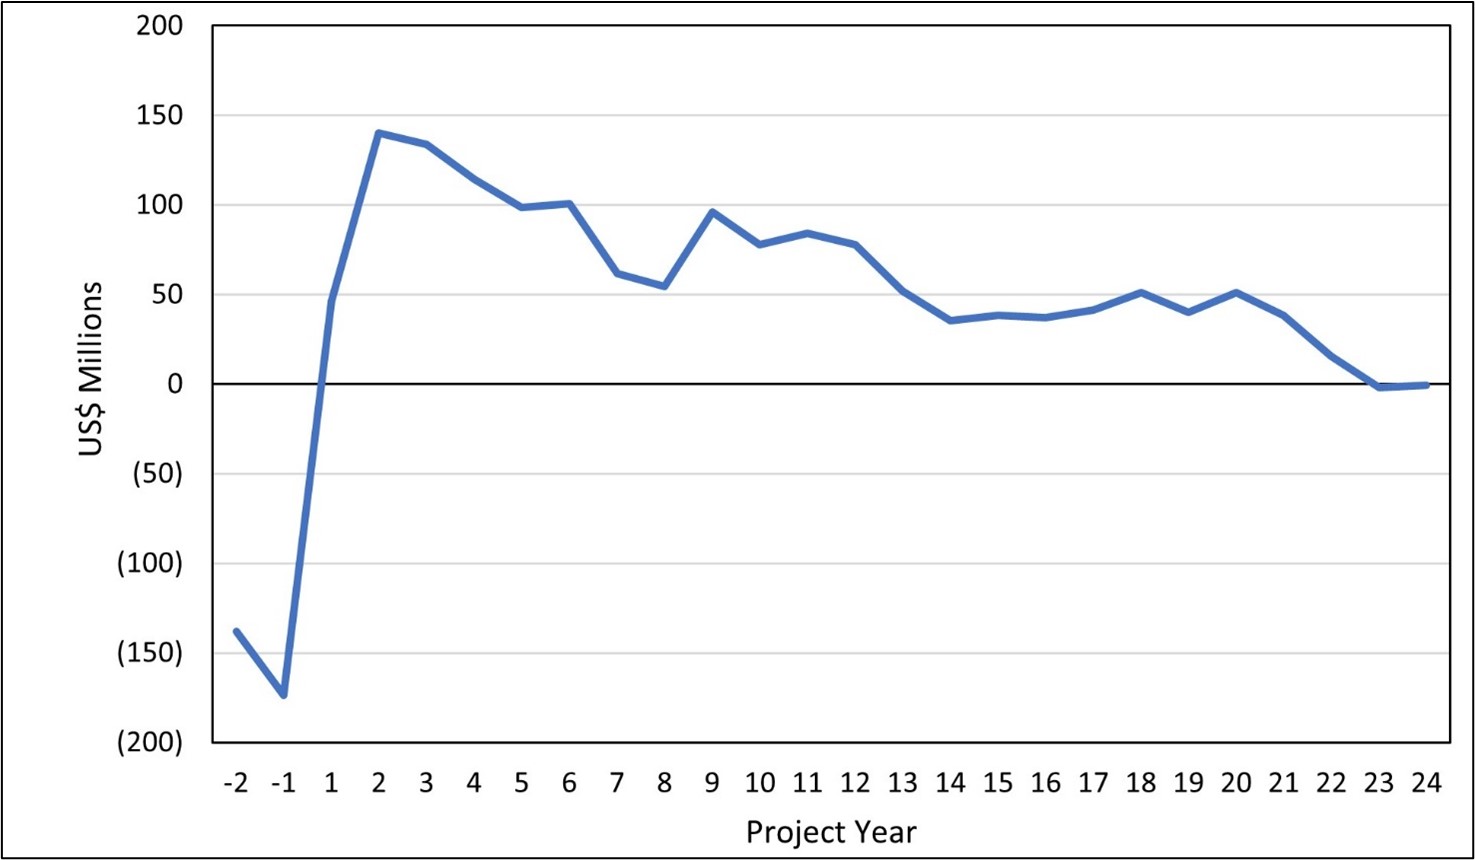
A summary of the Life of Mine (LOM) operating summary for the updated PEA is provided in Table 2. The after-tax cash flow by year of production is presented in Figure 1.
Table 2. LOM Operating Summary for the updated PEA with Metal Prices assumptions
| Operating Summary | Value |
| Operating days per year Processing plant throughput Zn/Ag/Pb Processing plant throughput Sn Average annual zinc concentrate production Average annual tin concentrate production Average annual lead-silver concentrate production Average annual silver in lead concentrate Total LOM zinc in concentrate Net Smelter Return from zinc and lead concentrates Net Smelter Return from tin concentrate | 360 days/year 2.0 Mtpa 0.3 Mtpa 180,000 dmt/year 3,000 dmt/year 5,500 dmt/year 0.56 million oz/year 1.9 million tonnes US$4,000 million US$460 million |
| Mining costs (including backfill) Processing costs Zn/Ag/Pb Processing costs Sn Tailings G&A costs LOM Average Operating Cost (Zn/Ag/Pb) LOM Average Operating Cost (Sn) | US$16.88/t US$11.00/t US$23.63/t US$0.94/t US$6.23/t US$35.06/t US$47.68/t |
Notes: dmt = dry metric tonne.
Numbers may not add due to rounding.
Base Case Metal Prices & Exchange Rate Assumptions | Value |
| Zinc Price Lead Price Tin Price NSR Cut-off value - Zinc Zone and Silver Zone NSR Cut-off value - Tin Zone Exchange Rate - Peruvian SOL/USD | US$1.30/lb US$1.00/lb US$22/oz US$11.00/lb US$60/t US$80/t 3.70 |
Total LOM tonnage processed | 45.55 million tonnes |
| Mine Life Zn/Ag/Pb Mine Life Sn | 21 years 15 years |
Figure 1. Ayawilca 2024 PEA - After-Tax Cash Flow by Year of Production (in US$)
Mining
The Ayawilca Project is planned as an underground mine operation. For the purposes of the PEA, the Zinc Zone (together with the Silver Zone) will be mined at a rate of 2.0 Mtpa, whilst the Tin Zone will be mined at a rate of 0.3 Mtpa. Mining of both zinc and tin zones commence together with each feeding separate processing plants. The LOM is 21 years for the Zinc Zone and 15 years for the Tin Zone. Mining in the Zinc and Tin Zones will utilize a long hole open stoping ("LHOS") method in a transverse direction with level spacing ranging from 15 to 20 m. The Silver Zone uses LHOS in a longitudinal direction at a 20 m level spacing. A top-down overhand mining sequence is applied, working on top of paste-fill between sill pillars which are recovered. Three declines are planned from surface, initially two declines to access the South, Silver, and West areas and in later years the Central and East areas will be accessed by a third decline. The Tin Zones are also accessed through these planned declines.
Production is assumed to commence following 18 months of construction and commissioning. The mine plan for the Zinc and Silver Zones is based on mining a total of 41.2 million tonnes grading 5.02% Zn, 17.3 g/t silver and 0.19% lead over a 21-year LOM using an NSR cut-off of US$60/t. The Tin Zone is based on mining a total of 4.32 million tonnes grading 0.92% tin over a 15-year LOM using an NSR cut-off of US$80. The mill feed will be trucked to the surface via multiple ramp systems connecting the three mine portals to the underground infrastructure and accessing production areas starting at the South and West areas of the Zinc Zone, the Silver Zone, and the high recovery area of the Tin Zone (see Figures 2 and 3).
Figure 2. Mining Schedule for Zinc-Silver-Lead Plant (left) and Tin Plant (right) showing Average Grades by Year
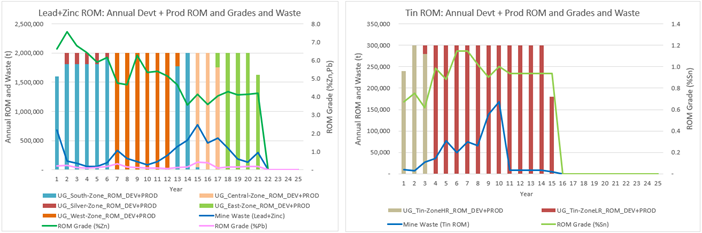
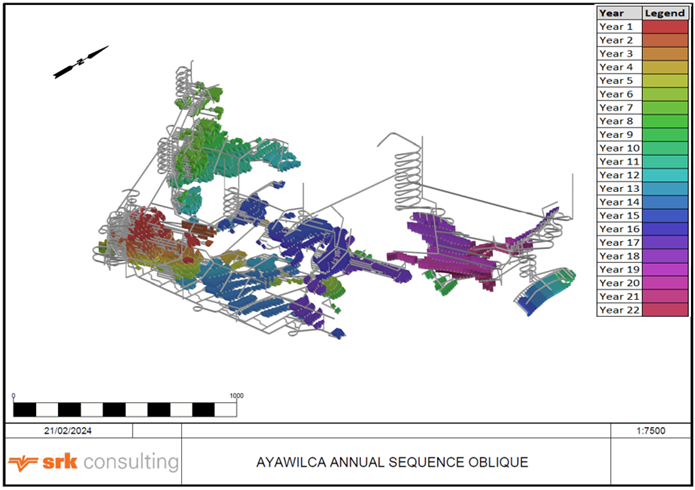
Figure 3. Oblique view of Ayawilca mine design and stopes showing LOM Schedule
Metallurgy and Processing
Processing of the zinc-rich mineralization will be through a conventional crushing and grinding circuit followed by froth flotation, concentrate thickening and filtration. Metallurgical test work indicates a zinc concentrate grading 50% zinc can be produced from Zinc and Silver Zones with 92% of the zinc in the Zinc Zone recovered to the zinc concentrate (see news release of June 5, 2019), and 87% of the zinc in the Silver Zone recovered to the zinc concentrate. The lead concentrate is expected to contain 47% lead and average 3,140 g/t silver over the LOM. Based on preliminary metallurgical test work, 45% of the silver in the Zinc Zone is expected to report to the lead concentrate and be payable, while 40% of the silver is expected to report to the zinc concentrate and not be payable. In the Silver Zone, 85% of the silver (and 85% of the lead) is expected to report as a credit to a commercial lead concentrate. The zinc concentrate is expected to be a marketable concentrate with no deleterious elements other than an iron penalty. Concentrate grade assumptions and recoveries for the principal metals in the Zinc and Silver Zones are summarized in Table 3 below.
Table 3. LOM Head Grades and Metallurgical Recoveries for the Zinc-Silver-Lead Circuit
Product | Zinc/Silver-Lead Concentrates Average Grade LOM | Metallurgical Recoveries (%)1 | |||||
Zinc (%) | Lead (%) | Silver (g/t) | Av. NSR (US$/t) | Zinc | Lead | Silver | |
| Feed grade Zinc Concentrate Lead Concentrate | 5.02 50.0 4.0 | 0.19 0 to 0.1 47 | 17.3 0-100 3,1402 | 99 | 92/87 0 | 0 70/85 | 40/0 45/85 |
1 First number relates to recovery in Zinc Zone and second number to Silver Zone
2 Silver concentrate grades were calculated for the PEA and range from 897 to 5,849 g/t
The first 200,000 wmt/a of zinc concentrates are assumed to be delivered directly to a local refinery (around 90% of LOM production); the balance is assumed to be sold to refineries in east Asia. The zinc concentrate also contains high indium (around 650 ppm In) and receives a US$20/dmt credit in concentrate shipped to Asia. All of the silver-lead concentrates are assumed to be sold overseas. Off-site charges include transport costs, treatment charges, refining charges, and iron penalties at refinery are summarized below in Table 4.
Table 4. LOM Head Grade and Metallurgical Recovery for the Tin Circuit
Product | Average Grade LOM | Metallurgical Recoveries (%) | ||
Tin (%) | Av. NSR (US$/t) | Tin - Coarse | Tin - Fine | |
| Feed grade Tin Concentrate | 0.92 50.0 | 106 | 90 | 50 |
Initial metallurgical testwork indicates that a tin concentrate grading 50% with 90% recovery can be produced from the high recovery (i.e., coarse tin) part of the Tin Zone, and a tin concentrate grading 50% with 50% recovery can be produced from the lower recovery (i.e., fine tin) part of the Tin Zone. The coarse tin represents 19% of the overall tin feed. The tin concentrates are anticipated to have markets in Asia and therefore all of the tin concentrate produced is assumed to be shipped overseas. Off-site charges include transport, treatment charges, refining charges, and penalties at refinery and summarized below in Table 5.
Table 5. Off-Site Charges
Description | Zinc Concentrate | Silver-Lead Concentrate | Tin Concentrate |
| Transport to Port/Local refinery Port Charges Shipping to overseas smelter (FOB) Local refinery Treatment Charge (TC) Overseas Treatment Charge (TC) Ag Refining Charge (RC) Indium Credit (Overseas only) Sulphur Penalty Iron Penalty | US$40/wmt US$25/wmt US$45/wmt US$220/dmt US$220/dmt - US$20.00/dmt US$7.50/dmt | US$40/wmt US$50/wmt US$15/wmt - US$50/dmt US$0.80/oz - | US$40/wmt US$50/wmt US$15/wmt - US$750/dmt - - US$75/dmt 0.7 units |
Notes: wmt = wet metric tonne. dmt = dry metric tonne
For silver-lead concentrates grading less than 2,500 g/t Ag, treatment charge is $150/dmt and refining charge is $1.00/oz Ag.
Approximately 60% of the tailings will be thickened and filtered for dry stack tailings disposal. The remaining 40% will be prepared as pastefill and reticulated to the underground mine to be used as structural backfill.
Infrastructure
Access
There is a good existing road network from the Project to the coast of Peru. The Project lies approximately 250 km from the Port of Callao and a zinc refinery. The road leaving the Project is an all-weather gravel road that crosses the high central Andes for about 60 km before joining a bitumen road to the coast and then to the Port of Callao via the Pan-American highway. The Cajamarquilla zinc refinery is situated on the eastern outskirts of the city of Lima with good access from the highway.
Tailings and Mine Waste Management
The tailings and mine waste concept for the Ayawilca PEA is based on a commitment to implementing best available practices and best available technologies, as described in the International Council of Mining and Metals ("ICMM") Global Industry Standard for Tailings Management. The location of the TSF has been selected to minimize any potential risks for downstream areas. It is envisaged that:
- 100% of mine waste rock and 40% of tailings production will be re-used as underground mine backfill;
- On-surface tailings will be processed as filtered tailings and stacked at a secure and prepared facility. This method will reduce the environmental footprint and the risk of failure and the attendant environmental impacts, while also minimizing water consumption.
- The filtered tailings facility has been located adjacent to the process plant area, minimizing the haul distance for the tailings and reducing environmental and social impacts.
Power
A new electricity substation is currently under construction 4.7 km from Ayawilca by a 3rd party mining company. The Project will include construction of a transmission line from this substation to a substation at Ayawilca. Tinka has recently received approval of a pre-operation environmental study ("EPO") to access 220kV / 23 MW power supply through a substation at Ayawilca. Ayawilca is now planned to become connected to the national electrical grid.
Capital and Operating Costs
The major components of the initial capital expenditure of US$$382 million include US$89.4 million for the zinc-silver-lead processing plant, US$29.0 million for the tin processing plant, US$34.0 million for on-site infrastructure, US$56.6 million for mine equipment and underground pre-production development, US$17.8 million for site preparation of the filtered tailings storage facility and related mobile equipment, $15.5 million for the pastefill plant, $52.4 million for other surface facilities, and US$45.0 million other costs including indirects and owners costs. Contingency in the initial capital totals US$76.2million. Total sustaining capital is $313.1 million over the 21-year mine life. The major components of sustaining capital are US$176.3 million for mining equipment (including major components and rebuilds) and materials handling, $49.8 million for mine development, ventilation and water management, US$46.0 million for tailings management. Contingency in sustaining capital totals US$40.8 million.
The estimated capital costs, over the life of the Project, are as follows in Table 6.
Table 6. Capital Costs Summary
Capital Cost Item | Initial (US$ M) | Sustaining (US$ M) | LOM Total (US$ M) |
| Mining & mine development Process plant - Zn/Ag/Pb Process plant - Sn Pastefill plant Tailings Other surface facilities Subtotal Other indirects Owner's costs Contingency | 56.6 89.4 29.0 15.5 17.8 52.4 261.7 34.7 10.3 76.2 | 226.3 - - - 46.0 - 272.2 - - 40.8 | 282.9 89.4 29.0 15.5 63.7 52.4 534.0 34.7 10.3 117.0 |
TOTAL PROJECT (US$ M) | 381.8 | 313.1 | 694.9 |
CLOSURE COSTS (US$ M) | 19.5 |
Numbers may not add due to rounding
The estimated operating costs, over the life of the Project, are as follows in Table 7.
Table 7. Operating Costs per Mining Method for the Zinc and Tin Plants
US$/t Processed | |||
Operating Cost Item | Zinc Plant | Tin Plant | Weighted Average Zinc + Tin |
| Mining Backfill Sub-total Processing Tailings G&A | 13.15 3.73 16.88 11.00 0.94 6.23 | 13.15 3.73 16.88 23.63 0.94 6.23 | 13.15 3.72 16.88 12.20 0.94 6.23 |
TOTAL PROJECT | 35.06 | 47.68 | 36.25 |
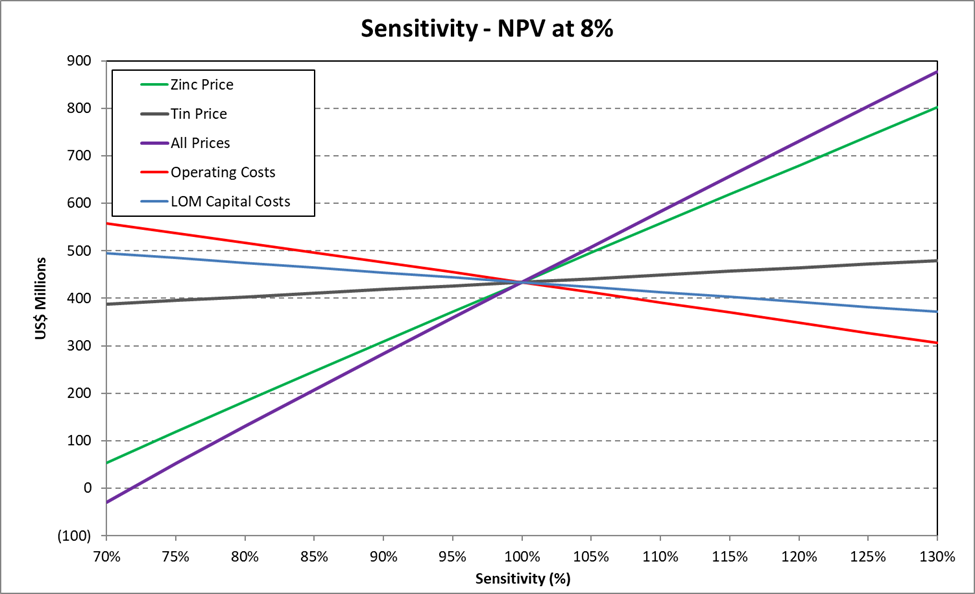
Sensitivities
The Ayawilca project is strongly leveraged to zinc and to a lesser extent tin and silver prices. A 25% increase on the base case zinc price (from US$1.30 to US$1.625) results in an after-tax NPV8% of US$741 million. A 25% increase on the base case tin price (from US$11.00 to US$13.75) results in an after-tax NPV8% of $472 million. See Figure 4.
Figure 4. PEA Sensitivities for Metals Prices, Operating Cost and LOM Capital Costs
Opportunities and Exploration Potential
The Ayawilca deposit has not been fully delineated by exploration drilling, and several of the zones remain open along strike and at depth. Opportunities for additional value at Ayawilca not captured in the PEA include, but not limited to:
- Potential to extend the Zinc Zone deposits to depth at the East and West areas with more drilling;
- Potential to extend the Tin Zone to depth at the Central area, in particular where a steeply-dipping feeder zone is interpreted and is untested by drilling;
- Potential to extend the Silver Zone along strike and at depth - only 500 m of strike length is tested to date;
- Optimization of zinc recovery to a zinc concentrate (currently 92%) and silver recovery to a silver-lead concentrate in the Zinc Zone (currently 45%) with more detailed metallurgical test work;
- Optimization of tin recovery to a tin concentrate from the low recovery domain (currently 50%) with more detailed metallurgical testwork.
Mineral Resource Estimation
The updated Ayawilca Project Mineral Resource estimate for the Zinc Zone, Silver Zone, and Tin Zone is summarized in Table 8, Table 9, and Table 10, respectively, as estimated by SLR Consulting (Canada) Ltd (SLR). For the purposes of demonstrating ‘Reasonable Prospects for Eventual Economic Extraction' (RPEEE), Mineral Resources are constrained within underground reporting shapes generated in Deswik Stope Optimizer ("DSO") using a minimum mining width of three metres and an NSR cut-off value of $50/t for the Zinc and Silver Zones and $60/t for the Tin Zone. Canadian Institute of Mining, Metallurgy and Petroleum ("CIM") Definition Standards for Mineral Resources and Mineral Reserves dated May 10, 2014 ("CIM (2014)" definitions) are used for classification of Mineral Resources. The Tin Zone, Zinc Zone and Silver Zone resources do not overlap.
To satisfy RPEEE for an underground mining scenario, Tinka is reporting Mineral Resources within potentially mineable shapes (i.e., stopes) thereby demonstrating the spatial continuity of the mineralization. Where the potentially mineable volumes (i.e., stopes) contain smaller zones of mineralization with values below the stated cut-off, this lower grade material is included in the Mineral Resource estimate.
The updated Mineral Resources estimate as at January 1st, 2024, contains the following:
- Indicated Zinc Zone Mineral Resource of 28.3 Mt grading 5.82% zinc, 16.4 g/t silver, 0.2% lead & 91 g/t indium containing:
- 3.64 billion pounds of zinc;
- 14.9 million ounces of silver;
- 108 million pounds of lead; and
- 2,582 tonnes of indium.
- Inferred Zinc Zone Mineral Resource of 31.2 Mt grading 4.21% zinc, 14.5 g/t silver, 0.2% lead & 45 g/t indium containing:
- 2.90 billion pounds of zinc;
- 14.6 million ounces of silver;
- 133 million pounds of lead; and
- 1,414 tonnes of indium.
- Inferred Silver Zone Mineral Resource of 1.0 Mt grading 111.4 g/t silver, 1.54% zinc, & 0.5% lead containing:
- 3.7 million ounces of silver;
- 35 million pounds of zinc; and
- 12 million pounds of lead.
- Indicated Tin Zone Mineral Resource of 1.4 million tonnes grading 0.72% tin, containing:
- 22 million pounds of tin.
- Inferred Tin Mineral Resource of 12.7 million tonnes grading 0.76% tin, containing:
- 213 million pounds of tin.
No Mineral Reserves have been estimated at the Project.
The Zinc, Silver, and Tin Zone Mineral Resource estimates for the Ayawilca Project were updated by SLR using the drill results available to May 31, 2023. The deposit drill database includes 249 drill holes totalling 94,258 m. An additional 35 drill holes totalling 12,216 m have been added since the previous update dated August 30, 2021. Three-dimensional (3D) wireframe models were generated using an approximate NSR cut-off value of $40/t for the Zinc Zone. For the Tin Zone, a 0.2% Sn or NSR cut-off value of $30/t was used for wireframe models. Prior to compositing to two metre lengths, high tin, silver, and lead values were capped for each zone individually. Zinc, silver, lead, tin, and indium high grade outliers were constrained during interpolation on a per domain basis. Block model grades within the wireframe models were interpolated by inverse distance cubed (ID3). Despite lead grades generally being low, it is assumed that lead and silver will be recovered in a lead concentrate. Density was assigned to blocks within the resource wireframes by ID3. Where density sample data was insufficient for interpolation, density values were derived from a regression equation based on the iron value of the block. Figures 5 and 6 show the Mineral Resource wireframes in plan and 3D views. Cross sections of the resource wireframes are shown in Figures 7 and 8.
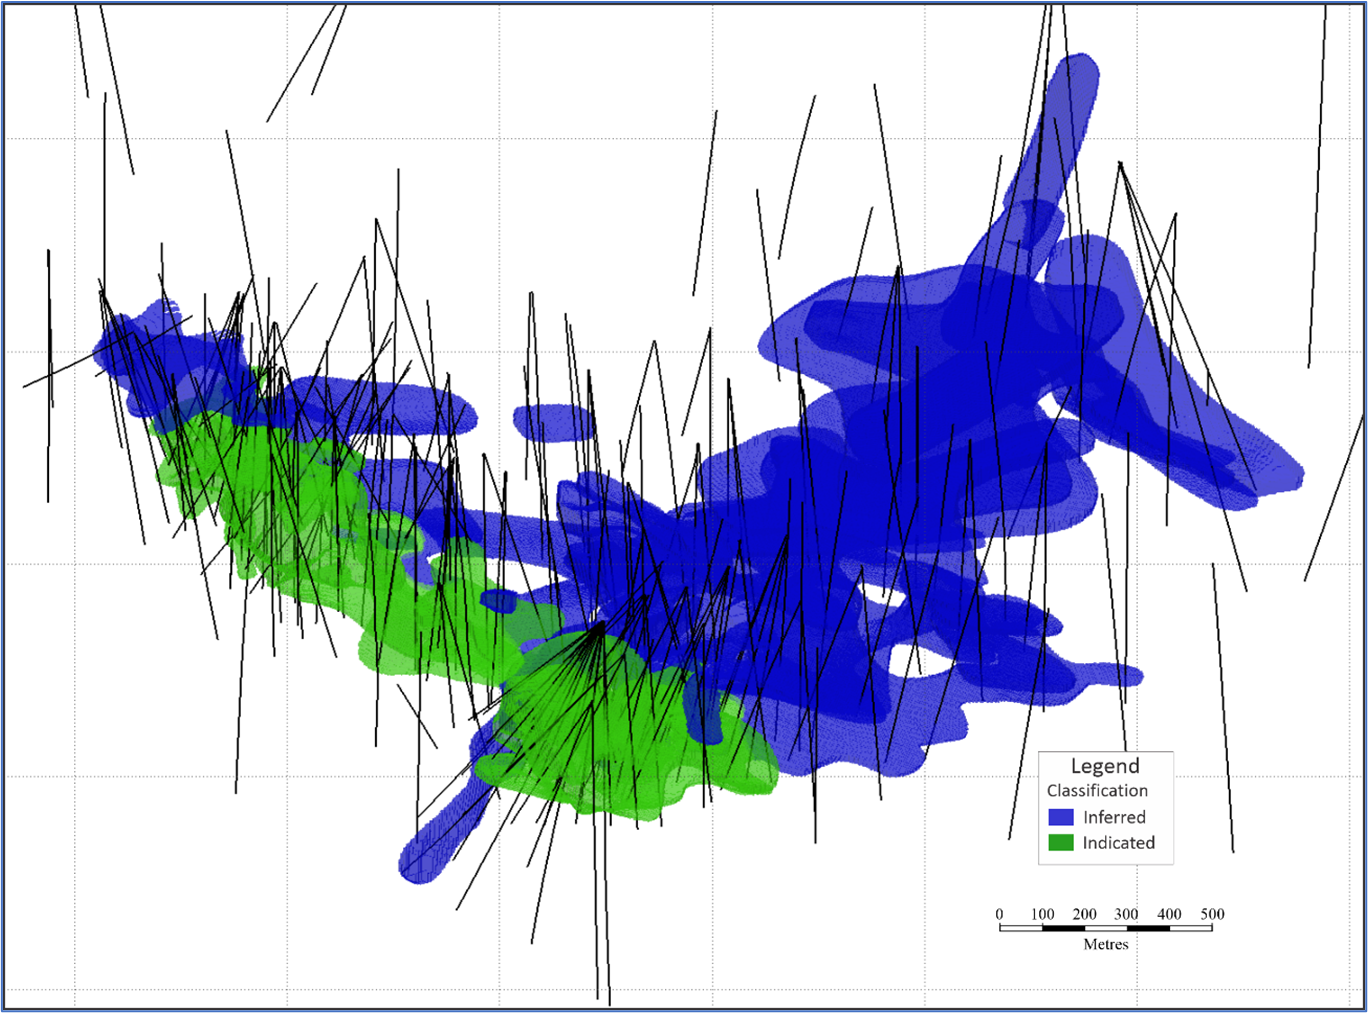
The Mineral Resources were classified following CIM (2014) definitions as Indicated and Inferred using drill hole spacing based criterion, mineralization continuity, and thickness. The drill hole spacing within a resource area assigned the Indicated category commonly ranges from 40 m to 70 m.
Table 8. Ayawilca Zinc Zone Mineral Resources as of January 1, 2024
Classification/ | Tonnage | NSR | Grade | Contained Metal | ||||||
|---|---|---|---|---|---|---|---|---|---|---|
Zn % | Ag g/t | Pb % | In g/t | Mlb Zn | Moz Ag | Mlb Pb | t In | |||
Indicated | ||||||||||
South | 13.8 | 128 | 6.64 | 19.3 | 0.2 | 120 | 2,020 | 8.6 | 52 | 1,655 |
West | 14.5 | 98 | 5.05 | 13.6 | 0.2 | 64 | 1,618 | 6.3 | 56 | 927 |
Total Indicated | 28.3 | 113 | 5.82 | 16.4 | 0.2 | 91 | 3,638 | 14.9 | 108 | 2,582 |
Inferred | ||||||||||
South | 4.8 | 79 | 3.81 | 24.2 | 0.2 | 34 | 406 | 3.8 | 19 | 163 |
West | 3.8 | 89 | 4.61 | 12.1 | 0.1 | 61 | 384 | 1.5 | 12 | 229 |
Central | 9.1 | 85 | 4.39 | 10.6 | 0.2 | 54 | 878 | 3.1 | 47 | 486 |
East | 13.5 | 81 | 4.13 | 14.4 | 0.2 | 40 | 1,229 | 6.3 | 55 | 536 |
Total Inferred | 31.2 | 83 | 4.21 | 14.5 | 0.2 | 45 | 2,898 | 14.6 | 133 | 1,414 |
Notes:
- CIM (2014) definitions were followed for Mineral Resources.
- The Mineral Resources have been reported within underground reporting shapes generated with Deswik Stope Optimizer (DSO) using a net smelter return (NSR) cut-off value of US$50/t. For the Central area, Mineral Resources were reported only within underground reporting shapes that also had a Zn grade above 3%.
- NSR value was based on estimated metallurgical recoveries, assumed metal prices, and smelter terms, which include payable factors, treatment charges, penalties, and refining charges. The NSR used for reporting is based on the following:
- Long term metal prices of US$1.40/lb Zn, US$25/oz Ag, and US$1.10/lb Pb.
- Net metallurgical recoveries of 92% Zn, 45% Ag, and 70% Pb.
- The NSR value for each block was calculated using the following NSR factors: US$18.04 per % Zn, US$0.33 per gram Ag, and US$11.92 per % Pb.
- The NSR value was calculated using the following formula: NSR = Zn(%)*US$18.04+Ag(g/t)*US$0.33+Pb(%)*US$11.92.
- Bulk densities were assigned to blocks by interpolation and remaining blocks by regression of Fe assay data or average sample data. Averages range between 3.20 t/m3 and 3.51 t/m3.
- Mineral Resources that are not Mineral Reserves do not have demonstrated economic viability.
- Numbers may not add due to rounding.
Table 9. Ayawilca Silver Zone Mineral Resources as of January 1, 2024
Classification | Tonnage | NSR | Grade | Contained Metal | ||||||
|---|---|---|---|---|---|---|---|---|---|---|
Zn % | Ag g/t | Pb % | In g/t | Mlb Zn | Moz Ag | Mlb Pb | t In | |||
Inferred | 1.0 | 100 | 1.54 | 111.4 | 0.5 | 3 | 35 | 3.7 | 12 | 3 |
Notes:
- CIM (2014) definitions were followed for Mineral Resources.
- The Mineral Resources have been reported within underground reporting shapes generated with Deswik Stope Optimizer (DSO) using a net smelter return (NSR) cut-off value of US$50/t.
- NSR value was based on estimated metallurgical recoveries, assumed metal prices, and smelter terms, which include payable factors, treatment charges, penalties, and refining charges. The NSR used for reporting is based on the following:
- Long term metal prices of US$1.40/lb Zn, US$25/oz Ag, and US$1.10/lb Pb.
- Net metallurgical recoveries of 77% Zn, 85% Ag, and 85% Pb.
- The NSR value for each block was calculated using the following NSR factors: US$15.10 per % Zn, US$0.62 per gram Ag, and US$14.48 per % Pb.
- The NSR value was calculated using the following formula: NSR = Zn(%)*US$15.10+Ag(g/t)*US$0.62+Pb(%)*US$14.48.
- Bulk densities were assigned to blocks by interpolation and remaining blocks by regression of Fe assay data or average sample data. The average bulk density is 3.18 t/m3.
- Mineral Resources that are not Mineral Reserves do not have demonstrated economic viability.
- Numbers may not add due to rounding.
Table 10: Ayawilca Tin Zone Mineral Resources as of January 1, 2024
Classification | Tonnage | NSR | Grade | Contained Metal |
Indicated | 1.4 | 99 | 0.72 | 22 |
Inferred | 12.7 | 104 | 0.76 | 213 |
Notes:
- CIM (2014) definitions were followed for Mineral Resources.
- The Mineral Resources have been reported within underground reporting shapes generated with Deswik Stope Optimizer (DSO) using a net smelter return (NSR) cut-off value of US$60/t.
- The NSR value was based on estimated metallurgical recoveries, assumed metal prices, and smelter terms, which include payable factors, treatment charges, penalties, and refining charges. Metal price assumption is US$12.00/lb Sn. Metal recovery assumption is 64% Sn. The NSR value for each block was calculated using the following NSR factor: US$137.30 per % Sn.
- The NSR value was calculated using the following formula: US$NSR = Sn(%)*US$137.30.
- Bulk densities were assigned to blocks by interpolation and remaining blocks by regression of Fe assay data or average domain sample data. The average bulk density is 3.65 t/m3.
- Mineral Resources that are not Mineral Reserves do not have demonstrated economic viability.
- Numbers may not add due to rounding.
Density
A total of 4,226 density measurements are located within the wireframe models. This represents a nearly five-fold increase in the number of density measurements available when compared to the previous estimate. A linear regression established between core density data and iron assays was used to assign a density value to resource blocks that were not interpolated. Linear regression equations were established for each area separately. Overall, the density values in the updated 2024 mineral resource estimate have decreased by around 5% over the 2021 estimate.
In the previous estimate, density values were assigned to all blocks in each area based on the average density sample value after removing outliers. In SLR's opinion, density values were slightly overestimated in the previous estimate and the updated estimation methodology is more rigorous and better reflects local variations within the resource domains.
SLR notes, however, that using a regression equation based on iron is not without flaws. These include:
- Overlimit iron assays will underestimate the iron content and low bias the density.
- There is a negative correlation with high zinc and iron values, i.e., there is a potential to low bias Zn-rich areas.
A small proportion of blocks within the South and West areas are assigned a density value using the iron regression equation. Within the Central area, however, approximately 50% of blocks are assigned a density value using the iron regression equation and within the East area, there are not enough samples to establish a correlation between density and iron.
Figure 5. Plan of Ayawilca Drillhole Map Highlighting Updated Mineral Resource wireframes.
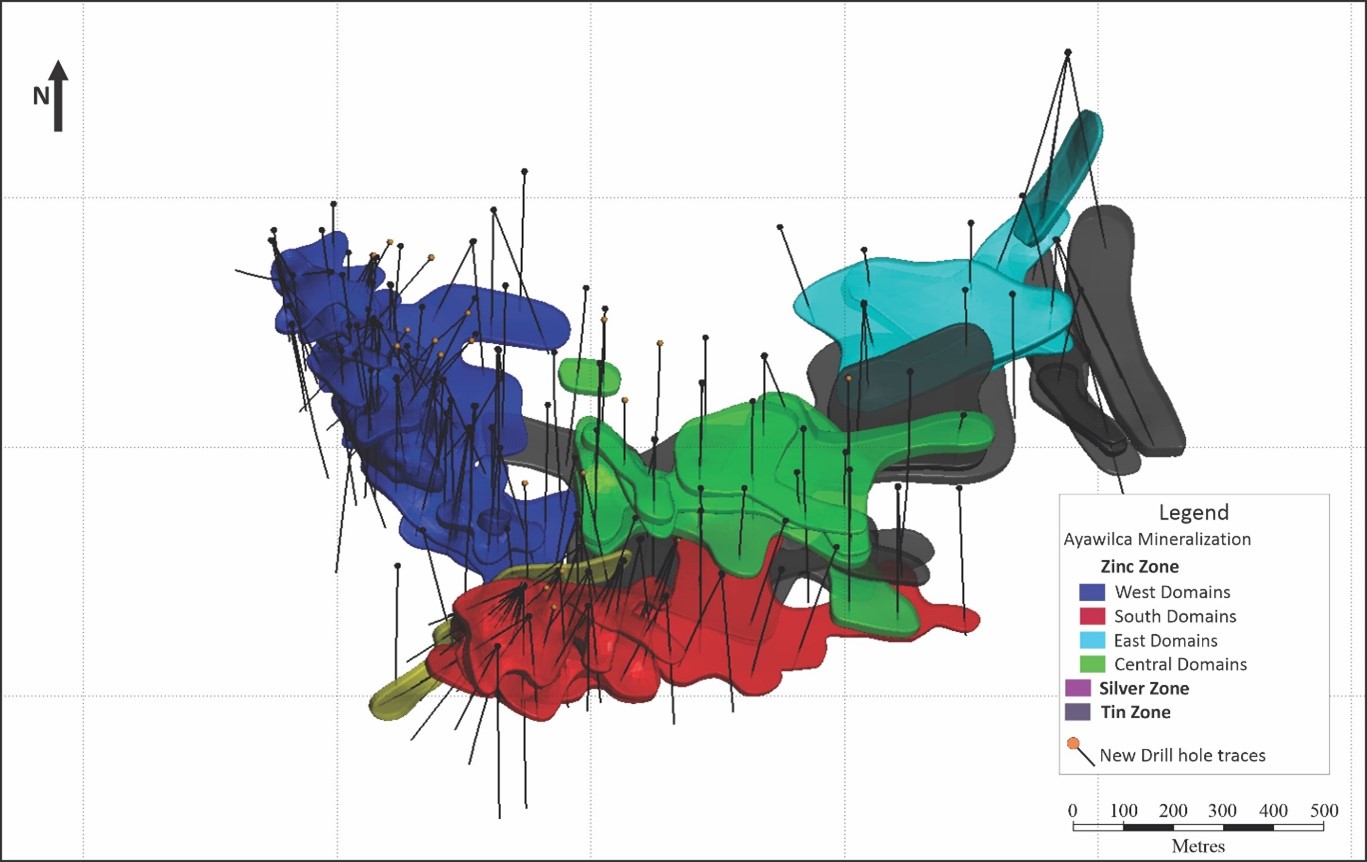
Figure 6. Plan view of Ayawilca Zinc Zone Resource Wireframes and Classification Model
Comparison to Previous Mineral Resource Estimate
Drilling at Ayawilca in 2022 and 2023 since the previous estimate (effective date August 30, 2021) has improved the understanding of the lithological setting and faults controlling the zinc, tin, and silver mineralization. The updated geological model better constrains the mineralized zones especially within the zinc zone domains at West Ayawilca.
Zinc Zone
Taken as a whole, the current Zinc Zone Mineral Resource estimate is reduced in both tonnage and contained metal, with lower average grades. However, Indicated Mineral Resource tonnage has increased by 49% and metal content has increased by 22% (zinc) and 45% (silver). Conversely, Inferred Mineral Resource tonnage has decreased by 33% and metal content has decreased by 41% (silver), 61% (lead) and 48% (zinc).
The most substantial impact to the Mineral Resource tonnage, grade, and metal content is the result of reporting the summation of all blocks within resource reporting shapes versus a block cut-off value, for the first time at Ayawilca to demonstrate RPEEE. Where the potentially mineable volumes contain smaller zones of mineralization with values below the stated cut-off, this material is included in the Mineral Resource estimate and has added dilution. Isolated blocks, which cannot support underground development to access the blocks, have not been included in the resource inventory. Other contributing factors which have impacted the changes in the Mineral Resource estimate include:
- A modification to the geological interpretation particularly at West due to the drilling in 2022 and 2023.
- A much larger density database which allowed block interpolation in most of the deposit areas.
- A change in the NSR factors as a result of higher metal prices used for zinc and updated costs.
- Reporting the silver-rich domain as a separate zone with distinct metal recoveries and NSR factors.
- A change in the NSR cut-off value which was reduced from $55/t to $50/t.
Tin Zone
Although there was no change to the NSR cut-off value for the Tin Zone, globally, the current Tin Zone Mineral Resource estimate has increased in both tonnage and contained metal, but with lower average grades. Indicated Mineral Resources have been declared in the current estimate and Inferred Mineral Resources have increased in tonnage and metal content by 51% and 13% respectively, but average grades have decreased by approximately 25%.
The most substantial impact to the Tin Zone Mineral Resource in the current estimate is upgrading a portion of Inferred Mineral Resources to Indicated Mineral Resources and reporting the summation of all blocks within resource reporting shapes (i.e., stopes) versus a block cut-off value.
Figure 7. Generalized SW-NW longitudinal section of Zinc Zone and Tin Zone at South and Central Areas
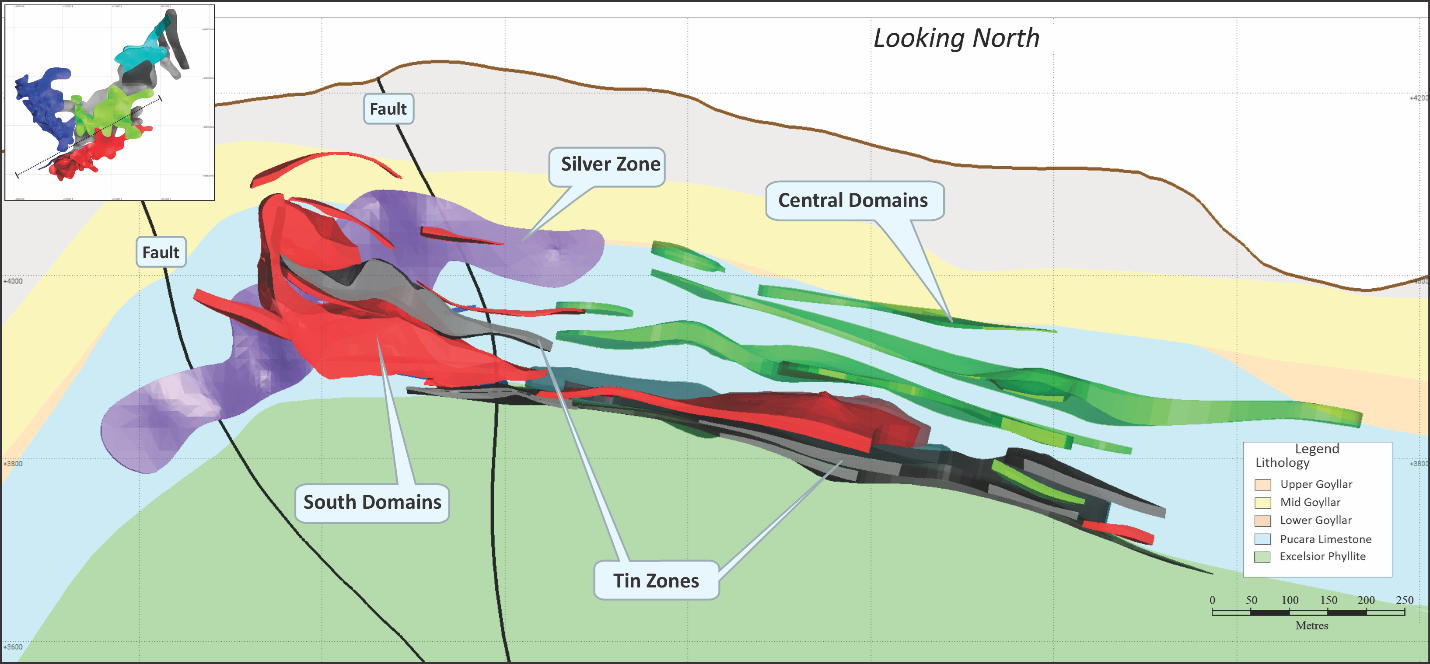
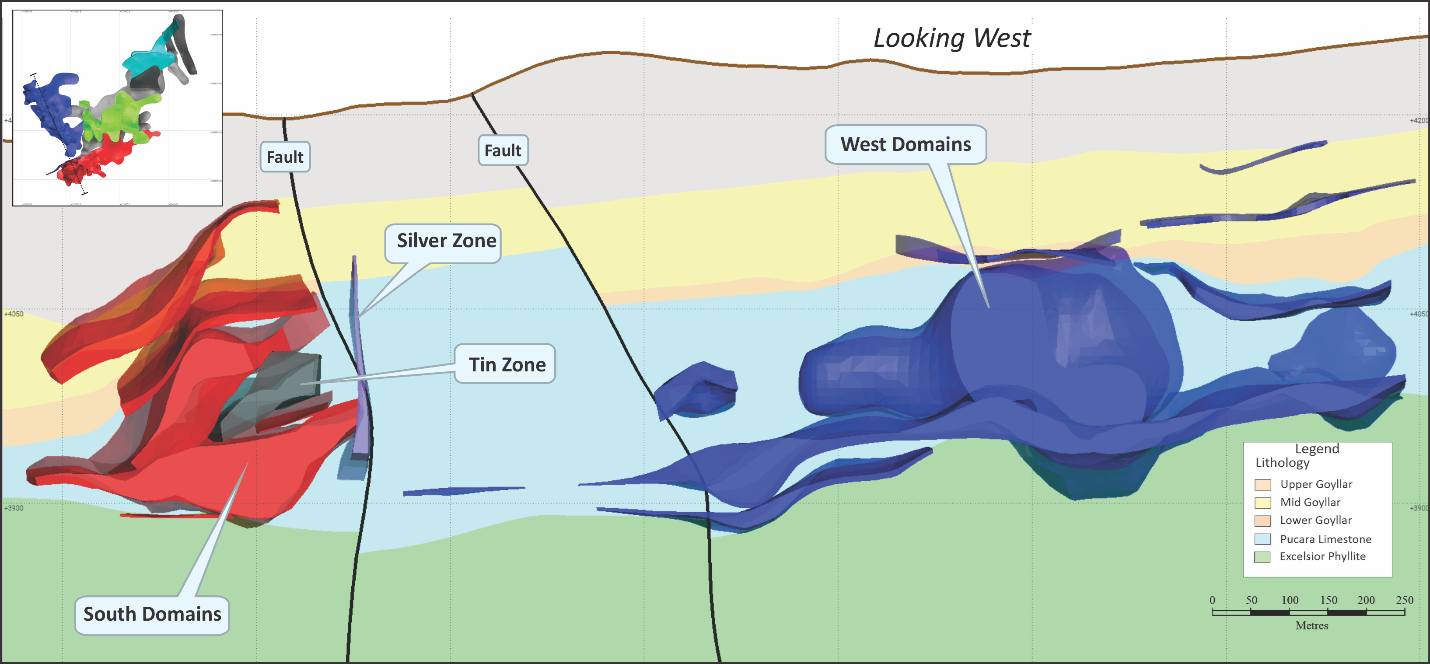
Figure 8. Generalized N-S cross section of Zinc Zone, Tin Zone and Silver Zone at South and West Areas
Technical Background and Qualified Persons
Technical information related to the PEA contained in this news release has been reviewed and approved by Chris Bray BEng (Mining), MAusIMM (CP), Principal Consultant (Mining Engineering) with SRK Consulting (UK) who is a Qualified Person as defined in NI 43-101.
The Mineral Resources disclosed in this news release have been estimated by Ms. Katharine M. Masun, MSA, M.Sc., P.Geo., Principal Geologist with SLR who is independent of Tinka. By virtue of education and relevant experience Ms. Masun is a "Qualified Persons" for the purpose of National Instrument 43-101. The Mineral Resources have been classified in accordance with CIM Definition Standards for Mineral Resources and Mineral Reserves (May, 2014). Ms. Masun has read and approved the contents of this news release as it pertains to the disclosed Mineral Resource estimates.
The processing, metallurgical and recovery inputs disclosed in this news release have been reviewed and verified by Mr. Adam Johnston, FAusIMM, CP (Metallurgy) of Transmin Metallurgical Consultants, UK, a Qualified Person as defined by National Instrument 43-101.
The mine backfill inputs have been reviewed and verified by Dr. David Stone, P.Eng. of MineFill Services, Seattle, a Qualified Person as defined by National Instrument 43-101.
The inputs on processing and costs for surface tailings storage disclosed in this news release have been reviewed and verified by Mr. Donald Hickson, P.Eng., of Envis Peru S.A.C. (Envis), a Qualified Person as defined by National Instrument 43-101.
Dr. Graham Carman, Tinka's President and CEO, reviewed and verified the technical contents of this release. Dr. Carman is a Fellow of the Australasian Institute of Mining and Metallurgy, and is a Qualified Person as defined by National Instrument 43-101.
On behalf of the Board,
"Graham Carman"
Dr. Graham Carman, President & CEO
Further Information:
www.tinkaresources.com
Mariana Bermudez
1.604.685.9316
info@tinkaresources.com
Stay up to date by subscribing for news alerts at Contact Tinka and by following Tinka on Twitter, LinkedIn and Facebook.
About Tinka Resources Limited
Tinka is an exploration and development company with its flagship property being the 100%-owned Ayawilca zinc-silver-tin project in central Peru. The Zinc Zone has an estimated Indicated Mineral Resource of 28.3 Mt grading 5.82% zinc, 16.4 g/t silver, 0.2% lead and 91 g/t indium, and an Inferred Mineral Resource of 31.2 Mt grading 4.21% zinc, 14.5 g/t silver, 0.2% lead and 45 g/t indium. The Silver Zone has an estimated Inferred Mineral Resource of 1.0 Mt grading 111.4 g/t silver, 1.54% zinc, & 0.5% lead. The Tin Zone has an estimated Indicated Mineral Resource of 1.4 million tonnes grading 0.72% tin and an Inferred Mineral Resource of 12.7 million tonnes grading 0.76% tin (dated at January 1, 2024).
Forward Looking Statements: Certain information in this news release contains forward-looking statements and forward-looking information within the meaning of applicable securities laws (collectively "forward-looking statements"). All statements, other than statements of historical fact are forward-looking statements. Forward-looking statements are based on the beliefs and expectations of Tinka as well as assumptions made by and information currently available to Tinka's management. Such statements reflect the current risks, uncertainties and assumptions related to certain factors including, without limitations: timing of planned work programs and results varying from expectations; delay in obtaining results; changes in equity markets; uncertainties relating to the availability and costs of financing needed in the future; equipment failure, unexpected geological conditions; imprecision in resource estimates or metal recoveries; success of future development initiatives; competition and operating performance; environmental and safety risks; the Company's expectations regarding the Ayawilca Project PEA; the political environment in which the Company operates continuing to support the development and operation of mining projects; risks related to negative publicity with respect to the Company or the mining industry in general; delays in obtaining or failure to obtain necessary permits and approvals from local authorities; community agreements and relations; and, other development and operating risks. Should any one or more of these risks or uncertainties materialize, or should any underlying assumptions prove incorrect, actual results may vary materially from those described herein. Although Tinka believes that assumptions inherent in the forward-looking statements are reasonable, forward-looking statements are not guarantees of future performance and accordingly undue reliance should not be put on such statements due to the inherent uncertainty therein. Except as may be required by applicable securities laws, Tinka disclaims any intent or obligation to update any forward-looking statement.
Neither the TSX Venture Exchange nor its Regulation Services Provider (as that term is defined in the policies of the TSX Venture Exchange) accepts responsibility for the adequacy or accuracy of this news release
SOURCE: Tinka Resources Ltd.
View the original press release on accesswire.com