
October 31, 2024
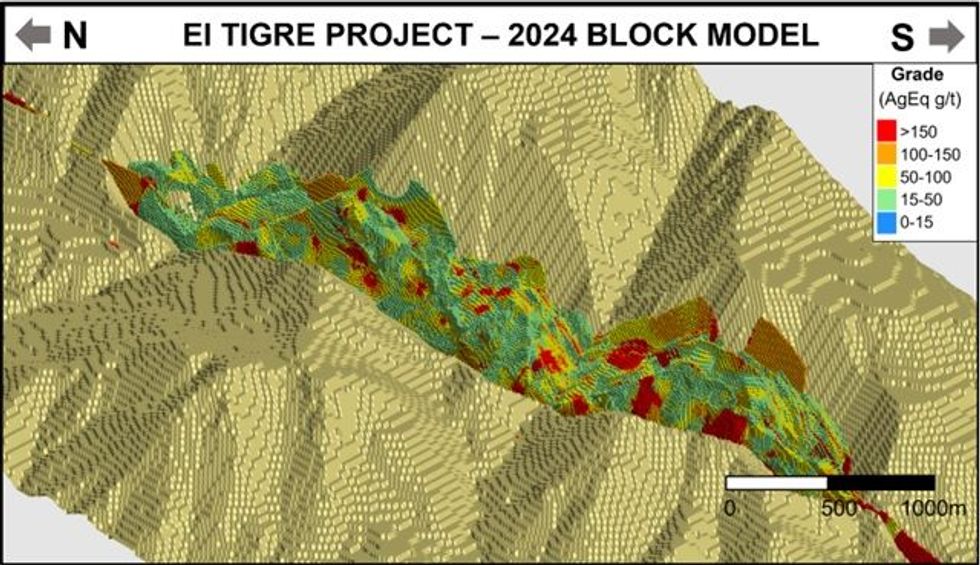
Silver Tiger Metals Inc. (TSXV:SLVR)(OTCQX:SLVTF) ("Silver Tiger" or the "Corporation") is pleased to announce a PreliminaryFeasibility Study ("PFS") for its 100% owned, silver-gold El Tigre Project (the "Project" or "El Tigre") located in Sonora, Mexico. The PFS is focused on the conventional open pit mining economics of the Stockwork Mineralization Zone defined in the updated Mineral Resource Estimate ("MRE") (Figure 1). The updated MRE also contains an Out-of-Pit Mineral Resource that Silver Tiger plans to study in a Preliminary Economic Assessment in H1-2025.
Highlights of the PFS are as follows (all figures in US dollars unless otherwise stated):
- After-Tax net present value ("NPV") (using a discount rate of 5%) of US$222 million with an After-Tax IRR of 40.0% and Payback Period of 2.0 years (Base Case);
- 10-year mine life recovering a total of 43 million payable silver equivalent ounces ("AgEq") or 510 thousand payable gold equivalent ounces ("AuEq"), consisting of 9 million silver ounces and 408 thousand gold ounces;
- Total Project undiscounted after-tax cash flow of US$318 million;
- Initial capital costs of $86.8 million, which includes $9.3 million of contingency costs, over an expected 18-month build, expansion capital of $20.1 million in year 3 and sustaining capital costs of $6.2 million over the life of mine ("LOM");
- Average LOM operating cash costs of $973/oz AuEq, and all in sustaining costs ("AISC") of $1,214/oz AuEq or Average LOM operating cash costs of $12/oz AgEq, and all in sustaining costs ("AISC") of $14/oz AgEq;
- Average annual production of approximately 4.8 million AgEq oz or 56.7 thousand AuEq oz; and
- Three (3) years of production in the Proven category in the Phase 1 Starter Pit.
Glenn Jessome, President & CEO stated "We are very pleased with the work completed by our consultants and our technical team on the PFS for the open pit at El Tigre. The open pit delivers robust economics with an NPV of US$222 million, an initial capital expenditure of US$87 million, and a payback of 2 years with 3 years of production in the Proven category in the ‘Starter Pit using metal prices greatly discounted to the spot price." Mr. Jessome continued "This is a pivotal point for our Company as we now have a clear path forward to making a construction decision for the open pit. The open pit has good grade (48 g/t AgEq), low strip ratio (1.7:1), and wide benches (~150 m) with mineralization at surface. With such positive parameters and with our VP of Operations Francisco Albelais, a career expert in the construction of large heap leach mines in Mexico, we are confident we will be able to advance the Project very quickly." Mr. Jessome concluded "The open pit is only one component of El Tigre as we have also today delivered over 113 Mozs AgEq in the underground Mineral Resource Estimate and disclosed an Exploration Target establishing 10 to 12 million tonnes at 225 to 265 g/t AgEq for 73 to 100 Moz AgEq. This disclosed ‘near-mine' Mineral Resource and potential, when coupled with the fact that only 30% of this prolific Property has been explored, shows the value of the El Tigre Project. The Company will also continue to work on this substantial underground Mineral Resource by starting underground drilling immediately, and plan to release an underground PEA in H1-2025."
Highlights of the updated Mineral Resource
- Increased confidence in MRE, with increase of 132% in Total Measured & Indicated Silver Equivalent ("AgEq") Ounces from September 2023 MRE, with 59% increase in Measured & Indicated AgEq grade;
- Total Measured & Indicated Mineral Resource of 200 Moz AgEq grading 92 g/t AgEq contained in 68.0 million tonnes ("Mt");
- Inferred Mineral Resource of 84 Moz AgEq grading 180 g/t AgEq contained in 14.5 Mt; and
- Inclusion of Out-of-Pit Mineral Resource of 5.3 Mt Measured & Indicated Mineral Resource at grade of 255 g/t AgEq and 10.1 Mt Inferred Mineral Resource grading 216 g/t AgEq.
Preliminary Feasibility Summary
The PFS was prepared by independent consultants P&E Mining Consultants Inc. ("P&E"), with metallurgical test work completed by McClelland Laboratories, Inc. - Sparks, Nevada, process plant design and costing by D.E.N.M. Engineering Ltd., and environmental and permitting led by CIMA Mexico. Following are tables and figures showing key assumptions, results, and sensitivities.
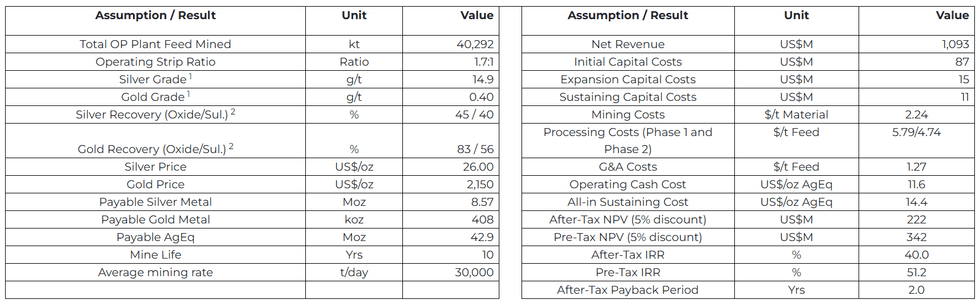
Table 1: El Tigre PFS Key Economic Assumptions and Results
- Grades shown are LOM average process plant feed grades include only OP sources. Mining losses and external dilution of 3.7% were incorporated in the mining schedule.
- Column testing indicated both variable gold and silver recovery for the oxide material vs the previously reported non-discounted PEA (83% and 64%) at a 3/8-in crush size. In the process design and financial model for the PFS process design and financial model recoveries have been discounted by 3% for leaching in the field versus optimum conditions in the laboratory and shown accordingly. The presence of transition and sulfide zones has affected both the gold and silver recoveries and are shown as separate recoveries. These are reasonable and appropriate for use in this PFS design and economic analysis.
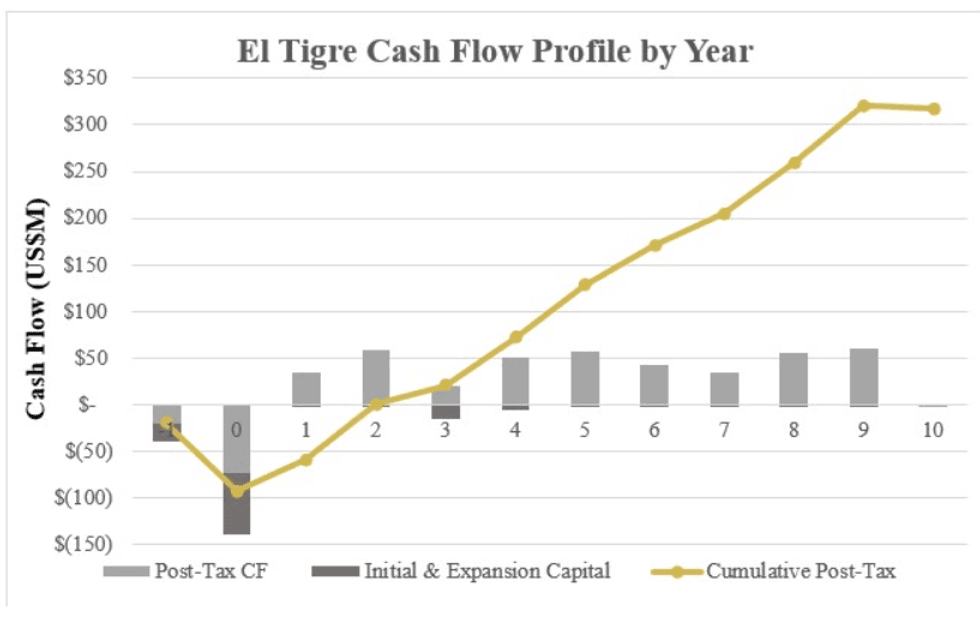
Figure 2: El Tigre Cash Flow Profile by Year
Figure 2 above highlights the post-tax cash flows of US$318 million associated with the El Tigre Project. The economics of the Project have been evaluated based on the base case scenario $26/oz silver price and gold price of $2,150/oz. As illustrated in the following sensitivity tables, the Project remains robust even at lower commodity prices or with higher costs (Tables 2 and 3).
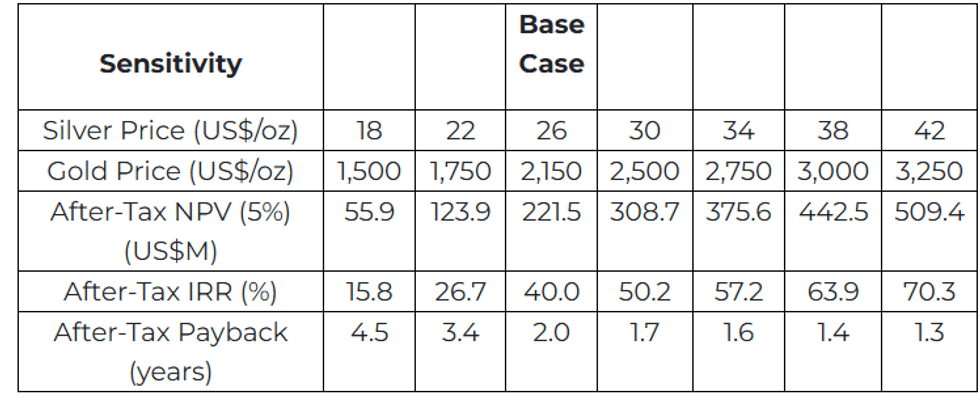
Table 2 - El Tigre PFS Gold and Silver Price Sensitivities
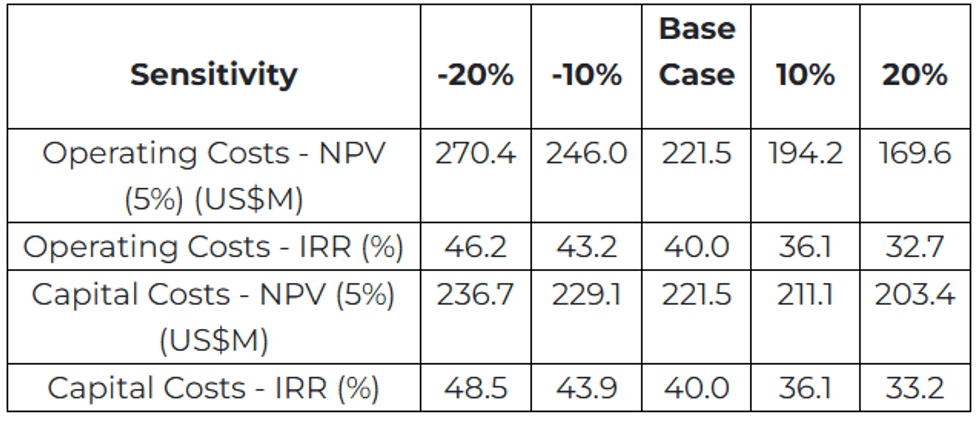
Table 3 - El Tigre PFS Operating Cost and Capital Cost Sensitivities
Capital and Operating Costs
The El Tigre Project has been envisioned as an open pit mining operation starting at a processing rate of 7,500 tonnes per day for years 1-3 and then ramping up to 15,000 tonnes per day by year 4 after 1 year construction for ramp up in year 3.
The process plant is comprised of conventional three (3) stage crushing to an optimum -3/8 inch (10 mm) crush size. The crushed material will be conveyed and loaded on the lined pad areas. A series of pumping and piping will allow irrigation of the stacked heap material and subsequent production of pregnant solution to flow to the respective impoundment pond. The pregnant solution will be pumped to the recovery facility consisting of the Merrill - Crowe process (zinc precipitation) and refinery to produce the gold and silver dore for marketing. The process barren solution will be recycled (with NaCN addition) and pumped back to the heap for further leaching. The process plant location will be adjacent to the pad and pond infrastructure area.
Water supply to the process plant is provided by pumping from nearby Bavispe River to the process area water distribution system and high voltage grid power will be installed by the local utility to supply process and infrastructure electrical requirements. Expansion capital includes the cost to increase the process plant capacity from 7,500 tonnes per day to 15,000 tonnes per day as noted in Year 4 of operation.
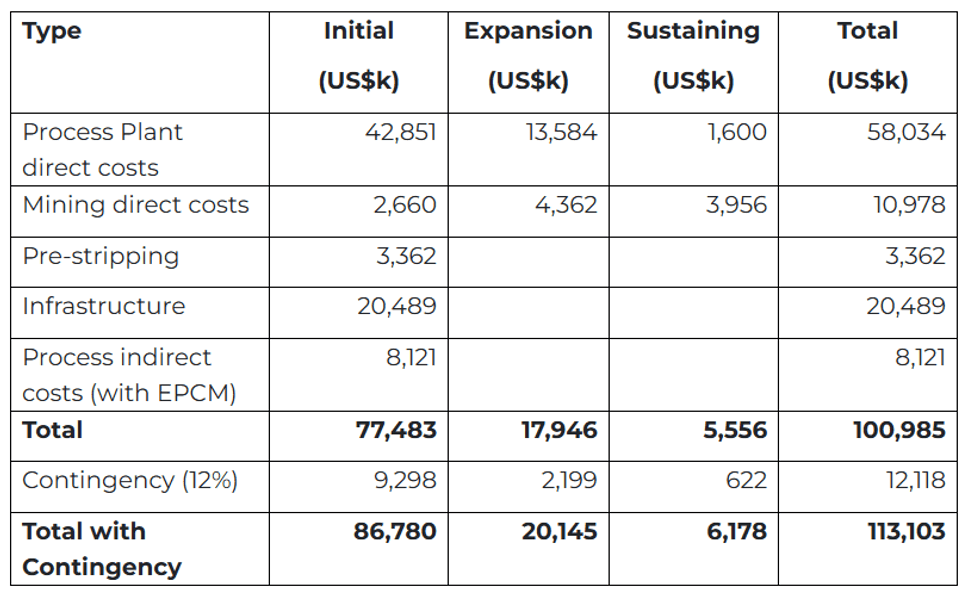
Table 4 - LOM Capital Cost Estimate
Mining
Open pit mining will be contracted and carried out by drill and blast followed by conventional loading and truck haulage to the waste rock storage facilities and the process plant.
Metallurgy
A detailed metallurgical test program was carried out by McClelland Laboratories, Inc., Sparks, Nevada on six (6) El Tigre starter pit samples. The program included crushing, coarse bottle rolls, and column testing at both 80% passing 3/8 inch and 1/2 inch (10 and 12 mm) crush size for five (5) of the six samples. One low grade sample was only crushed to 80% passing 1-1/2 inch (38 mm) as an indication of low grade leachability. The leach samples comprised of drill core sample representing the starter pit and during the testing process it became apparent that the presence of transition and sulfide zones are in the starter pit thus affecting the base design recoveries. This variable test program (column and coarse bottle roll) estimated oxide average gold and silver respective metallurgical recoveries of 86% Au and 48% Ag at the 3/8 inch (10 mm) crush. The transition and sulfide zones had estimated recoveries of 59% Au and 43% Ag. Further percolation testing also confirmed no requirement for agglomeration of the crushed material is required prior to loading on the leach pad.
Mineral Resource Estimate
The basis for the PFS is the Mineral Resource Estimate completed by P&E for the El Tigre Project located in Sonora State, Mexico, which has an effective date of October 22, 2024, with an NI 43-101 Technical Report to be filed within 45 days of this news release. A summary of the Mineral Resource Estimate is provided in Table 5.
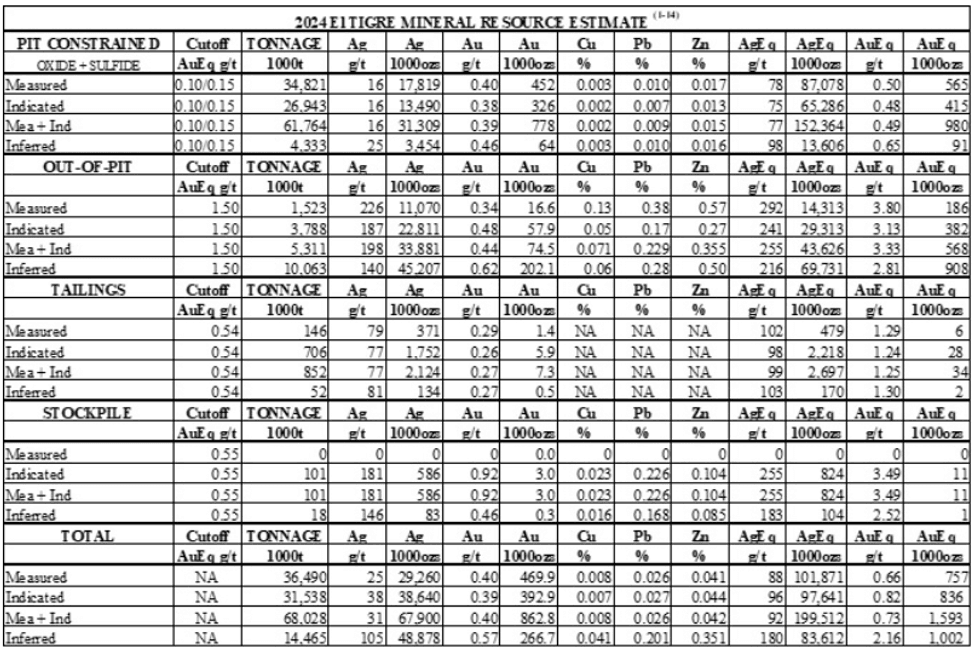
Table 5 - Updated Mineral Resource Estimate October 2024
- Mineral Resources, which are not Mineral Reserves, do not have demonstrated economic viability. The estimate of Mineral Resources may be materially affected by environmental, permitting, legal, title, taxation, socio-political, marketing, or other relevant issues.
- The Inferred Mineral Resource in this estimate has a lower level of confidence than that applied to an Indicated Mineral Resource and must not be converted to a Mineral Reserve. It is reasonably expected that the majority of the Inferred Mineral Resource could be upgraded to an Indicated Mineral Resource with continued exploration.
- The Mineral Resources were estimated in accordance with the Canadian Institute of Mining, Metallurgy and Petroleum (CIM), CIM Standards on Mineral Resources and Reserves, Definitions and Guidelines prepared by the CIM Standing Committee on Reserve Definitions and adopted by the CIM Council.
- Historically mined areas were depleted from the Mineral Resource model.
- Prices used are US$2,000/oz Au, US$25/oz Ag, US$4.00/lb Cu, US$0.95 lb Pb and US$1.25/lb Zn.
- The pit-constrained AuEq respective oxide and sulfide cut-off grades of 0.10 and 0.15 g/t were derived from 40% Ag and 83% Au oxide process recovery, 40% Ag and 56% Au sulfide process recovery, US$5.25/tonne process and G&A cost. The constraining pit optimization parameters were $2.00/t mining cost and 45-degree pit slopes. Regarding recoveries, the PFS recovery for Ag in oxide material was increased to 45% after a more detailed study was complete after the MRE was finalized.
- The out-of-pit AuEq cut-off grade of 1.50 g/t was derived 93% Ag and 89% Au process recovery, US$28/tonne process and G&A cost, and a $60/tonne mining cost. The out-of-pit Mineral Resource grade blocks were quantified above the 1.50 g/t AuEq cut-off, below the constraining pit shell and within the constraining mineralized wireframes. Out-of-Pit Mineral Resources are restricted to the El Tigre Main Veins, which exhibit historical continuity and reasonable potential for extraction by cut and fill and long hole mining methods.
- The Low-Grade Stockpile AuEq cut-off grade of 0.54 g/t was derived from 85% Ag and 85% Au recovery US$28/tonne process and G&A cost, and a $2/tonne mining cost.
- The Tailings AuEq cut-off grade of 0.55 g/t was derived from 82% Ag and 83% Au process recovery, US$28.72/tonne process and G&A cost.
- AgEq and AuEq were calculated at an Ag/Au ratio of 166:1 (oxide) and 122:1 (sulfide) for pit-constrained Mineral Resources.
- AgEq and AuEq were calculated at an Ag/Au ratio of 77:1 for out-of-pit Mineral Resources.
- AgEq and AuEq were calculated at an Ag/Au ratio of 80:1 for Low-Grade Stockpile Mineral Resources.
- AgEq and AuEq were calculated at an Ag/Au ratio of 79:1 for Tailings Mineral Resources
- Totals may not sum due to rounding.
Mineral Resource Estimate Methodology - El Tigre Project
The El Tigre Project includes the El Tigre Veins, El Tigre Tailings and the El Tigre Low-Grade Stockpile.
The databases used for this Mineral Resource update contain a total of 20,149 collar records that contribute directly to the Mineral Resource Estimate and includes collar, survey, assay, lithology and bulk density data. Assay data includes Au g/t, Ag g/t, Cu %, Pb % and Zn % grades. The drilling extends approximately five km along strike.
P&E Mining Consultants Inc. ("P&E") collaborated with Silver Tiger personnel to develop the mineralization models, grade estimates, and reporting criteria for the Mineral Resources at El Tigre. Mineralized domains were initially developed by Silver Tiger and were reviewed and modified by P&E. A total of twenty-seven individual mineralized domains have been identified through drilling and surface sampling. Interpreted mineralization wireframes were developed by Silver Tiger geologists for the El Tigre Veins based on logged drill hole lithology, assay grades and historical records. Silver Tiger identified continuous zones of mineralization from assay grades equal to or greater than 0.30 g/t AuEq with observed continuity along strike and down-dip, using a calculated Ag:Au equivalent factor of 75:1. The selected intervals include lower grade material where necessary to maintain wireframe continuity between drill holes.
P&E developed mineralized domains for the El Tigre Low-Grade Stockpile and the El Tigre Tailings based on lithological logging and LiDAR surface topography.
Assay samples were composited to either 1.00 m or 1.50 m for the vein domains. No compositing was used for the Low-Grade Stockpiles and Tailings models. Composites were capped prior to grade estimation based on the analysis of individual composite log-probability distributions.
A total of 5,542 bulk density values were taken by Silver Tiger from drill hole core. Mineralized bulk density values were assigned for each of the El Tigre Main Veins based on the median vein measurement. For the El Tigre North Veins, a bulk density of 2.65 t/m 3 was assigned for the veins and a value of 2.42 t/m 3 was assigned for the Protectora Halo. For the Low-Grade Stockpile a value of 1.60 t/m 3 was assigned, and for the Tailings a value of 1.39 t/m 3 was used based on 37 nuclear density measurements.
Vein block grades for gold and silver were estimated by Inverse Distance Cubed ("ID3") interpolation of capped composites using a minimum of four and a maximum of twelve composites. Vein block grades for copper, lead and zinc were estimated by Inverse Distance Squared ("ID2") interpolation of capped composites using a minimum of four and a maximum of twelve composites.
Nearest-Neighbour grade interpolation was used for the Low-Grade Stockpiles, and for the Tailings, block grades were estimated by ID2 estimation of capped assays using a minimum of four and a maximum of twelve samples.
For the El Tigre Main Veins, blocks within 30 m of three or more drill holes/channels were classified as Measured Mineral Resources, and blocks within 60 m of three or more drill holes/channels were classified as Indicated Mineral Resources. All additional estimated blocks were classified as Inferred Mineral Resources.
For the North Veins, blocks interpolated by at least two drill holes within 50 m were classified as Indicated Mineral Resources. Blocks interpolated by at least one drill hole within a maximum distance of 200 m were classified as Inferred Mineral Resources.
For the Low-Grade Stockpiles, blocks within 15 m of two or more drill holes were classified as Indicated Mineral Resources. All additional estimated blocks were classified as Inferred Mineral Resources.
For the Tailings, blocks within 30 m of three or more auger or core drill holes were classified as Measured Mineral Resources. Blocks within 60 m of two or more auger/drill holes/pits or trenches were classified as Indicated Mineral Resources. All additional estimated blocks were classified as Inferred Mineral Resources.
P&E considers that the block model Mineral Resource Estimates and Mineral Resource classification represent a reasonable estimation of the global mineral resources for the El Tigre Project with regard to compliance with generally accepted industry standards and guidelines, the methodology used for estimation, the classification criteria used and the actual implementation of the methodology in terms of Mineral Resource estimation and reporting. The Mineral Resources have been estimated in conformity with the requirements of the CIM "Estimation of Mineral Resource and Mineral Reserves Best Practices" guidelines as required by the Canadian Securities Administrators' National Instrument 43-101. Mineral Resources are not Mineral Reserves and do not have demonstrated economic viability.
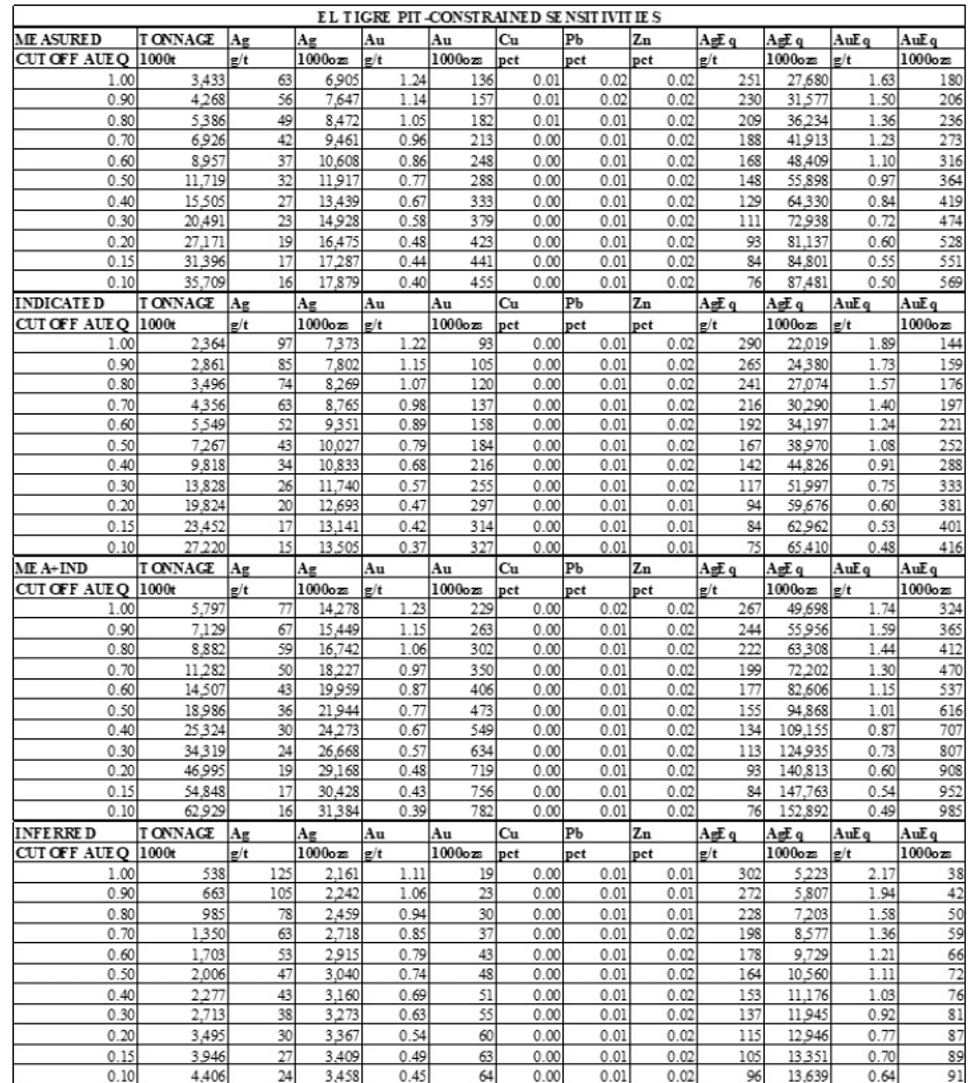
Table 6: AuEq Cut-off Sensitivities - ET Pit-Constrained Mineral Resource
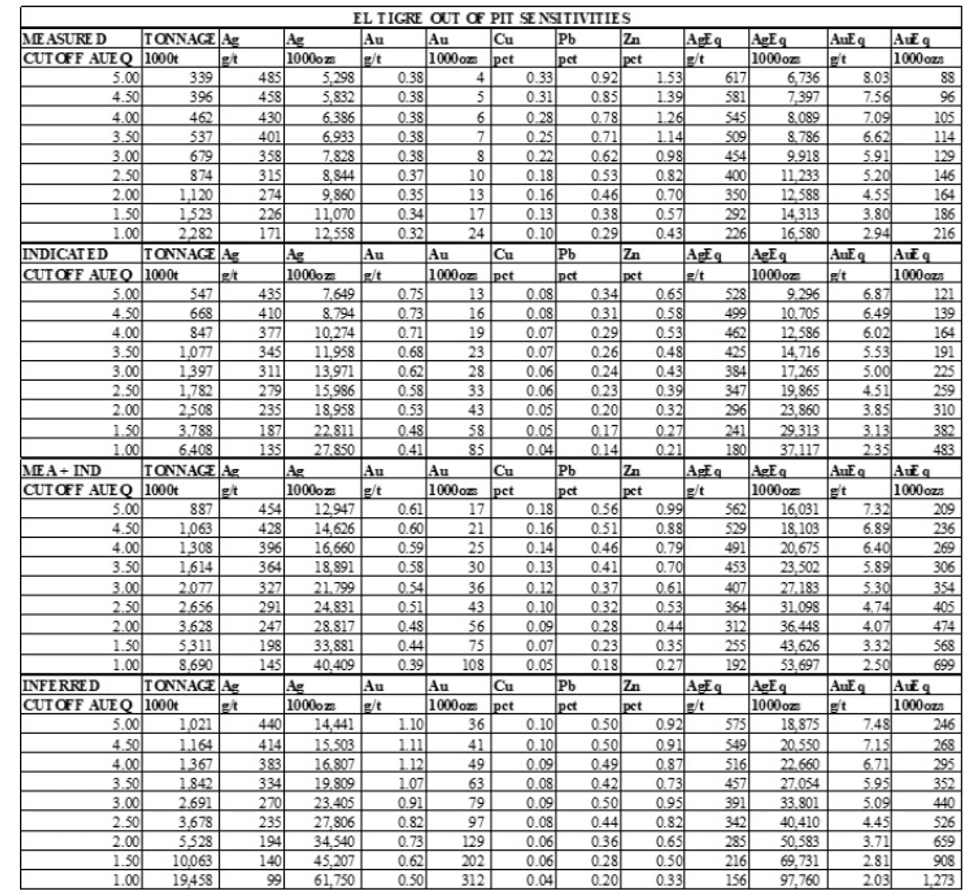
Table 7: AuEq Cut-off Sensitivities - ET Out-of-Pit Mineral Resource
Exploration Potential
Exploration potential at the El Tigre Project is substantial with prospective areas for exploration both down dip and along strike with the disclosed Exploration Target establishing 10 to 12 million tonnes at 225 to 265 g/t AgEq for 73 to 100 Moz AgEq.
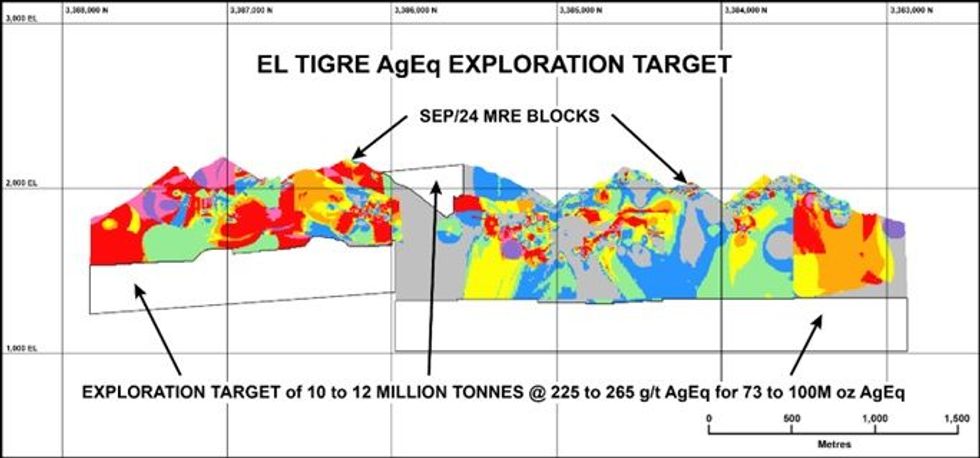
Figure 3-Exploration Potential released October 2024
Surface Rights Agreement
The Company owns royalty-free, 100% of the 6,238 hectares land-package encompassing the footprint of proposed mining operation with no Ejido presence. In addition, the Company controls 28,414 hectares of Concessions to conduct exploration along a 25 km strike length of the Sierra Madres.
Underground Preliminary Economic Assessment
The Company will also continue to work on this substantial, permitted underground Mineral Resource Estimate and advance this towards a Preliminary Economic Assessment by H1-2025. The Measured and Indicated Out-of-Pit Mineral Resource at El Tigre is 44 Moz AgEq grading 255 g/t AgEq contained in 5.3 Mt and the Inferred Mineral Resource is 70 Moz AgEq grading 216 g/t AgEq contained in 10.1 Mt.
Qualified Persons
Mineral Resource Estimate: Dave Duncan P. Geo. VP Exploration of Silver Tiger, Charles Spath P.Geo., VP of Technical Services of Silver Tiger, and Fred Brown, P.Geo RM-SME Senior Associate Geologist of P&E Mining Consultants, and Eugene Puritch, P.Eng., FEC, CET, President of P&E Mining Consultants are the Qualified Persons as defined under National Instrument 43-101. All Qualified Persons have reviewed and approved the scientific and technical information in this press release.
Preliminary Feasibility Study: Andrew Bradfield P. Eng of P&E Mining Consultants, Eugene Puritch, P.Eng., FEC, CET, President of P&E Mining Consultants and David J. Salari, P. Eng. of D.E.N.M. Engineering Ltd are the Qualified Persons as defined under National Instrument 43-101. All Qualified Persons have reviewed and approved the scientific and technical information in this press release.
A Technical Report is being prepared on the Preliminary Feasibility Study in accordance with National Instrument 43-101 ("NI-43-101"), and will be available on the Company's website and SEDAR within 45 days of the date of this news release. The effective date of this Preliminary Feasibility Study is October 22, 2024.
VRIFY Slide Deck and 3D Presentation - Silver Tiger's El Tigre Project
VRIFY is a platform being used by companies to communicate with investors using 360° virtual tours of remote mining assets, 3D models and interactive presentations. VRIFY can be accessed by website and with the VRIFY iOS and Android apps.
Access the Silver Tiger Metals Inc. Company Profile on VRIFY at: https://vrify.com
The VRIFY Slide Deck and 3D Presentation for Silver Tiger Metals Inc. can be viewed at: https://vrify.com/explore/decks/492 and on the Corporation's website at: www.silvertigermetals.com.
About Silver Tiger and the El Tigre Historic Mine District
Silver Tiger Metals Inc. is a Canadian company whose management has more than 25 years' experience discovering, financing and building large epithermal silver projects in Mexico. Silver Tiger's 100% owned 28,414 hectare Historic El Tigre Mining District is located in Sonora, Mexico. Principled environmental, social and governance practices are core priorities at Silver Tiger.
The El Tigre historic mine district is located in Sonora, Mexico and lies at the northern end of the Sierra Madre silver and gold belt which hosts many epithermal silver and gold deposits, including Dolores, Santa Elena and Las Chispas at the northern end. In 1896, gold was first discovered on the property in the Gold Hill area and mining started with the Brown Shaft in 1903. The focus soon changed to mining high-grade silver veins in the area with production coming from 3 parallel veins the El Tigre Vein, the Seitz Kelley Vein and the Sooy Vein. Underground mining on the middle El Tigre Vein extended 1,450 metres along strike and was mined on 14 levels to a depth of approximately 450 metres. The Seitz Kelley Vein was mined along strike for 1 kilometre to a depth of approximately 200 metres. The Sooy Vein was only mined along strike for 250 metres to a depth of approximately 150 metres. Mining abruptly stopped on all 3 of these veins when the price of silver collapsed to less than 20¢ per ounce with the onset of the Great Depression. By the time the mine closed in 1930, it is reported to have produced a total of 353,000 ounces of gold and 67.4 million ounces of silver from 1.87 million tons (Craig, 2012). The average grade mined during this period was over 2 kilograms silver equivalent per ton.
For further information, please contact:
Glenn Jessome
President and CEO
902 492 0298
jessome@silvertigermetals.com
CAUTIONARY STATEMENT:
Neither TSX Venture Exchange nor its Regulation Services Provider (as that term is defined in the policies of the TSX Venture Exchange) accepts responsibility for the adequacy or accuracy of this news release.
This News Release includes certain "forward-looking statements". All statements other than statements of historical fact included in this release, including, without limitation, statements regarding potential mineralization, Mineral Resources and Reserves, the ability to convert Inferred Mineral Resources to Indicated Mineral Resources, the ability to complete future drilling programs and infill sampling, the ability to extend Mineral Resource blocks, the similarity of mineralization at El Tigre to Delores, Santa Elena and Chispas, exploration results, and future plans and objectives of Silver Tiger, are forward-looking statements that involve various risks and uncertainties. Forward-looking statements are frequently characterized by words such as "may", "is expected to", "anticipates", "estimates", "intends", "plans", "projection", "could", "vision", "goals", "objective" and "outlook" and other similar words. Although Silver Tiger believes the expectations expressed in such forward-looking statements are based on reasonable assumptions, there can be no assurance that such statements will prove to be accurate and actual results and future events could differ materially from those anticipated in such statements. Important factors that could cause actual results to differ materially from Silver Tiger's expectations include risks and uncertainties related to exploration, development, operations, commodity prices and global financial volatility, risk and uncertainties of operating in a foreign jurisdiction as well as additional risks described from time to time in the filings made by Silver Tiger with securities regulators.
SLVR:CC
The Conversation (0)
03 September
What Was the Highest Price for Silver?
Like its sister metal gold, silver has been attracting renewed attention as a safe-haven asset.
Although it continues to exhibit its hallmark volatility, many silver investors believe that a bull market is starting up for the precious metal. Experts are optimistic about the future, and as a result, some market watchers are looking for price forecasts and asking, “What was the highest price for silver?”
The answer reveals how much potential there is for the silver price to rise. Read on for a look at silver's historical moves, and what they could mean for both the price of silver today and the white metal’s price in the future.
In this article
How is silver traded?
Before discovering what the highest silver price was, it’s worth looking at how the precious metal is traded. Knowing the mechanics can be useful in understanding why and how its price changes on a day-to-day basis and beyond.
Put simply, silver bullion is traded in dollars and cents per ounce, with market activity taking place worldwide at all hours, resulting in a live silver price. Key commodities markets like New York, London and Hong Kong are just a few locations where investors trade the metal. London is seen as the center of physical silver trade, while the COMEX division of the New York Mercantile Exchange, called the NYMEX, is where most paper trading is done.
There are two popular ways to invest in silver. The first is through purchasing silver bullion products such as bullion bars, bullion coins and silver rounds. Physical silver is sold on the spot market, meaning that in order to invest in silver this way, buyers pay a specific price for the metal — the silver price per ounce — and then have it delivered immediately.
The second is accomplished through paper trading, which is done via the silver futures market, with participants entering into futures contracts for the delivery of silver at an agreed-upon price and time. In such contracts, two positions can be taken: a long position to accept delivery of the metal or a short position to provide delivery.
Paper trading might sound like a strange way to get silver exposure, but it can provide investors with flexibility that they wouldn’t get from buying and selling bullion. The most obvious advantage is perhaps the fact that trading in the paper market means silver investors can benefit long term from holding silver without needing to store it. Furthermore, futures trading can offer more financial leverage in that it requires less capital than trading in the physical market.
Market participants can also invest in silver through exchange-traded funds (ETFs). Investing in a silver ETF is similar to trading a stock on an exchange, and there are several silver ETFs to choose from. Some ETFs focus on physical silver bullion, while others focus on silver futures contracts. Still others focus on the silver stocks or follow the live silver price.
What is silver's all-time high price?
The silver all-time high was US$49.95 per ounce, a level it reached on January 17, 1980.
However, the price didn’t exactly reach that level by honest means. As Britannica explains, two wealthy traders called the Hunt brothers attempted to corner the market by buying not only physical silver, but also silver futures — they took delivery of those silver futures contracts instead of taking legal tender in the form cash settlements.
Their exploits ultimately ended in disaster: On March 27, 1980, they missed a margin call and the silver market price plunged to US$10.80. This day is infamously known as Silver Thursday.
That record silver price wouldn’t be tested again until April 2011, when it reached US$47.94. This was more than triple the 2009 average silver price of US$14.67, with the price uptick coming on the back of very strong investment demand.
Silver's recent price history
After its 2011 peak, silver's price pulled back over the following years before settling between US$15 and US$20 for much of the second half of last decade. An upward trend in the silver price started in mid-2020, when it was spurred on by the economic uncertainty surrounding the COVID-19 pandemic. The price of silver breached the key US$26 level in early August 2020, and soon after tested US$30. However, it failed to make substantial progress past that.
Silver price chart, September 2, 2005, to September 2, 2025.
Chart via SilverPrice.org.
In the spring of 2023, the silver price surged by 30 percent, briefly rising above US$26 in early May; however, the precious metal cratered back down to US$20.90 in early October. Later that month, silver advanced toward the US$23 level on the back of safe-haven demand due to the outbreak of the Israel-Hamas war.
Following remarks from US Federal Rerserve Chair Jerome Powell, speculation about interest rate reductions sent the price of silver to US$25.48 on November 30, its highest point for the fourth quarter.
After starting 2024 on a low note, the white metal saw gains in March on rising Fed rate cut expectations. The resulting upward momentum led silver to reach a Q1 high of US$25.62 on March 20 before breaking through the US$30 mark on May 17. The silver price reached a then 12 year high of US$32.33 on May 20. In Q3, the metal's price slid down below the US$27 mark to as low as US$26.64 by August 7 alongside its industrial cousin copper.
Heading into Q4 2024, silver reversed course to the upside, tracking the record breaking moves in the gold price. Silver once again breached the US$30 level on September 13 and continued higher. On October 21, the silver price moved as high as US$34.20 during the trading day, up more than 48 percent since the start of the year and its highest level in 12 years. However, silver spent the rest of the year in decline, bottoming out at US$28.94 on December 30.
Silver price in 2025
The silver price experienced a momentum shift at the start of 2025, breaking through the US$30 barrier as early as January 5, and reached US$31.31 by January 29. The metal continued to post gains through much of February and March, climbing to US$32.94 on February 20 and then peaking at its quarterly high of US$34.21 on March 28.
Silver price chart, September 2, 2024, to September 2, 2025.
Chart via Silverprice.org.
Following US President Donald Trump's tariff announcements on April 2, silver slumped to below US$30. While the Trump administration’s tariff policies have been largely beneficial for safe-haven assets like precious metals, there were concerns that the threat of tariffs could weaken industrial demand, which could cool price gains in the silver market.
Yet those concerns were pushed to the back burner as recent economic and geopolitical events have raised analysts’ expectations of a September rate cut by the Fed. The benchmark rate has not changed since November 2024.
On June 5, the silver price rose to a 13 year high of US$36.05 in early morning trading, before retreating toward the US$35.50 mark. By June 16, the white metal had broken through the US$37 mark for the first time since May 2011.
In July, increasing geopolitical strife in the Middle East and Russia-Ukraine coupled with a positive outlook for China’s solar power industry proved price positive for both silver’s precious metals and industrial angles.
The silver price overtook the US$39 level to reach US$39.24 on July 22.
These same forces, coupled with the nearly unanimous rate cut expectations, launched the price of silver to over US$40 on August 31 for the first time since 2011, and by September 3 it had climbed as high as US$41.45.
Silver supply and demand dynamics
Market watchers are curious as to whether the silver price will continue its upward trajectory in 2025. Only time will tell, and it will depend on the white metal's ability to remain above the critical US$30 level.
Like other metals, the silver spot price is most heavily influenced by supply and demand dynamics. However, as the information above illustrates, the silver price can be highly volatile. That's partially due to the fact that the metal is subject to both investment and industrial metal demand within global markets.
In other words, it’s bought by investors who want it as a store of wealth, as well as by manufacturers looking to use it for different applications that are incredibly varied. For example, silver has diverse technological applications and is used in devices like batteries and catalysts, but it’s also used in medicine and in the automotive industry.
In terms of supply, the world’s three top producers of the metal are Mexico, China and Peru. Even in those countries silver is usually a by-product — for instance, a mine producing primarily gold or lead might also have silver output.
The Silver Institute's latest World Silver Survey, put together by Metals Focus, outlines a 0.9 percent increase in global mine production to 819.7 million ounces in 2024. This was in partly the result of a return to operations at Newmont's (TSX:NGT,NYSE:NEM,ASX:NEM) Peñasquito mine in Mexico following a suspension of activity brought about by strike action among workers and improved recoveries out of Fresnillo (LSE:FRES,OTC Pink:FNLPF) and MAG Silver's (TSX:MAG,NYSEAMERICAN:MAG) Juanicipio. Silver output also increased in Australia, Bolivia and the US.
The firm is forecasting a 1.9 percent rise in global silver mine production to 823 million ounces in 2025. Much of that growth is expected to come out of Mexico, and it is also projecting output will rise in Chile and Russia.
Lower production from Australia and Peru will offset some of these gains.
Looking at demand, Metals Focus sees growth in 2025 flatlining as industrial fabrication takes a hit from the global tariff war. This could be tempered by an anticipated rebound in demand from physical investment in silver bars and coins.
The silver market is expected to experience a substantial deficit of 117.6 million ounces in 2025, amounting to the sixth straight year of supply shortage for the metal.
Is the silver price manipulated?
As a final note on silver, it’s important for investors to be aware that manipulation of prices is a major issue in the space.
For instance, in 2015, 10 banks were hit in a US probe on precious metals manipulation. Evidence provided by Deutsche Bank (NYSE:DB) showed “smoking gun” proof that UBS Group (NYSE:UBS), HSBC Holdings (NYSE:HSBC), the The Bank of Nova Scotia (TSX:BNS) and other firms were involved in rigging silver rates from 2007 to 2013. In May 2023, a silver manipulation lawsuit filed in 2014 against HSBC and the Bank of Nova Scotia was dismissed by a US court.
JPMorgan Chase & Co. (NYSE:JPM) has been long at the center of silver manipulation claims as well. For years the firm has been in and out of court for the accusations. In 2020, JPMorgan agreed to pay US$920 million to resolve federal agency probes regarding the manipulation of multiple markets, including precious metals.
In 2014, the London Silver Market Fixing stopped administering the London silver fix, which had been used for over a century to fix the price of silver. It was replaced by the LBMA Silver Price, which is run by ICE Benchmark Administration, in a bid to increase market transparency.
Market watchers like Ed Steer have said that the days of silver manipulation are numbered, and that the market will see a significant shift when the time finally comes.
Investor takeaway
While silver has neared US$50 multiple times, including its all-time high, it’s anyone’s guess whether it will reach those heights once again. Many commentators say prospects are bright for silver, and investors will no doubt be watching to see how the metal fares.
This is an updated version of an article first published by the Investing News Network in 2015.
Don’t forget to follow us @INN_Resource for real-time news updates!
Securities Disclosure: I, Melissa Pistilli, currently hold no direct investment interest in any company mentioned in this article.
Keep reading...Show less
02 September
Silver Price Surges Above US$40 for First Time Since 2011
The silver price surged on Tuesday (September 2), breaking US$40 per ounce to rise as high as US$40.93.
Silver was last above US$40 in 2011, peaking that year at US$47.94 in April.
Many of the same factors that drove the silver price to that level in 2011 are present in today’s market, including significant uncertainty around the economy, a global debt crisis and a dovish US Federal Reserve policy.
Silver price chart, June 1 to September 2, 2025.
Chart via the Investing News Network.
Alongside silver's move, the gold price reached a fresh all-time high on Tuesday as expectations rose that the Fed will cut interest rates when it meets next from September 16 to 17.
Although inflation has been moving further from the Fed’s 2 percent target, there has been greater uncertainty in the labor force. July’s nonfarm payroll report indicated slowing growth in the jobs market and featured a downward revision of 258,000 fewer jobs in May and June combined. The next report, due on Friday (September 5), has analysts predicting further weakness in the US jobs market, with expectations of 73,000 jobs being added to the economy.
A weak jobs market has been fueled by uncertainty within the economy since the start of the year amid an ever-changing tariff policy under President Donald Trump. On August 29, a federal appeals court struck down the majority of Trump’s tariffs in a seven-to-four ruling, deeming the levies to be unconstitutional.
The tariffs will remain in place until October 14, giving the White House time to mount an appeal of the decision with the Supreme Court of the US. The order adds another level of uncertainty to an already chaotic market, pushing 10 and 30 year bond yields up and driving a selloff in equity markets. Investors are spooked that the ruling may require the government to repay tariffs that have already been collected, adding to the ballooning US federal debt.
The silver price is also benefiting from the high gold price, as some investors look for safe-haven assets at lower entry points. Additionally, silver has increasing industrial applications, which have driven a structural supply deficit in the market, providing underlying fundamental support for investors.
Don't forget to follow us @INN_Resource for real-time updates!
Securities Disclosure: I, Dean Belder, hold no direct investment interest in any company mentioned in this article.
Keep reading...Show less
02 September
Silver Stocks: 5 Biggest Companies in 2025
During 2025, silver has continued to build on gains made in the previous year, soaring above US$40 per ounce in early September.
The gains have been driven by several factors, most notably the tightening of supply and demand fundamentals, resulting from higher demand from industrial sectors and its use in photovoltaics.
Additionally, prices have found tailwinds from safe-haven investors who find silver's lower entry price compared to gold appealing. The moves have been fueled by uncertainty in the global financial markets as the United States implements its new trade and tariff policies. Investors have also been unsettled by an escalating tension in the Middle East and the unresolved conflict between Russia and Ukraine.
Below is an overview of the five largest silver-mining stocks by market cap as of August 25, 2025, as per data gathered using TradingView’s stock screener. Read on to learn more about the activities and operations of these large-cap silver stocks.
1. Pan American Silver (TSX:PAAS)
Market cap: C$16.35 billion
Share price: C$45.06
Pan American Silver is among the world’s largest primary silver producers, with silver assets located throughout the Americas and operations in Peru, Mexico, Bolivia, Argentina and Chile.
According to its Q2 report, released on August 6, overall, the company produced 5.1 million ounces of silver during the period. Its largest silver-producing asset is the La Colorada mine in Mexico, which produced 1.51 million ounces of silver during the quarter.
Other significant contributors to its silver production were its El Peñon gold-silver mine in Chile at 968,000 ounces of silver, Huaron in Peru at 844,000 ounces, San Vicente in Bolivia at 755,000 ounces, Cerro Moro in Argentina at 488,000 ounces and Dolores in Mexico at 291,000 ounces.
The company also reaffirmed its 2025 operating outlook and expects full year silver production in the 20 million to 21 million ounce range, with all in sustaining costs in the US$16.25 to US$18.25 per ounce range.
Additionally, the company announced on May 11 that it had entered into a definitive agreement to acquire all of the issued and outstanding shares of MAG Silver (TSX:MAG,OTC Pink:FNLPF). Under the terms of the US$2.1 billion deal, MAG shareholders will be paid out a mix of cash totaling US$500 million and 0.755 shares in Pan American per MAG share.
Once complete, Pan American will control 44 percent of the Juanicipio mine in Central Mexico. The mine is operated by Fresnillo (LSE:FRES), which holds the remaining 56 percent.
Pan American announced on August 25 that the Mexican Federal Economic Competition Commission approved the deal and expects the acquisition to be completed on approximately September 4.
2. First Majestic Silver (TSX:AG)
Market cap: C$6.03 billion
Share price: C$12.36
First Majestic has three wholly owned silver-producing mines in Mexico: San Dimas in Durango, Santa Elena in Sonora and La Encantada in Coahuila. The first two also produce gold.
The company holds a 70 percent stake in the Los Gatos silver mine in Chihuahua as well. First Majestic acquired the property in January 2025 through a merger with Gatos Silver. Japan's Dowa Holdings (TSE:5714) holds the remaining 30 percent interest.
In addition to its producing assets, First Majestic commenced bullion sales from its own minting facility in Nevada, US, named First Mint, in March 2024.
According to its Q2 2025 report, the company produced 3.7 million ounces of silver during the quarter, a 76 percent increase year-over-year, and set a record quarterly revenue of US$264.2 million.
Its recently acquired Los Gatos was its largest producer, delivering more than 1.52 million ounces of attributable silver. San Dimas took second place at 1.24 million ounces, while La Encantada and Santa Elena produced 628,105 ounces and 306,224 ounces respectively.
3. MAG Silver (TSX:MAG)
Market cap: C$3.39 billion
Share price: C$32.71
MAG Silver is a silver production company that has a 44 percent stake in the Juanicipio mine in Zacatecas, Mexico. Fresnillo owns the remaining 56 percent of the operation.
In addition to Juanicipio, the company also has two exploration projects, Deer Trail and Larder. Deer Trail is a silver, gold, lead, zinc and copper property in Utah, US, that hosts a historic mine, and Larder is a gold project located in Ontario, Canada.
In the company’s Q2 2025 financial results on May 8, MAG Silver reported mining operations at Juanicipio had produced 4.3 million ounces of silver during the second quarter of the year. Additionally, ongoing optimizations at the site's processing plant boosted silver recovery to 94.6 percent in Q2, up from 92.4 percent during the same period last year.
On May 11, MAG announced that it had entered into a definitive agreement to be acquired by Pan American Silver in a US$2.1 billion deal. According to an announcement from Pan American, it is expected to close in September 2025.
4. Endeavour Silver (TSX:EDR)
Market cap: C$2.3 billion
Share price: C$7.99
Endeavour Silver is a silver company with two operating silver-gold mines in Mexico — Guanaceví and Bolañitos — plus the commissioning-stage Terronera project and several exploration properties.
On May 1, the company announced that it had completed the acquisition of Compañia Minera Kolpa and the Huachocolpa Uno mine in Peru. The terms of the deal will see Endeavour pay total considerations of US$145 million in a combination of cash and Endeavour shares to Kopla shareholders.
Endeavour has also agreed to pay an additional US$10 million in cash in contingent payments if certain events are met, and will add US$20 million in net debt, which will remain outstanding and repayable by Minera Kolpa.
In the company's
Q2 earnings report, Endeavour reported silver production of 1.48 million ounces, 13 percent higher than during the second quarter of 2024. The company attributed the increased production to the acquisition of Kolpa.
The company also provided an update on development at Terronera, which is nearing commercial production. As of the end of July, milling rates had increased to 1,900 and 2,000 metric tons per day, with average silver recoveries of 71 percent.
5. Vizsla Silver (TSX:VZLA)
Market cap: C$1.66 billion
Share price: C$4.83
Vizsla Silver is advancing its Panuco silver-gold project in Sinaloa, Mexico, toward production with the development of the Copala test mine.
Viszla released an updated preliminary economic assessment for the Panuco project on February 20, suggesting a post tax net present value of US$1.14 billion with an internal rate of return of 85.7 percent and a pay back period of less than 1 year.
Measured and indicated silver resources at the site totaled 127.82 million ounces of contained silver from 12.96 million metric tons of ore with an average grade of 307 grams per metric ton (g/t) silver. Its inferred resource totals 73.62 million ounces of silver from 10.47 million metric tons of ore with an average grade of 219 g/t.
On June 18, Vizsla reported that it had advanced 125 meters at its Copala test mine and is progressing at a rate of 4 meters per day. Once the development reaches the main deposit, Vizsla will take a 10,000 metric ton bulk sample. The portal will also serve as the primary access for underground mining operations once a construction decision is made.
Additionally, in May, the company entered into an agreement to acquire the producing Santa Fe silver-gold mine and property located to the south of Panuco.
The property hosts operating mining infrastructure, including a processing plant and an underground mine built in 2018. Between 2020 and 2024, the mine processed 370,366 metric tons of ore, with an average head grade of 203 g/t silver and 2.17 g/t gold.
Under the terms of the agreement, Vizsla will have the option to acquire a 100 percent interest in the Santa Fe producing concessions for US$4 million in exploration expenditures, along with cash considerations of US$1.5 million and 1.37 million Vizsla shares over five years. It also entered a purchase agreement to buy the Santa Fe exploration concessions for a further US$1.43 million and 2.75 million common shares.
FAQs for silver investing
Is silver a good investment?
Silver comes with many of the same advantages as its sister metal gold. Both are considered safe-haven assets, as they can offer a hedge against market downturns, a weakening US dollar and inflation.
Additionally, many investors like being able to physically own an asset, and with its lower price point, buying silver coins and bars is an accessible option for building a precious metals portfolio. Of course, physical silver isn’t the only way to invest in the metal — there are also silver stocks and various silver exchange-traded funds.
It’s up to investors to do their due diligence and decide whether silver is the right match for their portfolio.
Does silver go up when the stock market goes down?
Historically, silver has shown some correlation with stock market moves, although it’s not consistent. When the stock market has seen its worst crashes, silver has moved down, but by a less significant amount than the stock market has, showing that it can act as a safety net to lessen losses in tough circumstances.
However, silver is also known for its volatility. What's more, because it has industrial applications as well as a currency side, silver is less tied to the stock market than gold is.
Don’t forget to follow us @INN_Resource for real-time news updates!
Securities Disclosure: I, Dean Belder, hold an investment in Vizsla Silver.
Keep reading...Show less
28 August
Cobre Limited: Unlocking Copper and Critical Minerals for a Low-carbon Future
Cobre (ASX:CBE) is advancing copper-silver exploration in Botswana’s Kalahari Copper Belt, one of the world’s most prospective yet underexplored sediment-hosted copper provinces. Holding a 5,348 sq km land position, its near-term focus is the Ngami Copper Project (NCP), where a maiden JORC resource at the Comet deposit establishes an initial copper-silver resource with strong in-situ copper recovery (ISCR) development potential.
Cobre’s growth strategy balances district-scale discovery with development-ready assets. Backed by up to AU$40 million (US$25 million) in BHP funding, the company is accelerating exploration at Kitlanya while directing its own capital toward advancing the Ngami Copper Project through technical, environmental and permitting milestones.
In parallel, Cobre maintains strategic exposure to high-purity quartz and volcanogenic massive sulphide (VMS) opportunities in Western Australia. This diversified, capital-light approach is designed to drive shareholder value through discovery, de-risking and development optionality.
Company Highlights
- Dominant land position – ~5,348 sq km across Botswana’s Kalahari Copper Belt (KCB), the second largest tenement package in the districtInvestor
- Maiden JORC Mineral Resource – Comet deposit (Ngami copper project): 11.5 Mt @ 0.52 percent copper and 11.6 grams per ton (g/t) silver (60.3 kt copper; 4.3 Moz silver), incl. 1.1 Mt indicated @ 0.59 percent copper and 12.8 g/t silver
- BHP partnership – Eight-year earn-in across Kitlanya East & West, allowing BHP to earn 75 percent by providing up to US$25 million for exploration expenditure, while Cobre retains exposure
- BHP Xplor cohort – Selected in 2024, securing US$500,000 non-dilutive funding and technical support
- Multi-jurisdiction exploration portfolio – Botswana (copper-silver), Western Australia (VMS, high-purity quartz)
This Cobre Limited profile is part of a paid investor education campaign.*
Click here to connect with Cobre Limited (ASX:CBE) to receive an Investor Presentation
Keep reading...Show less
28 August
Cobre Limited
Investor Insight
Cobre offers investors a rare combination of district-scale copper-silver discovery potential, near-term development upside through its ISCR-ready Ngami copper project, and a capital-light growth model underpinned by major-partner funding and diversified exposure to critical minerals.
Overview
Cobre (ASX:CBE) is an Australian exploration company unlocking the copper-silver potential of the Kalahari Copper Belt in Botswana, one of the world’s most prospective but underexplored sediment-hosted copper provinces. With approximately 5,348 sq km of land position, the company’s near-term focus is the Ngami copper project (NCP), where a maiden JORC resource at the Comet deposit establishes an initial copper-silver resource with strong in-situ copper recovery (ISCR) development credentials.
Cobre’s project location in the Kalahari Copper Belt
Cobre’s growth strategy balances district-scale discovery potential with development-ready assets, leveraging major-partner funding, including up to AU$40 million (US$25 million) investment from BHP to accelerate exploration at Kitlanya, while concentrating company capital on advancing NCP through technical, environmental and permitting milestones. The company complements its Botswana assets with strategic exposure to high-purity quartz and volcanogenic massive sulphide (VMS) opportunities in Western Australia. This diversified, capital-light approach aims to build shareholder value through discovery, derisking and development optionality.
Company Highlights
- Dominant land position – ~5,348 sq km across Botswana’s Kalahari Copper Belt (KCB), the second largest tenement package in the districtInvestor
- Maiden JORC Mineral Resource – Comet deposit (Ngami copper project): 11.5 Mt @ 0.52 percent copper and 11.6 grams per ton (g/t) silver (60.3 kt copper; 4.3 Moz silver), incl. 1.1 Mt indicated @ 0.59 percent copper and 12.8 g/t silver
- BHP partnership – Eight-year earn-in across Kitlanya East & West, allowing BHP to earn 75 percent by providing up to US$25 million for exploration expenditure, while Cobre retains exposure
- BHP Xplor cohort – Selected in 2024, securing US$500,000 non-dilutive funding and technical support
- Multi-jurisdiction exploration portfolio – Botswana (copper-silver), Western Australia (VMS, high-purity quartz)
Key Projects
Ngami Copper Project
The 100 percent owned Ngami copper project is Cobre’s flagship asset and the primary focus of current exploration and technical work. Situated in the Kalahari Copper Belt (KCB), NCP spans multiple licences covering highly prospective sediment-hosted copper-silver targets along basin margins.
Comet Deposit – Maiden JORC Resource
- Announced in August 2025, the Comet deposit hosts 11.5 Mt @ 0.52 percent copper and 11.6 g/t silver, including 1.1 Mt indicated @ 0.59 percent copper and 12.8 g/t silver, at a 0.2 percent copper cut-off.
- Contained metal: ~60,300 tonnes copper and 4.3 Moz silver.
- Mineralisation is predominantly fine-grained chalcocite, an ideal feedstock for hydrometallurgical processing.
In-Situ Copper Recovery Development Potential
ISCR is a low-cost, low-impact method of producing copper by circulating a solution through the orebody underground to dissolve and pump the metal to surface for processing. For Cobre’s Ngami project, ISCR offers the potential to unlock value without the expense and disruption of conventional mining, thanks to favourable geology, high recoveries in test work, and minimal surface disturbance – positioning it as a potentially faster, cleaner and more capital-efficient path to production.
Exploration Upside
Beyond the initial Comet resource, Ngami hosts extensive growth potential with 40 km of mineralised strike and large, defined exploration targets that could significantly expand the resource base. Early drilling at new zones, such as the Cosmos target, has intersected high-grade copper. More than 20 km of prospective contact remains untested, offering multiple opportunities for further discoveries that could enhance scale, mine life and project economics.
Kitlanya East & West
Cobre’s Kitlanya East and West licences, also located in Botswana, involve an eight-year earn-in agreement with BHP. Under the deal, BHP can invest up to US$25 million to earn a 75 percent interest in Kitlanya, allowing the company to leverage a major partner’s technical expertise and funding while retaining exposure to potential tier-one discoveries. Exploration is targeting preserved fold hinge settings along basin margins – geological positions known to host large sediment-hosted copper deposits – using advanced geophysics and seismic techniques to define high-priority drill targets.
Okavango Copper Project
Another Botswana copper asset, the Okavango project is located along strike from MMG’s Zone 5 deposit. Okavango offers 186 km of prospective contact in the northeast Kalahari Copper Belt. Early drilling has intersected multiple zones of anomalous copper and silver mineralisation, and geophysical data shows gravity signatures comparable to those in producing areas, indicating strong potential for significant new discoveries.
Perrinvale Project
In addition to its African portfolio, Cobre holds the Perrinvale project in Western Australia, prospective for both high-grade VMS mineralisation and high-purity quartz (HPQ). The HPQ target has an exploration range of 5.1 to 28.3 Mt grading 99.1 to 99.6 percent SiO₂, positioning it as a potential supplier to critical silicon markets for renewable energy and electronics.
Management Team
Martin Holland – Executive Chairman
Martin Holland is the founder of Cobre and co-founder of multiple ASX-listed companies, including Lithium Power International. He has more than 15 years’ experience in capital markets and resource company leadership, raising more than AU$200 million for exploration.
Adam Wooldridge – Chief Executive Officer
Founding partner and CEO of KML, Adam Woolridge has more than 28 years’ experience in exploration management and target generation in Africa, the Middle East and Europe.
Ross McGowan – Non-executive Director
CEO of Armada Metals and founder of RED Group, Ross McGowan has over 20 years of experience in African exploration, and was part of the Kamoa discovery team.
Michael McNeilly – Non-executive Director
Michael McNeilly, is a corporate financier and CEO of Strata Plc, with experience across multiple listed resource companies.
Michael Addison – Non-executive Director
Michael Addison is the founder of Endocoal, Carabella Resources and Genex Power, with extensive mining and energy development background.
Andrew Sissian – Non-executive Director
Andrew Sissian is co-founder of Cobre and Procon Telematics. He is a corporate and capital markets specialist with a CPA background.
Keep reading...Show less
25 August
Pan American Silver Gets Green Light for US$2.1 Billion MAG Silver Deal
Pan American Silver (TSX:PAAS,NYSE:PAAS) is set to close its US$2.1 billion acquisition of MAG Silver (TSX:MAG,NYSEAMERICAN:MAG) after receiving final clearance from Mexico’s Federal Economic Competition Commission, cementing one of the year’s largest transactions in the sector.
The approval clears the way for the all-cash-and-stock deal to be completed on or about September 4 of this year, the companies announced on Monday (August 25).
Under the terms of the arrangement, MAG shareholders will receive either US$20.54 in cash per share or the default consideration of US$0.0001 in cash plus 0.755 of a Pan American share for each MAG share held.
According to company filings, Pan American expects to issue about 60 million shares to MAG shareholders when the deal closes, leaving them with roughly 14 percent of the combined company on a fully diluted basis.
The transaction values MAG at about US$2.1 billion, a 21 percent premium to its closing price and a 27 percent premium to its 20 day volume-weighted average price on the NYSE American as of May 9, when the deal was announced.
For Pan American, one of the world’s largest primary silver producers, the prize is MAG’s 44 percent joint-venture stake in the Juanicipio mine in Mexico’s Fresnillo Silver Trend.
The large-scale underground operation is among the world’s highest-grade primary silver mines, producing 4.5 million ounces of silver in the first quarter of 2025 alone at an all-in sustaining cost of US$10.64 per ounce of silver equivalent. Annual output this year is forecast between 14.7 million and 16.7 million ounces.
“This strategic acquisition further solidifies Pan American as a leading Americas-focused silver producer,” said Michael Steinmann, Pan American’s president and CEO, in the May announcement. “Our acquisition of MAG brings into Pan American’s portfolio one of the best silver mines in the world. Juanicipio is a large-scale, high-grade, low-cost silver mine that will meaningfully increase Pan American’s exposure to high margin silver ounces.”
Steinmann added that the deal gives Pan American future growth opportunities through MAG’s exploration properties in Utah and Ontario.
Consolidation wave in silver
The tie-up between Pan American and MAG continues a consolidation trend sweeping the silver sector, with a stronger metal price and investor appetite for scale driving a string of deals.
Recent transactions include First Majestic Silver’s (TSX:FR,NYSE:AG) US$970 million takeover of Gatos Silver, Coeur Mining's (NYSE:CDE) US$1.7 billion acquisition of SilverCrest Metals and Endeavour Silver's (TSX:EDR,NYSE:EXK) US$145 million purchase of Compañia Minera Kolpa in Peru.
Pan American operates 10 mines across Canada, Mexico, Peru, Brazil, Bolivia, Chile and Argentina, and also owns the Escobal mine in Guatemala, currently on care and maintenance. For MAG, the deal marks the end of its run as an independent company, but gives its shareholders a stake in a significantly larger producer.
In addition to Juanicipio, MAG has been advancing the Deer Trail Project in Utah and the Larder Project in Ontario’s Abitibi region. Those properties will now shift under Pan American’s control.
Don’t forget to follow us @INN_Resource for real-time news updates!
Securities Disclosure: I, Giann Liguid, hold no direct investment interest in any company mentioned in this article.
Keep reading...Show less
Latest News
Latest Press Releases
Related News
TOP STOCKS
American Battery4.030.24
Aion Therapeutic0.10-0.01
Cybin Corp2.140.00