The Conversation (0)

Dynacor Group Inc. (TSX: DNG) (Dynacor or the Corporation) released its unaudited condensed interim consolidated financial statements and the management's discussion and analysis (MD&A) for the first quarter ended March 31, 2024.
This press release features multimedia. View the full release here: https://www.businesswire.com/news/home/20240516127576/en/
(Graphic: Business Wire)
These documents have been filed electronically with SEDAR+ at www.sedarplus.com and will be available on the Corporation's website www.dynacor.com .
(All figures in this press release are in Ms of US$ unless stated otherwise. All amounts per share are in US$. All variance % are calculated from rounded figures. Some additions might be incorrect due to rounding).
Q1-2024 OVERVIEW AND HIGHLIGHTS
OVERVIEW
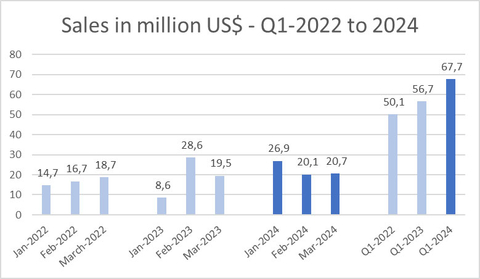
Dynacor completed the three-month period ended March 31, 2024 ("Q1-2024") with record quarterly sales of $67.7 million and a net income of $4.8 million (US$0.13 per share) compared to sales of $56.7 million and a net income of $4.5 million (US$0.11 per share) for the first quarter of 2023 ("Q1-2023").
In 2023, second half of January planned exports had been postponed to February explaining the high sales level in February and lower sales in January.
HIGHLIGHTS
Operational
Financial
Return to Shareholders
| (1) | Cash gross operating margin per AuEq ounce is in US$ and is calculated by subtracting the average cash cost of sale per equivalent ounces of Au from the average selling price per equivalent ounces of Au and is a non-IFRS financial performance measure with no standard definition under IFRS Accounting Standards. It is therefore possible that this measure could not be comparable with a similar measure of another company. | |
| (2) | EBITDA: "Earnings before interest, taxes and depreciation" is a non-IFRS financial performance measure with no standard definition under IFRS Accounting Standards. It is therefore possible that this measure could not be comparable with a similar measure of another corporation. The Corporation uses this non-IFRS measure as an indicator of the cash generated by the operations and allows investor to compare the profitability of the Corporation with others by canceling effects of different assets basis, effects due to different tax structures as well as the effects of different capital structures. | |
| (3) | Cash-flow per share is a non-IFRS financial performance measure with no standard definition under IFRS Accounting Standards. It is therefore possible that this measure could not be comparable with a similar measure of another corporation. The Corporation uses this non-IFRS measure which can also be helpful to investors as it provides a result which can be compared with the Corporation market share price. |
RESULTS FROM OPERATIONS
| Consolidated Statement of net income and comprehensive income | ||
|
| For the three-month periods | |
| (in $'000) (unaudited) | 2024 | 2023 |
|
|
|
|
| Sales | 67,733 | 56,733 |
| Cost of sales | (58,585) | (48,904) |
| Gross operating margin | 9,148 | 7,829 |
| General and administrative expenses | (1,704) | (1,553) |
| Other projects expenses | (214) | (224) |
| Operating income | 7,230 | 6,052 |
| Financial income net of expenses | 171 | 153 |
| Foreign exchange gain (loss) | (59) | 50 |
| Income before income taxes | 7,342 | 6,255 |
| Current income tax expense | (2,577) | (1,979) |
| Deferred income tax recovery | 16 | 191 |
| Net income and comprehensive income | 4,781 | 4,467 |
|
|
|
|
| Earnings per share |
|
|
| Basic | $0.13 | $0.11 |
| Diluted | $0.13 | $0.11 |
Total sales amounted to a record level of $67.7 million compared to $56.7 million in Q1-2023. The $11.0 million increase is explained by higher quantities sold ($4.5 million) and by higher average selling prices ($6.5 million).
The Q1-2024 gross operating margin increased by 16.7% and amounted to $9.1 million (13.5% of sales) compared to $7.8 million (13.8% of sales) in Q1-2023. The Q1-2024 gross operating margin was positively impacted by increases in gold market prices from March.
General and administrative expenses amounted to $1.7 million compared to $ 1.5 million in Q1-2023.
As budgeted, other projects represent the expenses incurred by the Corporation to duplicate its unique business model in other jurisdictions.
The Q1-2024 net income was also affected by the recording of a $2.6 million income tax expense compared to $1.8 million in Q1-2023. The increase as a percentage of the net income before taxes is mainly explained by the recording of withholding taxes on dividends received from a Peruvian subsidiary (none in Q1-2023) and by the effect on the current and deferred tax expense of the variance throughout the periods of the Peruvian Sol against the US$. Future fluctuations will affect positively or negatively the current and deferred tax at the end of each period.
| Reconciliation of non-IFRS measures | ||
| (in $'000) (unaudited) | For the three-months periods ended March 31, | |
|
| 2024 | 2023 |
| Reconciliation of net income and comprehensive income to EBITDA |
|
|
| Net income and comprehensive income | 4,781 | 4,467 |
| Income taxes expense (current and deferred) | 2,561 | 1,788 |
| Financial income net of expenses | (171) | (153) |
| Depreciation | 885 | 784 |
| EBITDA | 8,056 | 6,886 |
CONSOLIDATED CASH FLOW FROM OPERATING, INVESTING AND FINANCING ACTIVITIES AND WORKING CAPITAL AND LIQUIDITY
Operating activities
For the three-month period ended March 31, 2024, the cash flow from operations, before changes in working capital items, amounted to $5.6 million compared to $5.0 million for the three-month period ended March 31, 2023. Net cash from operating activities amounted to $9.6 million compared to $9.7 million for the three-month period ended March 31, 2023. Changes in working capital items amounted to $3.9 million compared to $4.7 million for the three-month period ended March 31, 2023.
Investing activities
During the three-month period ended March 31, 2024, the Corporation invested $0.7 million ($3.7 million for the three-month period ended March 31, 2023). This amount mainly includes investments at the plant and new vehicles. All investments have been financed with internally generated cash-flows.
Financing activities
In Q1-2024, monthly dividends totaling CA$0.035 per share were disbursed for a total consideration of $1.0 million (CA$ 1.3 million) compared to CA$0.030 per share for a total consideration of $0.9 million (CA$ 1.2 million) in Q1-2023.
In Q1-2024, 926,800 common shares were repurchased under the Corporation normal course issuer bid share buyback program for a total cash consideration of $2.7 million (CA$3.7 million) (29,080 shares for a total cash consideration of $0.1 million (CA$0.1 million) in Q1-2023).
In Q1-2024, the Corporation issued 62,925 common shares following the exercise of purchase options for a consideration of $0.1 million (CA$ 0.1 million).
Working capital and liquidity
As at March 31, 2024, the Corporation's working capital increased to $52.1 million, including $27.7 million in cash ($50.8 million, including $22.5 million in cash at December 31, 2023).
CONSOLIDATED STATEMENT OF FINANCIAL POSITION
As at March 31, 2024, total assets amounted to $111.5 million ($111.8 million as at December 31, 2023). Major variances since last year-end come from the increase in cash and variances in working capital items (mainly inventories and trade and other payables).
| (in $'000) (unaudited) |
| As at March 31, | As at December 31, |
|
|
| 2024 | 2023 |
| Cash |
| 27,675 | 22,481 |
| Accounts receivable |
| 12,013 | 13,328 |
| Inventories |
| 27,321 | 31,925 |
| Prepaid |
| 841 | 277 |
| Property, plant and equipment |
| 24,496 | 24,590 |
| Right-of-use assets |
| 591 | 613 |
| Exploration and evaluation assets |
| 18,570 | 18,566 |
| Total assets |
| 111,507 | 111,780 |
|
|
|
|
|
| Trade and other payables |
| 13,530 | 15,357 |
| Current tax liabilities |
| 2,230 | 1,799 |
| Asset retirement obligations |
| 3,746 | 3,724 |
| Deferred tax liabilities |
| 661 | 677 |
| Lease liabilities |
| 602 | 636 |
| Shareholders' equity |
| 90,738 | 89,587 |
| Total liabilities and equity |
| 111,507 | 111,780 |
OUTLOOK 2024
Ore processing
For 2024, the Corporation forecasted sales (1) ranging between $265-285 million representing a growth of 6-14% over 2023 sales. Net income is forecasted ranging between $12-15 million ($0.33-0.41 per share) (CA$0.45-0.56 per share) and include expenses of $2.7 million to advance other projects in other jurisdictions. So far in 2024, the Corporation is in line with its financial forecast.
| (1) | Using a market gold price ranging between $2,000 and $2,050 per ounce |
Capex
Dynacor Group plans to invest up to US$13 million in capital expenditures in 2024. This investment will be used at our Veta Dorada plant for new equipment to improve efficiency, increase tailing pond capacity, vehicles to support the security of our purchasers working in remote areas and will include, upon favourable conditions, up to $4 million to pursue the due diligence process and development of new projects in other jurisdictions.
ABOUT DYNACOR
Dynacor is a dividend-paying industrial gold ore processor headquartered in Montreal, Canada. The corporation is engaged in gold production through the processing of ore purchased from the ASM (artisanal and small-scale mining) industry. At present, Dynacor operates in Peru, where its management and processing teams have decades of experience working with ASM miners. It also owns a gold exploration property (Tumipampa) in the Apurimac department.
The corporation intends to expand its processing operations in other jurisdictions as well.
Dynacor produces environmental and socially responsible gold through its PX IMPACT® gold program. A growing number of supportive firms from the fine luxury jewelry, watchmakers and investment sectors pay a small premium to our customer and strategic partner for this PX IMPACT® gold. The premium provides direct investment to develop health and education projects for our artisanal and small-scale miner's communities.
Dynacor is listed on the Toronto Stock Exchange (DNG).
FORWARD-LOOKING INFORMATION
Certain statements in the preceding may constitute forward-looking statements, which involve known and unknown risks, uncertainties and other factors that may cause the actual results, performance, or achievements of Dynacor, or industry results, to be materially different from any future result, performance or achievement expressed or implied by such forward-looking statements. These statements reflect management's current expectations regarding future events and operating performance as of the date of this news release.
Shares Outstanding: 36,568,356
Website: http://www.dynacor.com
Twitter: http://twitter.com/DynacorGold
View source version on businesswire.com: https://www.businesswire.com/news/home/20240516127576/en/
For more information, please contact:
Director, Shareholder Relations
Dale Nejmeldeen
Dynacor Group Inc.
T: 514-393-9000 #230
E: investors@dynacor.com
News Provided by Business Wire via QuoteMedia