
First Helium Inc. ("First Helium" or the "Company") (TSXV: HELI) (OTCQB: FHELF) (FRA: 2MC) today announced two discoveries at its Worsley Project:
Shallow Heavy Oil Discovery
Australian market analyst firm Vested Equities has estimated a 194 percent upside over the current share price of oil producer and explorer Jupiter Energy (ASX:JPR), citing the company’s large reserve and plans for sustainable growth.
“Jupiter Energy's resilient financial performance, strategic positioning, and significant reserves potential make it an attractive prospect for investors seeking exposure to the energy sector,” wrote Vested analyst Stuart McClure in a June 2024 report.
Jupiter Energy is an oil exploration and production company operating in Kazakhstan, with three licenced oil fields producing approximately 640 barrels per day from four wells, with plans to increase to approximately 1,000 barrels per day by the end of 2024.
The Vested report also cited Kazakhstan's supportive regulatory environment with policies and programs aimed at strengthening its energy sector, by facilitating the increase of production capacity, attracting new investments and supporting industry growth.
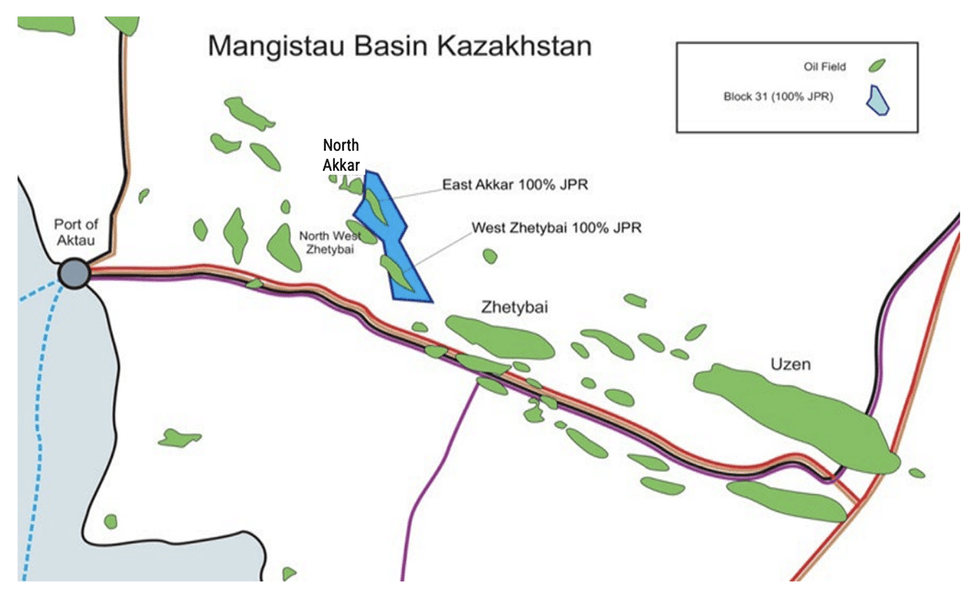
Location of Jupiter Energy's license areainvestingnews.com
“Jupiter Energy’s operations benefit from these favourable policies, the most recent being the support offered to the company by the Kazakh Ministry of Energy in addressing its gas utilisation requirements. These initiatives have provided access to essential resources and infrastructure, enhancing the company’s operational stability and capacity for growth,” the report said.
For the full analyst report, click here.
This content is intended only for persons who reside or access the website in jurisdictions with securities and other applicable laws which permit the distribution and consumption of this content and whose local law recognizes the scope and effect of this Disclaimer, its limitation of liability, and the legal effect of its exclusive jurisdiction and governing law provisions [link to Governing Law section of the Disclaimer page].
Any investment information contained on this website, including third party research reports, are provided strictly for informational purposes, are general in nature and not tailored for the specific needs of any person, and are not a solicitation or recommendation to purchase or sell a security or intended to provide investment advice. Readers are cautioned to seek the advice of a registered investment advisor regarding the appropriateness of investing in any securities or investment strategies mentioned on this website.
Jupiter Energy’s cash-flow positive standing, substantial proven recoverable reserves and long-term strategic positioning in resource-rich Kazakhstan, make a compelling investment value proposition. Its commitment to sustainable operations, backed by its recent strategic investment in developing its 100 percent gas utilisation infrastructure, adds to the company’s investor appeal.
Jupiter Energy (ASX:JPR) is an established oil exploration and production company that operates three oilfields in Kazakhstan. The company has been producing approximately 600 to 700 barrels of oil per day from its licensed fields and has successfully navigated Kazakhstan’s regulatory and operational landscape since 2008. Its operations are fully compliant, with its three commercial production licenses secured until 2045/46/49. Jupiter Energy’s reserve base has been independently confirmed by a Sproule International competent person’s report (CPR), effective 31 December 2023, detailing significant recoverable reserves.
Jupiter Energy has a reputation as a reliable operator in the region. The company holds 100 percent ownership of its licenses, which cover a total area of approximately 123 sq km in the oil-rich Mangistau region. The license area is close to the port city of Aktau and strategically located in an area with established oil processing facilities and substantial oil and gas infrastructure, including pipelines to the country’s major oil refineries.
Jupiter has successfully transitioned its oilfields through the various regulatory phases required to reach full commercial production. Its three oilfields – Akkar East, Akkar North (East Block) and West Zhetybai – all operate under their respective 25-year full commercial licences. The company’s established compliance and operational framework underline its commitment to long-term sustainable production in Kazakhstan.
According to the Sproule International CPR, released in January 2024, Jupiter Energy’s recoverable reserves under the SPE/PRMS classification are as follows:
These figures confirm Jupiter’s substantial reserve base, with its Kazakh State Approved Reserves recorded at approximately 52 mmbbls (GOST C1 + C2 classification).
The company is also building the necessary pipelines to enable its current and future production wells to be connected into its larger neighbour’s existing gas utilisation infrastructure. This development will allow for the processing and utilisation of associated gas generated during oil production, not only complying with Kazakhstan’s legislation that is focussed on carbon-free operations but also benefiting the local community and contributing to Kazakhstan’s objective of reaching carbon neutrality over the coming decades. This project has seen close collaboration between Jupiter Energy, its larger oil producing neighbour and the Kazakh Ministry of Energy, thereby strengthening its relations with the Kazakh government and its people.
At the helm of Jupiter Energy is a highly experienced corporate and technical leadership team, driving the company towards achieving its goals and increasing shareholder value.
Block 31 is Jupiter Energy’s flagship project located in the Mangistau Basin of West Kazakhstan. Covering an area of approximately 123 sq km, it lies in a highly prospective region with proven oil reserves. The company acquired extensive 3D seismic data over the entire block and surrounding areas, totaling 235 sq km, which then enabled the identification of multiple drilling targets.
Jupiter has since drilled nine wells on Block 31, targeting the Akkar North (East Block), Akkar East, and West Zhetybai oilfields. The current production from Block 31 is approximately 640 barrels of oil per day, with plans to increase output to around 1,000 barrels per day with the drilling of a new well, with the spud data of this well expected in late November 2024. Further increases in production will come via the workovers of existing wells and the drilling of further new wells, planned from 2025 to 2030.
Block 31's strategic significance is bolstered by its newly constructed gas utilization infrastructure, which will allow for the processing and management of associated gas produced during oil production, ensuring this gas is 100 percent utilised by the company, its larger oil producing neighbour and/or by local communities. Kazakhstan has imposed stringent regulations against gas flaring, the practice of burning gas by-products that are generated during oil production. This means that 100 percent gas utilisation is a mandatory requirement for oil producers with full commercial licences in Kazakhstan.
Jupiter’s gas utilisation infrastructure, currently under construction, is expected to be approved for operation in November 2024. This will enable its oilfields to connect to a larger neighbouring producer’s existing gas utilisation facility, which will in turn process and manage the oilfields’ gas by-product. The strategic investment in gas utilisation infrastructure strengthens Jupiter’s relations with the local community and signifies its commitment to sustainable production and helping Kazakhstan reach carbon neutrality in the coming decades.
Geoff Gander graduated from the University of Western Australia in 1984, where he completed a Bachelor of Commerce degree. He has been involved in the listing and running of public companies since 1994. He was appointed as a director of Jupiter Energy in January 2005 and he is currently responsible for the overall operational leadership of the company, as well as investor relations and group corporate development.
Baltabek Kuandykov is currently the president of Meridian Petroleum, a privately held Kazakh oil & gas company. He was formerly the president of Nelson Resources, an oil development and production company operating in Kazakhstan which was listed on the Toronto Stock Exchange until its acquisition by Lukoil in 2005. Kuandykov has considerable experience in the oil and gas industry in the region, having served as president of Kazakhoil (predecessor of the Kazakh State oil company KazMunaiGas), and is a well-respected consultant to Chevron Overseas Petroleum on CIS projects. He also worked in a senior capacity for Kazneftegazrazvedka and was president of Kazakhstancaspishelf. Kuandykov has extensive government experience in Kazakhstan, having served as deputy minister of geology, head of the oil and gas directorate at the Ministry of Geology, and was deputy minister of energy and fuel resources.
Alexey Kruzhkov holds an engineering degree and an MBA with over 10 years’ experience working in the investment industry, focusing primarily on the oil & gas, mining and real estate sectors. He has served as a director on the boards of companies listed in Canada and Norway. He is a member of the executive team of Waterford Finance and Investment Limited. He holds British and Russian citizenships.
Alexander Kuzev is an oil industry professional with over 26 years of experience. Most of his career has been spent working in the Former Soviet Union with much of that time responsible for the overall management of field operations with a focus on production sustainability, technology and field maintenance. He brings an important technical advisory skill set to the Jupiter Energy board, as well as in-country experience, having been involved with various Kazakhstan-based oil and gas operations since the late 1990s.
Keith Martens has over 40 years’ experience as an oil finder and manager around the world. He has served as a technical advisor and consultant to a number of Australian oil & gas companies, and was instrumental in the discovery of Jupiter’s Akkar East and West Zhetybai oil fields when he was consulting to Jupiter Energy between 2007 and 2014. More recently, Martens has been working on the Eastern Margin of the Permian Basin in Texas with Winchester Energy and in the Paradox Basin in Utah and Colorado, as both lead explorationist and non-executive chairman of ASX listed Grand Gulf Energy (ASX:GGE).
Sustainable, long-term and profitable oil exploration and production in Kazakhstan
Oil and gas are key energy fuels, and ASX-listed Australian oil and gas companies could benefit from their price moves.
For the most part, 2024 was a volatile year for both the oil and gas markets. In the first half of the year, oil prices were riding an uptrend, spurred on by rising tensions in the Middle East amid tightening supply.
However, after prices peaked at US$91.70 per barrel in early April, demand-side challenges weighed oil down, with levels sinking to US$77 in early June. In the second half of the year, oil prices took a hit as global economic uncertainties continued to grow.
By September 10, oil fell to a year-to-date low of US$69.09 as investors anticipated interest rate cuts in the US and the Israel-Hamas war continued to threaten supply chains. Weakness in demand from China also suppressed oil prices. By late December, prices were holding in the US$72.40 range and climbed higher into early January.
As of late March, prices were back to about US$73.50.
Meanwhile, natural gas prices experienced a sharp six month decline starting in November 2023. The fall came on the back of a shift in mature markets, including the Asia Pacific region, Europe and North America, which are experiencing reductions in gas demand as they seek alternatives like renewables and pursue improved energy efficiency.
In mid-2024, natural gas prices surged to US$3.12 per million British thermal units based on increased demand during above-normal temperatures, but they pulled back in the third quarter to below US$2. However, seasonal demand amidst colder weather pushed natural gas prices up in the fourth quarter to flirt with the US$4 level in late December, and they climbed even higher in Q1 2025 to reach a two-year high of US$4.49 in mid-March.
The oil and gas outlook for 2025 is for both these commodities to continue facing market volatility as geopolitical and global economic uncertainties persist. And, of course, Donald Trump's presidency in the US will likely throw the market a few curveballs. Nevertheless, analysts remain confident in the resiliency of this sector.
For investors looking to enter the oil and gas sector, what's the best way to get exposure on the ASX? Learning about the biggest ASX oil and gas companies by market cap is a good place to start. Data for the ASX oil stocks list below was obtained on March 20, 2025, using TradingView’s stock screener. All market cap and share price data was accurate at that time.
Market cap: AU$43.32 billion
Share price: AU$22.94
As the biggest ASX-listed oil and gas stock by market cap, Woodside Energy Group leads the country in natural gas production and is considered a pioneer in Australia’s liquefied natural gas (LNG) industry.
In June 2022, Woodside Petroleum merged with BHP's (ASX:BHP,NYSE:BHP,LSE:BHP) oil and gas business to form Woodside Energy Group. The new company's natural gas production accounts for 5 percent of global LNG supply.
The company reported in June 2024 that it had achieved first production at the Sangomar project in Senegal, the country's first offshore oil project. Its standalone floating production storage and offloading facility has a nameplate capacity of 100,000 barrels per day. Woodside continued ramping up production throughout the year, reporting record output levels by the third quarter.
In December 2024 Woodside agreed to an asset swap with Chevron's (NYSE:CVX) indirect subsidiary Chevron Australia that is expected to close in 2026, "subject to the completion of Julimar Phase 3 Project execution and handover."
Under the agreement, Woodside would acquire Chevron Australia's interest in several projects in Western Australia in which Woodside already holds interest, namely the North West Shelf project, the North West Shelf oil project and the Angel carbon capture and storage project. These would bring Woodside's interests to 50 percent, 66.7 percent and 40 percent respectively. Chevron Australia will also pay Woodside up to US$400 million reliant on certain milestones.
In exchange, Chevron would receive Woodside's 13 percent non-operating interest in the Wheatstone project and 65 percent operating interest in the Julimar-Brunello project.
With Sangomar in production, Woodside achieved a net profit after tax of US$3.57 billion for 2024, up 115 percent over the previous year.
Market cap: AU$20.61 billion
Share price: AU$6.46
Australian energy company Santos is the operator of multiple joint ventures with significant LNG production, including the Papua New Guineau LNG project and the Gladstone LNG project in Queensland, Australia. The company supplies its products to markets located across Australia and Asia.
In May 2024, the company secured a binding 10 year LNG supply and purchase agreement with Japan's Hokkaido Gas Co. (TSE:9534) for approximately 400,000 tonnes of LNG per year starting in 2027. The company ended the year with the signing of a long-term LNG supply contract with Japanese utility company Shizouka Gas.
Along with its joint venture partners ExxonMobil (NYSE:XOM), Kumul Petroleum Holdings, Mineral Resources Development Company and JX Nippon, Santos brought the Angore LNG project, part of Papua New Guineau LNG, into production in November 2024.
In its report for 2024, Santos highlighted strong free cashflow of US$1.9 billion and sales revenue of US$5.4 billion for the year.
In March 2025, Santos shared news of a new oil discovery on Alaska’s North Slope from the Sockeye-2 exploration well in which the company holds a 25 per cent stake through a joint venture.
Market cap: AU$3.29 billion
Share price: AU$1.435
Oil and gas exploration and production company Beach Energy has a diverse portfolio, with onshore and offshore oil and gas production in five basins across Australia and New Zealand.
In 2023, the company made gas discoveries at both Tarantula Deep 1 and Trigg Northwest 1 as part of its ongoing Perth Basin gas exploration campaign. During its 2024 fiscal year, Beach Energy posted AU$1.8 billion in sales revenue, up 9 percent year-on-year. The increase came despite a 7 percent decrease in production to 18.2 million barrels of oil; according to the firm, the decline was mainly due to lower customer gas nominations.
For its H1 2025 fiscal year results, Beach Energy reported that sales revenues of AU$990 million, up 5 percent over the same period in the previous year. Production for the half year was up 15 percent to 10.2 million barrels of oil.
Looking ahead, Beach Energy is targeting Q4 of the calendar year 2025 for first gas sales at its Waitsia gas plant, which is currently in the commissioning phase.
Market cap: AU$2.79 billion
Share price: AU$1.785
Viva Energy Australia owns the Geelong oil refinery and distributes Shell (NYSE:SHEL,LSE:SHEL) fuels throughout Australia. The firm oversees a vast network of over 1,300 Shell and Liberty service stations nationwide.
In its fiscal year 2024 financials, Viva Energy highlighted that its commercial and industrial segment delivered a fourth consecutive year of earnings growth, with an earnings before interest, taxes, depreciation and amortization (EBITDA) up 5 percent to AU$469.9 million. The company attributed the growth to strong demand from the aviation, resource, agriculture and defence sectors.
The company’s energy and infrastructure segment reported an EBITDA of AU$94.3 million in its fiscal year 2024, up 44 percent on lower levels of maintenance and improved operating performance.
Market cap: AU$1.21 billion
Share price: AU$1.63
Karoon Energy is focused on continued company growth through a broad pipeline of exploration and development projects in Brazil, including its producing Baúna and Piracaba oil fields.
In December 2023, Karoon completed its acquisition of interests in the US Gulf of Mexico from LLOG, including a 30 percent working interest in the Who Dat and Dome Patrol oil and gas fields and associated infrastructure, as well as a nearly 16 percent working interest in the Abilene field and varying interests in adjacent exploration acreage.
In its full year 2024 report, Karoon outlined record production volume on a net revenue interest (NRI) basis of 10.4 million barrels of oil equivalent, up 14 percent over the previous year. Sales revenue for the period was also up 14 percent, totalling US$776.5 million.
In February 2025, Karoon announced the sale and purchase agreement for the acquisition of the Baúna Cidade de Itajaí floating production, storage and offloading facility in Brazil for US$115 million. The goal of the purchase is to return to reliable production from its Baúna project.
Crude oil is a mixture of hydrocarbons in liquid form that is found in natural underground reservoirs in the Earth's crust. This petroleum liquid is refined to produce a variety of energy and industrial products, including asphalt, diesel and jet fuels, gasoline, heating oils, lubricants and propane.
Geoscience Australia states that Australia hosts about 0.3 percent of global oil reserves.
“Most of Australia's known remaining oil resources are condensate and liquefied petroleum gas associated with giant offshore gas fields in the Browse, Carnarvon and Bonaparte basins,” according to the government agency.
In addition to producing it domestically, Australia receives oil imports from Singapore, South Korea, China, Malaysia and India, because Australia’s domestic oil production does not cover its oil consumption.
Don't forget to follow us @INN_Australia for real-time updates!
Securities Disclosure: I, Melissa Pistilli, hold no direct investment interest in any company mentioned in this article.
Hydrogen stocks are benefiting from cleantech sector momentum as the world moves closer to a green energy future.
The most abundant element on Earth, hydrogen is a colorless gas. It can be produced in liquid form and burned to generate electricity, or combined with oxygen atoms in fuel cells. In this way, hydrogen — which produces no carbon emissions — can replace fossil fuels in household heating, transportation and industrial processes such as steel manufacturing.
Rising demand for carbon-free energy sources alongside significant new government policies are driving growth in the hydrogen market. Grand View Research projects that the global hydrogen-generation market will grow at a compound annual growth rate of 9.3 percent from 2024 to 2030, reaching US$317.39 billion by the end of the forecast period.
It's worth noting that the downside to hydrogen as a clean energy source is that 99 percent of the hydrogen fuel currently in production is derived from power generated by coal or gas. To combat this problem, some companies are pursuing green hydrogen, which is produced by splitting hydrogen atoms from oxygen using electrolyzers powered by renewable energy.
Below the Investing News Network profiles the biggest hydrogen companies by market cap on US, Canadian and Australian stock exchanges. Data was gathered on March 13, 2025, using TradingView’s stock screener.
The hydrogen stocks on this list are focused on a diverse range of sectors in the hydrogen space, including: low-carbon hydrogen gas production, green hydrogen technology and production, hydrogen fuel cell companies, and hydrogen distribution and storage.
The US hydrogen market is well established, accounting for “more than half the world’s fuel cell vehicles, 25,000 fuel cell material handling vehicles, more than 8,000 small scale fuel systems in 40 states, and more than 550 MW of large-scale fuel cell power installed or planned,” according to the Fuel Cell and Hydrogen Energy Association.
The US was also the top exporter of hydrogen in 2023 with US$2.15 billion in exports based on data from the Observatory of Economic Complexity (OEC).
Looking at the medium to long term, the use of hydrogen as a fuel source is expected to grow. While the strong government incentives enacted under former US President Joe Biden's Inflation Reduction Act, such as a production tax credit, may be on the ropes under the Trump Administration, there is still optimism among industry leaders.
Market cap: US$213.49 billion
Share price: US$453.26
Leading global industrial gases and engineering company Linde has been producing hydrogen for more than a century and is a pioneer in new hydrogen production technologies. Linde’s operations cover each step of the hydrogen value chain, from production and processing through distribution and storage. The company also uses its gases for industrial and consumer applications.
Globally, the company has more than 500 hydrogen production plants. Through its ITM Linde Electrolysis joint venture, Linde has become one of the world’s leading suppliers of green hydrogen produced using proton exchange membrane (PEM) electrolyzer technologies. This also makes it one of the few green hydrogen stocks.
In August 2024, Linde signed a US$2 billion long-term supply agreement to supply clean hydrogen to Dow (NYSE:DOW) subsidiary Dow Canada's Path2Zero project in Fort Saskatchewan, Alberta.
In response to the regulatory uncertainties under the Trump Administration, Linde announced in its Q4 2024 earnings call that 90 percent of its US clean hydrogen projects will be focused on blue hydrogen, which is created by reforming natural gas with carbon capture storage. Blue hydrogen is more cost effective to produce, and although it is not zero emission like green hydrogen, it is more environmentally friendly than grey hydrogen produced with coal.
Market cap: US$65.32 billion
Share price: US$292.85
Founded in 1940, Air Products & Chemicals sells industrial gases and chemicals and provides related equipment and expertise to a wide range of industries, including the refining, chemical, metals, electronics, manufacturing, and food and beverage segments.
In addition to producing oxygen, nitrogen, argon and helium, the company operates more than 100 hydrogen plants and maintains the world’s largest hydrogen distribution network. Air Products has an extensive hydrogen-dispensing technology patent portfolio and has been involved in more than 250 hydrogen-fueling projects worldwide.
Air Products also has a joint venture project now under construction with ACWA Power (SR:2082) and NEOM Company in Saudi Arabia. Called the NEOM Green Hydrogen Complex, the operation will be powered by 4 gigawatts of renewable power from solar and wind to produce 600 metric tons per day of carbon-free hydrogen, which it says will be delivered in the form of green ammonia. Once production begins at the complex in 2026, Air Products will be the sole off-taker and plans to deliver the green ammonia to Europe's transport sector.
Air Products' Louisiana Clean Energy Complex, its largest US investment, is also making headway, with first production expected in 2028. The complex will produce blue hydrogen for power mobility and industrial markets in the Gulf Coast region and other markets.
Market cap: US$43.71 billion
Share price: US$312.92
Indianapolis-based Cummins designs, manufactures and distributes engines, filtration and power-generation products with a specialization in diesel and alternative fuel engines and generators.
In March 2023, the company announced the launch of a new brand, Accelera, which features “a diverse portfolio of zero-emissions solutions, includ(ing) battery systems, fuel cells, ePowertrain systems and electrolyzers.” The brand encompasses Cummins' established battery electric and hydrogen fuel cell systems, as well as electrolyzers for hydrogen refueling stations. Shortly after, Accelera began production at its first US electrolyzer facility, located in the state of Minnesota.
The hydrogen fuel cell company showcased its next generation B6.7H hydrogen engine at the April 2024 Intermat Sustainable Construction Solutions and Technology Exhibition in Paris. The following month heralded the launch of Accelera's next-gen hydrogen fuel cell technology for commercial vehicles, specifically the FCE300 and FCE150 fuel cell engines.
Accelera inked a deal in February 2025 to supply a 100 megawatt PEM electrolyzer system for BP's (NYSE:BP,LSE:BP) Lingen green hydrogen project in Germany. The system is Accelera's largest to date and uses its HyLYZER PEM electrolyzer technology.
Like its neighbor to the south, Canada is a world leader in hydrogen and fuel cell technologies, especially when it comes to innovation, research and development. The country reportedly generates C$200 million in hydrogen technology exports according to data from January 2023. In terms of the global hydrogen market, the country exported $385 million worth of hydrogen in 2023, ranking ninth overall according to the OEC.
The federal government is heavily invested in the sector both in terms of funding and the implementation of clean energy policies. “The Hydrogen Strategy for Canada laid out a framework that focuses low-carbon hydrogen as a tool to achieve our goal of net-zero emissions by 2050, while creating jobs, growing our economy, expanding exports and protecting our environment," Natural Resources Canada states.
In British Columbia, the Government of Canada invested C$9.4 billion to launch a new Clean Hydrogen Hub that will use electrolyzer technology and hydroelectricity to generate hydrogen that can be sold to industry users.
On the global stage, Canada and its trading partner Germany have agreed to each commit C$300 million for a total of C$600 million to launch Atlantic Canada's hydrogen export industry, which will send hydrogen to Germany. However, delays due to factors including high hydrogen prices and inflation as well as lack of infrastructure have pushed the expected start of exports back from 2025.
Market cap: C$526.98 million
Share price: C$1.82
Ballard Power Systems is a global leader in hydrogen fuel cell technology and is working to accelerate the adoption of this technology. The company develops and manufactures PEM fuel cell products that create electrical energy from the combination of hydrogen and air. Ballard's products are designed for heavy-duty trucks, buses, trains and marine applications, as well as backup power storage.
Two of Ballard’s 200 kilowatt fuel cell modules are located on the world’s first hydrogen-powered ferry, operated by Norwegian company Norled. The company is also supplying hydrogen fuel cell modules to global carbon-reduction company First Mode; they will be used to power several hybrid hydrogen and battery ultra-class mining haul trucks.
In January 2024, Ballard secured a supply contract for a minimum of 100 of its FCmove-HD+ modules to NFI Group to be used in the latter's New Flyer next generation Xcelsior CHARGE FC hydrogen fuel cell buses, which will be deployed across the US and Canada. The company also announced in April 2024 that it had secured its largest order ever — 1,000 hydrogen fuel cell engines to be supplied to European bus manufacturer Solaris.
Ballard signed a multi-year supply agreement with an Egypt-based company named Manufacturing Commercial Vehicles, in which Ballard will supply 50 FCmove-HD+ fuel cell engines to support projects in the European Union with deliveries expected between 2025 and 2026.
Market cap: C$91.5 million
Share price: C$5.07
Headquartered in Vancouver, British Columbia, Westport Fuel Systems supplies advanced alternative fuel delivery components and systems to the transportation industry worldwide. This includes its high pressure direct injection (HPDI) fuel system for commercial vehicles, which can run on biogas, natural gas, hydrogen and other alternative fuel products.
The company has operations in partnership with leading global transportation brands across more than 70 countries across Europe, Asia, North America and South America.
One of those partners is Swedish automaker Volvo Group (STO:VOLV-B). The two firms are working together to commercialize Westport’s HPDI fuel system technology for long-haul and off-road applications that will use renewable fuels now and hydrogen in the future.
Westport is also working with a leading global provider locomotive original equipment manufacturer on a two-year proof of concept project to adapt its hydrogen HPDI fuel system for use with the company's engine design. The project is fully funded by the locomotive company.
Market cap: C$90.25 million
Share price: C$2.32
Tidewater Renewables produces renewable diesel and hydrogen at its facilities located near Prince George in BC, Canada. The plant has a nameplate capacity of 3,000 barrels per day of renewable diesel and 23.7 metric tons per day of hydrogen. It began production during Q4 2023 using feedstock that included soybean and canola oil.
Tidewater is now focused on expanding operations at the site to produce sustainable aviation fuel, targeting 2028 for first production.
Australia is another important hotspot for investing in hydrogen. The Australian Government says that "over AU$200 billion is currently in the investment pipeline for hydrogen and derivatives," accounting for 20 percent of announced renewable hydrogen projects worldwide.
The Australian government’s National Hydrogen Strategy, which it updated in 2023, highlights its intention to position the country as a “major player” in the global hydrogen market by 2030. To this end, Australia has partnered with a number of other nations on hydrogen technology.
Australia and Germany are working together on a hydrogen technology development program that will help Australia build out its capacity to export hydrogen to Germany as it seeks to reduce its reliance on fossil fuels. Through a partnership with Japan, Australia is developing new hydrogen fuel cell technology and looking to establish the world's first clean liquefied hydrogen export pilot project, and its government has invested more than AU$500 million in the development of regional hydrogen hubs across the country.
In May 2024, the Australian government announced an AU$22.7 billion package to bolster the country's domestic manufacturing and renewable energy sector, including AU$6.7 billion for renewable hydrogen production starting in mid-year 2028 through the 2039/2040 fiscal year.
Market cap: AU$70.29 million
Share price: AU$0.45
Gold Hydrogen is an exploration and development company with a focus on making new hydrogen and helium discoveries in South Australia using recorded government data with modern exploration techniques.
During initial drill work conducted at its Ramsey project in 2023, Gold Hydrogen reconfirmed the historical figures for hydrogen while demonstrating new purity levels of up to 86 percent. Additionally, strong levels of up to 17.5 percent purity helium were found.
In August 2024, Gold Hydrogen reported high concentrations of hydrogen and helium at surface. Using new seismic information, the company has identified sites for its first wells, which it intends to drill beginning in 2025. “To have an initial world first to see Hydrogen and Helium to surface is very exciting for our further ongoing exploration and drilling programs in even better locations,” Gold Hydrogen Managing Director Neil McDonald stated.
Gold Hydrogen announced in February 2025 that it had received a AU$6.45 million research and development tax refund associated with its natural hydrogen and helium exploration activities for the fiscal year ended June 30, 2024. The refund will help fund the company's 2025 work to delineate the hydrogen and helium accumulation at Ramsey.
Market cap: AU$67.93 million
Share price: AU$0.30
Technology development company Hazer Group is working to commercialize the HAZER Process, a low-emission hydrogen and graphite production process initially developed at the University of Western Australia. It uses iron ore as a process catalyst to convert natural gas and similar feedstocks into hydrogen for use as an industrial chemical and in fuel cells, as well as into high-quality synthetic graphite for use in lithium-ion batteries.
Hazer started operations at its commercial demonstration plant in early 2024 and it is now producing hydrogen and graphitic carbon.
In May 2024, the company inked an agreement with Canadian utility FortisBC for the development of a hydrogen production facility in British Columbia that will use Hazer’s proprietary technology. The proposed commercial production facility will have a design capacity of up to 2,500 metric tons per year of clean hydrogen and approximately 9,500 metric tons per year of Hazer graphite.
The company announced in March 2025 that it had successfully completing its commercial reactor test program, validating a commercial scale-up reactor design. "The equipment was designed to mimic key aspects of the Hazer Process for producing hydrogen and graphite at commercial scale, and the completion of this testing is a major milestone for the government support from CleanBC," the press release states.
Market cap: AU$25.77 million
Share price: AU$0.08
Pure Hydrogen is focused on becoming a leading producer and supplier of hydrogen and hydrogen-fuel-cell-powered vehicles such as buses and waste collection vehicles. The company has several partnerships with companies for its technology. Pure Hydrogen’s hydrogen-fuel-cell-powered Prime Mover truck was displayed at the Brisbane Truck Show last year.
Pure Hydrogen has a 40 percent stake in the Turquoise Group, an Australian clean energy company, as well as exclusive long-term acquisition rights for the company's future hydrogen production. Turquoise Group announced in May 2024 that it had produced the first graphene powder and hydrogen during testing at its commercial demonstration plant in Brisbane, Queensland. In August 2024, Pure Hydrogen registered Australia's first hydrogen-powered semi-truck, the Hydrogen Fuel Cell 110kW 6x4 Prime Mover.
Pure Hydrogen's majority-owned subsidiary HDrive confirmed in January 2025 that it had sold two Taurus 70 metric ton hydrogen fuel cell prime movers to Australian logistics services provider TOLL Transport as part of a broader AU$2 million package. The vehicles are slated for delivery in the fourth quarter of the calendar year.
According to research from TWI Global, there are pros and cons to both electric vehicles (EVs) and hydrogen vehicles. In terms of range and charging time, hydrogen beats electric hands down. However, while a hydrogen-powered vehicle doesn’t need much time to refuel compared to an EV, there is still much more EV charging infrastructure currently available compared to hydrogen fueling stations. EVs are also cheaper to purchase than hydrogen vehicles. As far as safety and emissions are concerned, it's a draw between the two.
Elon Musk’s SpaceX has used hydrogen to fuel its rockets, and in 2023 Musk talked about hydrogen playing an important role in industrial applications, such as steelmaking. However, he has balked at the idea of hydrogen fueling vehicles, calling fuel cells “fool sells.” Speaking at a Financial Times conference in May 2022, Musk said, “It’s important to understand that if you want a means of energy storage, hydrogen is a bad choice.”
Starting in 2024, rumors began spreading that Tesla (NASDAQ:TSLA) was planning to launch a Tesla Model H powered by hydrogen, but they have been proven false.
Toyota (NYSE:TM,TSE:7203) first invested in hydrogen fuel cell technology in 1992 as its executives saw clean energy as the future of transport. However, with EVs dominating the clean car space, the automaker began to shift its focus to compete with its peers. Toyota brought its newest hydrogen-powered vehicle to market in the fall of 2023 — a revamped Crown sedan that also has a hybrid-electric version. The following year, the auto maker introduced the first prototype of its Toyota Hilux trucks with a hydrogen fuel cell powertrain.
In 2025, Toyota shared its long-term strategy for developing hydrogen passenger vehicles as well as hydrogen technologies for long-haul freight.
Some countries leading in green and blue hydrogen production are the US, Germany and Canada. Many countries around the world have released clean hydrogen strategies, including the US, Canada and many countries in the Europe Union. However, clean hydrogen production is still in the early phases as countries develop infrastructure.
Don't forget to follow us @INN_Resource for real-time news updates!
Securities Disclosure: I, Melissa Pistilli, hold no direct investment interest in any company mentioned in this article.
Quebec Innovative Materials Corp. (CSE: QIMC) (OTCQB: QIMCF) (FSE: 7FJ) ("QIMC") is pleased to announce a major expansion of its natural clean renewable hydrogen exploration activities with the establishment of a new exploration camp in the Cumberland Basin, Nova Scotia, QIMC has staked 2,645 exploration claims. This strategic initiative significantly expands QIMC's natural clean renewable hydrogen and helium exploration portfolio into Canada's Atlantic region, positioning the company to access international hydrogen export markets via existing Atlantic port infrastructure.
John Karagiannidis CEO of QIMC stated: "Our expansion into Nova Scotia marks a transformative step forward, building upon our unparalleled exploration success in Quebec. By harnessing the favorable geological features of the Cumberland Basin and utilizing our proven exploration methodologies, we are poised to unlock substantial new natural clean hydrogen and helium resources, fueling a cleaner energy future and creating significant value for shareholders."
Covering approximately 428.49 km² with 2,645 exploration claims, the Cumberland project strategically targets geological structures conducive for their natural hydrogen and helium potential. Characterized by a thick sedimentary sequence exceeding 7 kilometers, deep-seated faults, and prominent geothermal gradients, the Cumberland Basin offers optimal conditions for hydrogen generation, accumulation, and potential storage.
Leveraging the exceptional exploration model developed at QIMC's St-Bruno-de-Guigues property in Quebec, where groundbreaking exploration has yielded outstanding natural renewable hydrogen results, QIMC intends to replicate its proven approach in the geologically favorable Cumberland Basin area. Nova Scotia's geological environment, marked by significant structural similarities to renowned global hydrogen-rich regions such as the Lorraine Basin in France, offers an ideal opportunity for transformative discoveries.
Specifically, the Cobequid-Chedabucto fault system, an extensive and deep-reaching geological structure, provides pathways for natural hydrogen production through water-mineral interactions involving biotite-rich granitoids and olivine-bearing mafic rocks. Recent scientific modeling in analogous geological environments, such as France's Rhine graben, demonstrates substantial hydrogen generation from biotite-rich granites, confirming the significant hydrogen potential awaiting discovery in Nova Scotia.
In addition, Nova Scotia's geological setting provides robust potential for helium co-production and hydrogen storage, particularly due to abundant salt diapirs within the Windsor Formation. This integrated exploration strategy strengthens QIMC's leading role in natural hydrogen exploration and positions it prominently as the North American leader in natural renewable hydrogen.
Prof. Marc Richer-Laflèche explains: "Nova Scotia frequently hosts biotite-rich potassic granitoids, notably within Neoproterozoic geological complexes such as the Frog Lake pluton (Murphy et al., 2001), as well as within several significant Carboniferous plutons including the North River and Hanna Farm plutons in the Cobequid Highlands (Pe-Piper, 1991). Additionally, lamprophyric intrusions, which are notably abundant throughout the region, also exhibit high biotite concentrations. Within our exploration model for natural hydrogen in Nova Scotia, biotite plays a pivotal role. Analogous to the process involving olivine in mafic and ultramafic rocks, biotite in these granitoids is known to readily react with groundwater, facilitating substantial hydrogen generation under appropriate geothermal conditions. This reaction underscores the strategic geological significance of Nova Scotia's biotite-rich granitoids for natural hydrogen exploration and potential production. This process has been demonstrated and modelled in the Rhine graben (Alsace, France) where, for moderate temperatures of around 130-200oC, biotite produces good quantities of hydrogen (e.g. 102 KT of H2 per km3 of granite: Murray et al., 2020). Given the favorable geothermal gradient in Cumberland, these temperatures could easily be reached, enabling hydrogen production by oxidation of the Fe2+ contained in biotite."
Cumberland sector:
The geological context of Nova Scotia includes lithological, structural and geophysical features conducive to the formation of hydrogen or helium. The Cumberland Basin area (Fig. 1), in particular, is a convergence zone bringing together several critical elements conducive to the formation and accumulation of natural hydrogen in a context showing certain similarities with the geological context of the hydrogen discovery in the Lorraine region of France. This area is characterized by the presence of the Cobequid Highlands.
Figure 1: Location map of the Cumberland project in Nova Scotia and other hydrogen exploration properties of QIMC and its partners. Figure modified from Google Map.
To view an enhanced version of this graphic, please visit:
https://images.newsfilecorp.com/files/7968/245342_35ce51fa04ebf928_001full.jpg
The sedimentary geology of the Cumberland area, adjacent to the Cobequid Highlands, is characterized at surface by the presence of Late Carboniferous geological units of the Cumberland Group (Ragged Reef Fm, Polly Brook Fm) and stratigraphically underlying rocks of the Windsor and Mabou Groups. Rock units in the basin include continental detrital sedimentary rocks, coal formations (e.g. Springhill) and evaporites (Windsor Group). These rocks are underlain by older bedrock rich in Neoproterozoic potassic granitoids, mafic volcanics and intrusives, diorites and Carboniferous potassic granites (Pe-Piper et al., 1989; Pe-Piper and Piper, 2002). These rocks are cut by local or regional faults. The Cobequid-Chedaducto fault zone, south of the Cobequid Highlands, cuts across much of Nova Scotia and separates the Avalon terrain to the north and the Meguma terrain to the south (Fig. 2). The latter are components of the Northern Appalachians. This structural zone is thought to be the upper part of a larger structure known as the Minas Geofracture. This geological structure, reactivated several times in the Paleozoic, is thought to have been involved, among other things, in the emplacement of basaltic magmas that support the hypothesis of the presence of a transcrustal fault that could reach the peridotitic lithospheric mantle. This mafic magmatism, associated with the effusion of 1,500 m of volcanic rocks (continental tholeiites) (Dessureau et al., 2000), is of great importance for the production of natural renewable hydrogen through the interaction of groundwater and minerals such as olivine, pyroxenes and magnetite.
Figure 2: Simplified geological map of Nova Scotia's Carboniferous and Triassic sedimentary basins. Source: NSDNR, 2006.
To view an enhanced version of this graphic, please visit:
https://images.newsfilecorp.com/files/7968/245342_35ce51fa04ebf928_002full.jpg
The presence of an imposing succession of sedimentary rocks (over 7 km) in the Cumberland Basin is a favorable feature for natural hydrogen exploration, given the presence of porous, permeable rocks interbedded with impermeable rocks such as shales and evaporites (salt formations of the Windsor Fm). The formation of anticlinal structures by the rise of salt diapirs is, among other things, conducive to the formation of hydrogen and helium gas deposits. The presence of salt formations offers the potential for gas storage in the Cumberland Basin.
With its thick succession of sedimentary rocks and relatively high geothermal gradient, the Cumberland Basin is also recognized for its geothermal potential (Comeau et al., 2020). In a context of hydrogen production, through reactions between groundwater and minerals such as olivine, magnetite and biotite, the presence of relatively warm water, at realistic depths, is one of the characteristics sought for natural hydrogen production. The presence of a granitic basement rich in K, Th and U is also conducive to the production of radiolytic hydrogen and crustal radiogenic helium.
References :
Comeau et al., 2020. Assessment of geothermal resources in onshore Nova Scotia. Offshore Energy Research Association (OERA). Open File Report ME 2021-003, 216 pages.
Dessureau, G., Piper, D.J.W., and Pe-Piper, G., 2000. Geochemical evolution of earliest Carboniferous continental tholeiitic basalts along a crustal-scale shear zone, southwestern Maritimes basin, eastern Canada. Lithos, Volume 50, Issues 1-3, Pages 27-50.
Murray, J., Clément, A., Fritz, B., Schmittbuhl, J., Bordmann, V., Fleury, J.M., 2020. Abiotic hydrogen generation from biotite-rich granite: A case study of the Soultz-sous-Forêts geothermal site, France. Applied Geochemistry.
Murphy, G.B., Pe-Piper, G., Piper, D.J.W, Nance, R.D. and Doig, R., 2001. Geology of the Eastern Cobequid Highlands, Nova-Scotia. Geological Survey of Canada, Bulletin 556, 62 pages. NSDNR, 2006. Geological map of the province of Nova Scotia, Scale 1:500 000, Compiled by J. D. Keppie, 2000. Digital Version of Nova Scotia Department of Natural Resources Map ME 2000-1. DP ME 43, Version 2.
Pe-Piper, G., 1991. Granite and associated mafic phases, North River pluton, Cobequid Highlands, Nova Scotia. Atlantic Geology, 27, 15-28.
Pe-Piper, G., Murphy, J.B. and Turner, D.S., 1989. Petrology, geochemistry, and tectonic setting of some Carboniferous plutons of the eastern Cobequid Hills. Atlantic Geology, 25, 37-49.
Pe-Piper, G. and Piper, D. J.W., 2002. A synopsis of the geology of the Cobequid Highlands, Nova Scotia. Atlantic Geology, 38, 145-160.
White, C. E., Archibald, D. B. MacHattie, T. G and Escarraga, E. A. 2011. Preliminary Geology of the Southern Antigonish Highlands, Northern Mainland Nova Scotiain Mineral Resources Branch, Report of Activities 2010; Nova Scotia Department of Natural Resources, Report ME 2011-1, p. 145-164.
M. Richer-LaFlèche is the Qualified Person responsible for the technical information contained in this news release and has read the information contained herein. He is a professional geologist registered with the Ordre des géologues du Québec and is the Qualified Person responsible for the technical information contained in this news release and has read the information contained herein and approves the press release.
For more information about Quebec Innovative Materials Corp. and its products, please visit www.qimaterials.com.
About Québec Innovative Materials Corp.
Québec Innovative Materials Corp. is a mineral exploration and development company dedicated to exploring and harnessing the potential of Canada's abundant resources. With properties in Ontario and Québec, QIMC is focused on specializing in the exploration of white (natural) hydrogen and high-grade silica deposits. QIMC is committed to sustainable practices and innovation. With a focus on environmental stewardship and cutting-edge extraction technology, we aim to unlock the full potential of these materials to drive forward clean energy solutions to power the AI and carbon-neutral economy and contribute to a more sustainable future.
QUÉBEC INNOVATIVE MATERIALS CORP.
John Karagiannidis
Chief Executive Officer
For further information, please contact:
Email: info@qimaterials.com
Tel: +1 514-726-7058
Neither the Canadian Securities Exchange nor its Regulation Services Provider (as that term is defined in the CSE policies) accepts responsibility for the adequacy or accuracy of this news release and has neither approved nor disapproved the contents of this news release.
Forward-Looking Statements
This news release contains statements that constitute "forward-looking statements". Such forward-looking statements involve known and unknown risks, uncertainties and other factors that may cause Québec Innovative Materials' actual results, performance or achievements, or developments in the industry to differ materially from the anticipated results, performance or achievements expressed or implied by such forward-looking statements. Forward-looking statements are statements that are not historical facts and are generally, but not always, identified by the words "expects," "plans," "anticipates," "believes," "intends," "estimates," "projects," "potential" and similar expressions, or that events or conditions "will," "would," "may," "could" or "should" occur.
Although Québec Innovative Materials believes the forward-looking information contained in this news release is reasonable based on information available on the date hereof, by their nature, forward-looking statements involve assumptions, known and unknown risks, uncertainties and other factors which may cause our actual results, performance or achievements, or other future events, to be materially different from any future results, performance or achievements expressed or implied by such forward-looking statements.
Examples of such assumptions, risks and uncertainties include, without limitation, assumptions, risks and uncertainties associated with general economic conditions in Canada and abroad; adverse industry events; future legislative and regulatory developments in the natural resources sector, in particular as regards the regulation of white (natural) hydrogen exploration, development and exploitation; the Company's ability to access sufficient capital from internal and external sources, and/or inability to access sufficient capital on favorable terms; natural resources industry and markets in Canada and generally; the ability of Québec Innovative Materials to implement its business strategies; competition; and other assumptions, risks and uncertainties.
The forward-looking information contained in this news release represents the expectations of the Company as of the date of this news release and, accordingly, is subject to change after such date. Readers should not place undue importance on forward-looking information and should not rely upon this information as of any other date. While the Company may elect to, it does not undertake to update this information at any particular time except as required in accordance with applicable laws.
Cautionary Statements This news release contains "forward-looking information" and "forward-looking statements" within the meaning of applicable Canadian securities legislation. These statements are based on expectations, estimates, and projections as of the date of this release. Forward-looking statements involve risks and uncertainties, which may cause actual results to differ materially from current expectations. Readers are cautioned not to place undue reliance on these statements, as no assurance can be provided regarding future outcomes.
First Helium Inc. ("First Helium" or the "Company") (TSXV: HELI) (OTCQB: FHELF) (FRA: 2MC) today announced two discoveries at its Worsley Project:
Shallow Heavy Oil Discovery
Helium Enriched Natural Gas Play
"Our recent drilling program has validated what we've long understood about the multi-zone potential of our Worsley property," said Ed Bereznicki, President & CEO of First Helium. "While our primary oil target in the Leduc formation did not test as commercially viable, our secondary target for heavy oil has exceeded our expectations for inflow of cold flow heavy oil from a vertical well bore. We are very excited to proceed with the development of this potentially large, shallow heavy oil play utilizing contemporary horizontal drilling methods. Our initial economic analyses indicate attractive rate of return estimates for a large, lower risk development play," added Mr. Bereznicki.
"In addition to the heavy oil play, we are pleased to confirm the extension of our Blue Ridge helium enriched natural gas play to the eastern block of First Helium's land base. This has the potential to significantly increase the size of this regional play at Worsley, making it attractive to potential partners for large scale development", concluded Mr. Bereznicki.
The Company provides additional details on these two development opportunities:
Shallow Heavy Oil Opportunity
The Heavy Oil Zone has been recognized by the Company in numerous existing wellbores across the Worsley land base, representing the potential for a large, attractive, lower-risk oil development opportunity utilizing contemporary horizontal drilling technology. Based on the Company's evaluation, including results of the 7-15 and 7-30 wells, potential project highlights would include:
Blue Ridge Opportunity
The Company has confirmed the extension of the Blue Ridge Formation from West Worsley to the eastern portion of its property through recent drilling. Highlights include:
Leduc Formation Targets Update
The Company's recent drilling program also continues to advance its Leduc Formation targets:
"Our multi-formation approach at Worsley represents a balanced portfolio of opportunities," noted Mr. Bereznicki. "The combination of higher-impact Leduc targets along with more systematic development opportunities in the Heavy Oil Zone and Blue Ridge Formation provides both near-term potential and longer-term, scalable growth across our extensive land base."
The Company will be providing more detail regarding its development plans for each opportunity over the course of the next quarter.
ABOUT First Helium
Led by a core Senior Executive Team with diverse and extensive backgrounds in Oil & Gas Exploration and Operations, Mining, Finance, and Capital Markets, First Helium seeks to be one of the leading independent providers of helium gas in North America.
First Helium holds over 53,000 acres along the highly prospective Worsley Trend in Northern Alberta which has been the core of its exploration and development drilling activities to date.
Building on its successful 15-25 helium discovery well, and 1-30 and 4-29 oil wells at the Worsley project, the Company has identified numerous follow-up drill locations and acquired an expansive infrastructure system to facilitate future exploration and development across its Worsley land base. Cash flow from its successful oil wells at Worsley has helped support First Helium's ongoing exploration and development growth strategy. Further potential oil drilling locations have also been identified on the Company's Worsley land base.
For more information about the Company, please visit www.firsthelium.com .
ON BEHALF OF THE BOARD OF DIRECTORS
Edward J. Bereznicki
President, CEO and Director
CONTACT INFORMATION
First Helium Inc.
Investor Relations
Email: ir@firsthelium.com
Phone: 1-833-HELIUM1 (1-833-435-4861)
Neither TSX Venture Exchange nor its Regulation Services Provider (as that term is defined in policies of the TSX Venture Exchange) accepts responsibility for the adequacy or accuracy of this release.
FORWARD LOOKING STATEMENTS
This press release contains forward looking statements within the meaning of applicable securities laws. The use of any of the words "anticipate", "plan", "continue", "expect", "estimate", "objective", "may", "will", "project", "should", "predict", "potential" and similar expressions are intended to identify forward looking statements. In particular, this press release contains forward looking statements concerning the completion of future planned activities. Although the Company believes that the expectations and assumptions on which the forward-looking statements are based are reasonable, undue reliance should not be placed on the forward-looking statements because the Company cannot give any assurance that they will prove correct. Since forward looking statements address future events and conditions, they involve inherent assumptions, risks and uncertainties. Actual results could differ materially from those currently anticipated due to a number of assumptions, factors and risks. These assumptions and risks include, but are not limited to, assumptions and risks associated with the state of the equity financing markets and regulatory approval.
Management has provided the above summary of risks and assumptions related to forward looking statements in this press release in order to provide readers with a more comprehensive perspective on the Company's future operations. The Company's actual results, performance or achievement could differ materially from those expressed in, or implied by, these forward-looking statements and, accordingly, no assurance can be given that any of the events anticipated by the forward-looking statements will transpire or occur, or if any of them do so, what benefits the Company will derive from them. These forward-looking statements are made as of the date of this press release, and, other than as required by applicable securities laws, the Company disclaims any intent or obligation to update publicly any forward-looking statements, whether as a result of new information, future events or results or otherwise.
SOURCE: First Helium Inc.
News Provided by GlobeNewswire via QuoteMedia
Alvopetro Energy Ltd. (TSXV: ALV) (OTCQX: ALVOF) announces an operational update, our financial results for the year ended December 31, 2024 a quarterly dividend of US$0.10 per common share and filing of our annual information form. We will be hosting a live webcast to discuss our Q4 2024 results on Wednesday March 19, 2025 at 8:00 a.m. Mountain time .
All references herein to $ refer to United States dollars, unless otherwise stated and all tabular amounts are in thousands of United States dollars, except as otherwise noted.
President & CEO, Corey C. Ruttan commented:
"Through 2024 we increased our productive capacity both at the Caburé Unit and on our 100% interest Murucututu project. This allowed us to increase our firm natural gas sales volumes for 2025 resulting in a strong start to the year with a 37% increase in our sales volumes. We are increasing our base dividend to US$0.10 per share, consistent with our long-standing commitment to a more disciplined capital allocation model, balancing returns to stakeholders and organic growth."
Operational Update
As announced on December 17, 2024 , our updated long-term gas sales agreement came into effect on January 1, 2025 increasing Alvopetro's contracted firm reference volumes by 33%. As a result, Alvopetro's daily sales in January and February increased 37% from Q4 2024 sales to an average of 2,375 boepd, including 13.4 MMcfpd of natural gas, natural gas liquids sales from condensate of 129 bopd and oil sales of 10 bopd. Effective February 1, 2025 , our natural gas price under our long-term gas sales agreement with Bahiagás has been adjusted to BRL1.95 /m 3 , a 7% increase from the January 2025 price of BRL1.83 /m 3 and consistent with the Q4 2024 price of BRL1.94 /m 3 . All natural gas sales from February 1, 2025 to April 30, 2025 will be sold at BRL1.95 /m 3 ( $10.55 /Mcf, net of applicable sales taxes, based on average heat content to date and the January 31, 2025 BRL/USD exchange rate of 5.83).
On February 5, 2025 , we announced the terms of a farmin agreement in Canada , pursuant to which Alvopetro agreed to fund 100% of two earning wells in exchange for a 50% non-operated working interest in 12,243 acres (6,122 net acres) of land in Western Saskatchewan . The first two earning wells have now been drilled and are being completed and equipped. Both wells are expected to be on production within the next 30 days. Alvopetro's estimated total costs for the two earning wells is expected to be approximately C$4.0 million ( $2.8 million ). After these initial two earning wells Alvopetro's working interest will be 50%.
On the Company's Murucututu natural gas field, we spud the first of two development wells planned for 2025 in February. Drilling is underway. On the unitized area (the "Unit") which includes the Caburé natural gas field, Alvopetro has five development wells planned for 2025, with the first well expected to be drilled in April.
On February 26, 2025 , we announced our December 31, 2024 reserves based on the independent reserve assessment and evaluation prepared by GLJ Ltd. ("GLJ") dated February 26, 2025 with an effective date of December 31, 2024 (the "GLJ Reserves and Resources Report"). Highlights include:
Financial and Operating Highlights – Fourth Quarter of 2024
Financial and Operating Highlights – Year Ended December 31, 2024
(1) Refer to the sections entitled " Oil and Natural Gas Advisories – Other Metrics " and " Non-GAAP and Other Financial Measures ". |
The following table provides a summary of Alvopetro's financial and operating results for the periods noted. The consolidated financial statements with the Management's Discussion and Analysis ("MD&A") are available on our website at www.alvopetro.com and will be available on the SEDAR+ website at www.sedarplus.ca .
As at and Three Months Ended December 31 | As at and Year Ended December 31, | ||||||
2024 | 2023 | Change (%) | 2024 | 2023 | Change (%) | ||
Financial | |||||||
($000s, except where noted) | |||||||
Natural gas, oil and condensate sales | 10,214 | 15,300 | (33) | 45,517 | 59,687 | (24) | |
Net income | 2,243 | 652 | 244 | 16,295 | 28,525 | (43) | |
Per share – basic ($) (1) | 0.06 | 0.02 | 200 | 0.44 | 0.77 | (43) | |
Per share – diluted ($) (1) | 0.06 | 0.02 | 200 | 0.43 | 0.76 | (43) | |
Cash flows from operating activities | 7,114 | 7,904 | (10) | 34,901 | 47,702 | (27) | |
Per share – basic ($) (1) | 0.19 | 0.21 | (10) | 0.94 | 1.29 | (27) | |
Per share – diluted ($) (1) | 0.19 | 0.21 | (10) | 0.93 | 1.26 | (26) | |
Funds flow from operations (2) | 6,966 | 12,393 | (44) | 33,275 | 48,030 | (31) | |
Per share – basic ($) (1) | 0.19 | 0.33 | (42) | 0.89 | 1.29 | (31) | |
Per share – diluted ($) (1) | 0.19 | 0.33 | (42) | 0.89 | 1.27 | (30) | |
Dividends declared | 3,283 | 5,127 | (36) | 13,170 | 20,462 | (36) | |
Per share (1) (2) | 0.09 | 0.14 | (36) | 0.36 | 0.56 | (36) | |
Capital expenditures | 4,682 | 4,934 | (5) | 15,305 | 27,449 | (44) | |
Cash and cash equivalents | 21,697 | 18,326 | 18 | 21,697 | 18,326 | 18 | |
Net working capital (2) | 13,181 | 13,117 | - | 13,181 | 13,117 | - | |
Weighted average shares outstanding | |||||||
Basic (000s) (1) | 37,315 | 37,262 | - | 37,289 | 37,121 | - | |
Diluted (000s) (1) | 37,566 | 37,963 | (1) | 37,558 | 37,770 | (1) | |
Operations | |||||||
Average daily sales volumes: | |||||||
Natural gas (Mcfpd), by field: | |||||||
Caburé (Mcfpd) | 7,476 | 11,699 | (36) | 9,228 | 11,742 | (21) | |
Murucututu (Mcfpd) | 2,231 | 546 | 309 | 928 | 487 | 91 | |
Total natural gas (Mcfpd) | 9,707 | 12,245 | (21) | 10,156 | 12,229 | (17) | |
NGLs – condensate (bopd) | 109 | 92 | 18 | 90 | 99 | (9) | |
Oil (bopd) | 11 | 10 | 10 | 12 | 6 | 100 | |
Total (boepd) | 1,738 | 2,143 | (19) | 1,794 | 2,142 | (16) | |
Average realized prices (2) : | |||||||
Natural gas ($/Mcf) | 10.51 | 12.85 | (18) | 11.42 | 12.64 | (10) | |
NGLs – condensate ($/bbl) | 75.95 | 89.45 | (15) | 84.84 | 86.29 | (2) | |
Oil ($/bbl) | 61.74 | 73.67 | (16) | 66.94 | 71.22 | (6) | |
Total ($/boe) | 63.88 | 77.60 | (18) | 69.31 | 76.33 | (9) | |
Operating netback ($/boe) (2) | |||||||
Realized sales price | 63.88 | 77.60 | (18) | 69.31 | 76.33 | (9) | |
Royalties | (2.15) | (2.07) | 4 | (1.99) | (2.13) | (7) | |
Production expenses | (6.64) | (5.84) | 14 | (6.33) | (5.38) | 18 | |
Operating netback | 55.09 | 69.69 | (21) | 60.99 | 68.82 | (11) | |
Operating netback margin (2) | 86 % | 90 % | (4) | 88 % | 90 % | (2) | |
Notes: | |
(1) | Per share amounts are based on weighted average shares outstanding other than dividends per share, which is based on the number of common shares outstanding at each dividend record date. The weighted average number of diluted common shares outstanding in the computation of funds flow from operations and cash flows from operating activities per share is the same as for net income per share. |
(2) | See "Non-GAAP and Other Financial Measures" section within this news release. |
Quarterly Dividend of US$0.10 per Share
With our updated gas sales agreement in effect as of January 1, 2025 and higher production levels forecasted in the first quarter of 2025 our Board of Directors determined it was appropriate to increase the declared quarterly dividend to US$0.10 per common share, payable in cash on April 15, 2025, to shareholders of record at the close of business on March 31, 2025. This dividend is designated as an "eligible dividend" for Canadian income tax purposes.
Dividend payments to non-residents of Canada will be subject to withholding taxes at the Canadian statutory rate of 25%. Shareholders may be entitled to a reduced withholding tax rate under a tax treaty between their country of residence and Canada. For further information, see Alvopetro's website at https://alvopetro.com/Dividends-Non-resident-Shareholders .
Annual Information Form
Alvopetro has filed its annual information form ("AIF") with the Canadian securities regulators on SEDAR+. The AIF
includes the disclosure and reports relating to oil and gas reserves data and other oil and gas information required
pursuant to National Instrument 51-101 of the Canadian Securities Administrators. The AIF may be accessed
electronically at www.sedarplus.ca and on our website at www.alvopetro.com .
2024 Results Webcast
Alvopetro will host a live webcast to discuss our 2024 financial results at 8:00 am Mountain time on Wednesday March 19, 2025. Details for joining the event are as follows:
DATE: March 19, 2025
TIME : 8:00 AM Mountain/ 10:00 AM Eastern
LINK: https://us06web.zoom.us/j/84540021301
DIAL-IN NUMBERS: https://us06web.zoom.us/u/kBRCh4fgE
WEBINAR ID : 845 4002 1301
The webcast will include a question-and-answer period. Online participants will be able to ask questions through the Zoom portal. Dial-in participants can email questions directly to socialmedia@alvopetro.com .
Corporate Presentation
Alvopetro's updated corporate presentation is available on our website at:
http://www.alvopetro.com/corporate-presentation .
Social Media
Follow Alvopetro on our social media channels at the following links:
Twitter - https://twitter.com/AlvopetroEnergy
Instagram - https://www.instagram.com/alvopetro/
LinkedIn - https://www.linkedin.com/company/alvopetro-energy-ltd
Alvopetro Energy Ltd. is deploying a balanced capital allocation model where we seek to reinvest roughly half our cash flows into organic growth opportunities and return the other half to stakeholders. Alvopetro's organic growth strategy is to focus on the best combinations of geologic prospectivity and fiscal regime. Alvopetro is balancing capital investment opportunities in Canada and Brazil where we are building off the strength of our Caburé and Murucututu natural gas fields and the related strategic midstream infrastructure.
Neither the TSX Venture Exchange nor its Regulation Services Provider (as that term is defined in the policies of the TSX Venture Exchange) accepts responsibility for the adequacy or accuracy of this news release.
Abbreviations:
$000s | = | thousands of U.S. dollars |
1P | = | proved reserves |
2P | = | proved plus probable reserves |
boepd | = | barrels of oil equivalent ("boe") per day |
bopd | = | barrels of oil and/or natural gas liquids (condensate) per day |
BRL | = | Brazilian Real |
Mcf | = | thousand cubic feet |
Mcfpd | = | thousand cubic feet per day |
MMcf | = | million cubic feet |
MMcfpd | = | million cubic feet per day |
NGLs | = | natural gas liquids (condensate) |
NPV10 | = | net present value before tax, discounted at 10% |
Q3 2024 | = | three months ended September 30, 2024 |
Q4 2023 | = | three months ended December 31, 2023 |
Q4 2024 | = | three months ended December 31, 2024 |
USD | = | United States dollars |
GAAP or IFRS | = | IFRS Accounting Standards |
Non-GAAP and Other Financial Measures
This news release contains references to various non-GAAP financial measures, non-GAAP ratios, capital management measures and supplementary financial measures as such terms are defined in National Instrument 52-112 Non-GAAP and Other Financial Measures Disclosure . Such measures are not recognized measures under GAAP and do not have a standardized meaning prescribed by IFRS and might not be comparable to similar financial measures disclosed by other issuers. While these measures may be common in the oil and gas industry, the Company's use of these terms may not be comparable to similarly defined measures presented by other companies. The non-GAAP and other financial measures referred to in this report should not be considered an alternative to, or more meaningful than measures prescribed by IFRS and they are not meant to enhance the Company's reported financial performance or position. These are complementary measures that are used by management in assessing the Company's financial performance, efficiency and liquidity and they may be used by investors or other users of this document for the same purpose. Below is a description of the non-GAAP financial measures, non-GAAP ratios, capital management measures and supplementary financial measures used in this news release. For more information with respect to financial measures which have not been defined by GAAP, including reconciliations to the closest comparable GAAP measure, see the " Non-GAAP Measures and Other Financial Measures " section of the Company's MD&A which may be accessed through the SEDAR+ website at www.sedarplus.ca .
Non-GAAP Financial Measures
Operating netback
Operating netback is calculated as natural gas, oil and condensate revenues less royalties and production expenses. This calculation is provided in the " Operating Netback " section of the Company's MD&A using our IFRS measures. The Company's MD&A may be accessed through the SEDAR+ website at www.sedarplus.ca . Operating netback is a common metric used in the oil and gas industry used to demonstrate profitability from operations.
Non-GAAP Financial Ratios
Operating netback per boe
Operating netback is calculated on a per unit basis, which is per barrel of oil equivalent ("boe"). It is a common non-GAAP measure used in the oil and gas industry and management believes this measurement assists in evaluating the operating performance of the Company. It is a measure of the economic quality of the Company's producing assets and is useful for evaluating variable costs as it provides a reliable measure regardless of fluctuations in production. Alvopetro calculated operating netback per boe as operating netback divided by total sales volumes (boe). This calculation is provided in the " Operating Netback " section of the Company's MD&A using our IFRS measures. The Company's MD&A may be accessed through the SEDAR+ website at www.sedarplus.ca . Operating netback is a common metric used in the oil and gas industry used to demonstrate profitability from operations on a per boe basis.
Operating netback margin
Operating netback margin is calculated as operating netback per boe divided by the realized sales price per boe. Operating netback margin is a measure of the profitability per boe relative to natural gas, oil and condensate sales revenues per boe and is calculated as follows:
Three Months Ended December 31, | Year Ended December 31, | |||
2024 | 2023 | 2024 | 2023 | |
Operating netback - $ per boe | 55.09 | 69.69 | 60.99 | 68.82 |
Average realized price - $ per boe | 63.88 | 77.60 | 69.31 | 76.33 |
Operating netback margin | 86 % | 90 % | 88 % | 90 % |
Funds Flow from Operations Per Share
Funds flow from operations per share is a non-GAAP ratio that includes all cash generated from operating activities and is calculated before changes in non-cash working capital, divided by the weighted average shares outstanding for the respective period. For the periods reported in this news release the cash flows from operating activities per share and funds flow from operations per share is as follows:
Three Months Ended December 31, | Year Ended December 31, | |||
$ per share | 2024 | 2023 | 2024 | 2023 |
Per basic share: | ||||
Cash flows from operating activities | 0.19 | 0.21 | 0.94 | 1.29 |
Funds flow from operations | 0.19 | 0.33 | 0.89 | 1.29 |
Per diluted share: | ||||
Cash flows from operating activities | 0.19 | 0.21 | 0.93 | 1.26 |
Funds flow from operations | 0.19 | 0.33 | 0.89 | 1.27 |
Capital Management Measures
Funds Flow from Operations
Funds flow from operations is a non-GAAP capital management measure that includes all cash generated from operating activities and is calculated before changes in non-cash working capital. The most comparable GAAP measure to funds flow from operations is cash flows from operating activities. Management considers funds flow from operations important as it helps evaluate financial performance and demonstrates the Company's ability to generate sufficient cash to fund future growth opportunities. Funds flow from operations should not be considered an alternative to, or more meaningful than, cash flows from operating activities however management finds that the impact of working capital items on the cash flows reduces the comparability of the metric from period to period. A reconciliation of funds flow from operations to cash flows from operating activities is as follows:
Three Months Ended December 31, | Year Ended December 31, | |||
2024 | 2023 | 2024 | 2023 | |
Cash flows from operating activities | 7,114 | 7,904 | 34,901 | 47,702 |
Changes in non-cash working capital | (148) | 4,489 | (1,626) | 328 |
Funds flow from operations | 6,966 | 12,393 | 33,275 | 48,030 |
Net Working Capital
Net working capital is computed as current assets less current liabilities. Net working capital is a measure of liquidity, is used to evaluate financial resources, and is calculated as follows:
As at December 31 | |||
2024 | 2023 | ||
Total current assets | 26,984 | 25,995 | |
Total current liabilities | (13,803) | (12,878) | |
Net working capital | 13,181 | 13,117 |
Supplementary Financial Measures
" Average realized natural gas price - $/Mcf " is comprised of natural gas sales as determined in accordance with IFRS, divided by the Company's natural gas sales volumes.
" Average realized NGL – condensate price - $/bbl " is comprised of condensate sales as determined in accordance with IFRS, divided by the Company's NGL sales volumes from condensate.
" Average realized oil price - $/bbl " is comprised of oil sales as determined in accordance with IFRS, divided by the Company's oil sales volumes.
" Average realized price - $/boe " is comprised of natural gas, condensate and oil sales as determined in accordance with IFRS, divided by the Company's total natural gas, NGL and oil sales volumes (barrels of oil equivalent).
" Dividends per share " is comprised of dividends declared, as determined in accordance with IFRS, divided by the number of shares outstanding at the dividend record date.
" Royalties per boe " is comprised of royalties, as determined in accordance with IFRS, divided by the total natural gas, NGL and oil sales volumes (barrels of oil equivalent).
" Production expenses per boe " is comprised of production expenses, as determined in accordance with IFRS, divided by the total natural gas, NGL and oil sales volumes (barrels of oil equivalent).
Oil and Natural Gas Advisories
Oil and Natural Gas Reserves
The disclosure in this news release summarizes certain information contained in the GLJ Reserves and Resources Report but represents only a portion of the disclosure required under National Instrument 51-101 ("NI 51-101"). Full disclosure with respect to the Company's reserves as at December 31, 2024 is included in the Company's annual information form for the year ended December 31, 2024 which has been filed on SEDAR+ ( www.sedarplus.ca ). The GLJ Reserves and Resources Report has been prepared in accordance with the standards contained in the Canadian Oil and Gas Evaluation Handbook (the "COGE Handbook" or "COGEH") that are consistent with the standards of NI 51-101. GLJ is a qualified reserves evaluator as defined in NI 51-101.
All net present values in this press release are based on estimates of future operating and capital costs and GLJ's forecast prices as of December 31, 2024 . The reserves definitions used in this evaluation are the standards defined by COGEH reserve definitions and are consistent with NI 51-101 and used by GLJ. The net present values of future net revenue attributable to Alvopetro's reserves estimated by GLJ do not represent the fair market value of those reserves. Other assumptions and qualifications relating to costs, prices for future production and other matters are summarized herein. The recovery and reserve estimates of the Company's reserves provided herein are estimates only and there is no guarantee that the estimated reserves will be recovered. Actual reserves may be greater than or less than the estimates provided herein. Possible reserves are those additional reserves that are less certain to be recovered than probable reserves. There is a 10% probability that the quantities actually recovered will equal or exceed the sum of proved plus probable plus possible reserves.
Cabur é Working Interest
Alvopetro's working interest in the Caburé natural gas field is 56.2% as of December 31, 2024 and the date hereof. This working interest is subject to redetermination, the first of which was completed in April 2024 . An independent expert (the "Expert") was engaged in connection with the first redetermination to evaluate the redetermination and the impact to each party's working interest. Following the Expert's decision, Alvopetro's working interest was increased from 49.1% to 56.2%. Alvopetro's partner filed a notice of dispute with respect to the Expert's decision, seeking to stay the redetermination procedure. Alvopetro subsequently filed a request for emergency arbitration before the International Chamber of Commerce ("ICC") seeking to make the Expert decision effective starting on June 1, 2024 . In May 2024 , Alvopetro received the decision of the emergency arbitrator ("the Order") wherein the arbitrator found in favour of Alvopetro, making the Expert decision effective June 1, 2024 until such time as the dispute is reviewed by and decided upon by an arbitral tribunal pursuant to the Rules of Arbitration of the ICC. The redetermination dispute has proceeded to a full arbitration under the Rules of the ICC, however the timing and outcome of the full arbitration is uncertain and the resulting impact on the reserves and the net present value of future net revenue attributable to such reserves as presented herein may be material. In addition, future redeterminations may also have a material impact on Alvopetro's reserves and future cash flows.
Contingent Resources
This news release discloses estimates of Alvopetro's contingent resources and the net present value associated with net revenues associated with the production of such contingent resources as included in the GLJ Reserves and Resources Report. There is no certainty that it will be commercially viable to produce any portion of such contingent resources and the estimated future net revenues do not necessarily represent the fair market value of such contingent resources. Estimates of contingent resources involve additional risks over estimates of reserves. Full disclosure with respect to the Company's contingent resources as at December 31, 2024 is included in the Company's annual information form for the year ended December 31, 2024 which has been filed on SEDAR+ ( www.sedarplus.ca ).
Prospective Resources
This news release discloses estimates of Alvopetro's prospective resources included in the GLJ Reserves and Resources Report. There is no certainty that any portion of the prospective resources will be discovered and even if discovered, there is no certainty that it will be commercially viable to produce any portion. Estimates of prospective resources involve additional risks over estimates of reserves. The accuracy of any resources estimate is a function of the quality and quantity of available data and of engineering interpretation and judgment. While resources presented herein are considered reasonable, the estimates should be accepted with the understanding that reservoir performance subsequent to the date of the estimate may justify revision, either upward or downward. Full disclosure with respect to the Company's prospective resources as at December 31, 2024 is included in the Company's annual information form for the year ended December 31, 2024 which has been filed on SEDAR+ ( www.sedarplus.ca ).
Other Metrics
This new release contains references to "production replacement ratio", a metric commonly used in the oil and natural gas industry, which has been calculated by management. This term does not have a standardized meaning and may not be comparable to similar measures presented by other companies, and therefore should not be used to make such comparisons.
"Production replacement ratio" is calculated by dividing the change in reserve volumes plus current year production by current year production. Alvopetro's 1P production replacement ratio and 2P production replacement ratio in 2024 is calculated as:
1P | 2P | |
Reserve volumes as at December 31, 2024 – Mboe | 4,512 | 9,148 |
Reserve volumes as at December 31, 2023 – Mboe | 2,727 | 8,711 |
Reserve additions – Mboe | 1,785 | 437 |
2024 production – Mboe | 657 | 657 |
Change in reserves before 2024 production - Mboe | 2,442 | 1,094 |
2024 production replacement ratio | 372 % | 167 % |
BOE Disclosure
The term barrels of oil equivalent ("boe") may be misleading, particularly if used in isolation. A boe conversion ratio of six thousand cubic feet per barrel (6 Mcf/bbl) of natural gas to barrels of oil equivalence is based on an energy equivalency conversion method primarily applicable at the burner tip and does not represent a value equivalency at the wellhead. All boe conversions in this news release are derived from converting gas to oil in the ratio mix of six thousand cubic feet of gas to one barrel of oil.
Contracted Natural Gas Volumes
The 2025 contracted daily firm volumes under Alvopetro's long-term gas sales agreement of 400 e 3 m 3 /d (before any provisions for take or pay allowances) represents contracted volumes based on contract referenced natural gas heating value. Alvopetro's reported natural gas sales volumes are prior to any adjustments for heating value of Alvopetro natural gas. Alvopetro's natural gas is approximately 7.8% higher than the contract reference heating value. Therefore, to satisfy the contractual firm deliveries Alvopetro would be required to deliver approximately 371e 3 m 3 /d (13.1MMcfpd).
Forward-Looking Statements and Cautionary Language
This news release contains forward-looking information within the meaning of applicable securities laws. The use of any of the words "will", "expect", "intend", "plan", "may", "believe", "estimate", "forecast", "anticipate", "should" and other similar words or expressions are intended to identify forward-looking information. Forward‐looking statements involve significant risks and uncertainties, should not be read as guarantees of future performance or results, and will not necessarily be accurate indications of whether or not such results will be achieved. A number of factors could cause actual results to vary significantly from the expectations discussed in the forward-looking statements. These forward-looking statements reflect current assumptions and expectations regarding future events. Accordingly, when relying on forward-looking statements to make decisions, Alvopetro cautions readers not to place undue reliance on these statements, as forward-looking statements involve significant risks and uncertainties. More particularly and without limitation, this news release contains forward-looking statements concerning the expected natural gas price, gas sales and gas deliveries under Alvopetro's long-term gas sales agreement, the timing and taxation of dividends and plans for dividends in the future, plans relating to the Company's operational activities, proposed exploration and development activities and the timing for such activities, capital spending levels, future capital and operating costs, future production and sales volumes, the expected timing of production commencement in Canada , arbitration procedures associated with the redetermination of working interests of the Caburé natural gas field, anticipated timing for upcoming drilling and testing of other wells, and projected financial results. Forward-looking statements are necessarily based upon assumptions and judgments with respect to the future including, but not limited to the success of future drilling, completion, testing, recompletion and development activities and the timing of such activities, the performance of producing wells and reservoirs, well development and operating performance, expectations and assumptions concerning the timing of regulatory licenses and approvals, equipment availability, environmental regulation, including regulation relating to hydraulic fracturing and stimulation, the ability to monetize hydrocarbons discovered, the outlook for commodity markets and ability to access capital markets, foreign exchange rates, the outcome of any disputes, the outcome of redeterminations, general economic and business conditions, forecasted demand for oil and natural gas, the impact of global pandemics, weather and access to drilling locations, the availability and cost of labour and services, and the regulatory and legal environment and other risks associated with oil and gas operations. The reader is cautioned that assumptions used in the preparation of such information, although considered reasonable at the time of preparation, may prove to be incorrect. Actual results achieved during the forecast period will vary from the information provided herein as a result of numerous known and unknown risks and uncertainties and other factors. Current and forecasted natural gas nominations are subject to change on a daily basis and such changes may be material. In addition, the declaration, timing, amount and payment of future dividends remain at the discretion of the Board of Directors. Although we believe that the expectations and assumptions on which the forward-looking statements are based are reasonable, undue reliance should not be placed on the forward-looking statements because we can give no assurance that they will prove to be correct. Since forward looking statements address future events and conditions, by their very nature they involve inherent risks and uncertainties. Actual results could differ materially from those currently anticipated due to a number of factors and risks. These include, but are not limited to, risks associated with the oil and gas industry in general (e.g., operational risks in development, exploration and production; delays or changes in plans with respect to exploration or development projects or capital expenditures; the uncertainty of reserve estimates; the uncertainty of estimates and projections relating to production, costs and expenses, reliance on industry partners, availability of equipment and personnel, uncertainty surrounding timing for drilling and completion activities resulting from weather and other factors, changes in applicable regulatory regimes and health, safety and environmental risks), commodity price and foreign exchange rate fluctuations, market uncertainty associated with trade or tariff disputes, and general economic conditions. The reader is cautioned that assumptions used in the preparation of such information, although considered reasonable at the time of preparation, may prove to be incorrect. Although Alvopetro believes that the expectations and assumptions on which such forward-looking information is based are reasonable, undue reliance should not be placed on the forward-looking information because Alvopetro can give no assurance that it will prove to be correct. Readers are cautioned that the foregoing list of factors is not exhaustive. Additional information on factors that could affect the operations or financial results of Alvopetro are included in our AIF which may be accessed on Alvopetro's SEDAR+ profile at www.sedarplus.ca . The forward-looking information contained in this news release is made as of the date hereof and Alvopetro undertakes no obligation to update publicly or revise any forward-looking information, whether as a result of new information, future events or otherwise, unless so required by applicable securities laws.
SOURCE Alvopetro Energy Ltd.
View original content: http://www.newswire.ca/en/releases/archive/March2025/18/c2211.html
News Provided by Canada Newswire via QuoteMedia
Trillion Energy International Inc. (“Trillion”or the “Company”)(CSE: TCF) (OTCQB: TRLEF) (Frankfurt: Z62), is pleased to announce an operational update for the SASB offshore gas project, Turkey.
In January 2025, the Company successfully installed new velocity string tubing in two tripod-based wells, Alapli-2 and Bayhanli-2, completing the operation within approximately two weeks. This follows the installation of similar tubing in four wells on the Akcakoca platform during the fall of 2024. In total, six wells have now been upgraded with the new smaller-diameter tubing to mitigate water loading and enhance production efficiency.
Following the velocity string program, the wells were injected with nitrogen to evacuate water, lower the bottom hole pressure and stimulate gas production. The wells responded positively to the nitrogen operation demonstrating the success of the velocity strings and confirming the effect of water reduction on the well performance.
In response to the recent operation results Trillion has selected several artificial lift techniques for various wells in an effort to enhance and sustain long-term production rates. The Company has secured a gas lift compressor system for the Akcakoca platform. This system will enable continuous gas lift injection into select wells to support production. Before deployment, the compressor will undergo testing on an onshore natural gas well, with modifications including piping, cabling, inverter, and separator installations.
Testing is scheduled to begin next week March 24, with final mobilization to the platform expected the following week. High pressure nitrogen injection is planned after the installation of the gas lift compressor to stimulate production.
Additionally, the Company is implementing several pump solutions to reduce water loading and optimize well performance. These enhancements include one Progressive Cavity Pump (PCP) and two slim-hole Electric Submersible Pumps (ESPs) attached to the new tubing. These strategic interventions are critical to sustaining long-term production rates and are expected to occur in the coming months.
About the Company
Trillion Energy International Inc is focused on oil and natural gas production for Europe and Türkiye with natural gas assets in Türkiye. The Company is 49% owner of the SASB natural gas field, a Black Sea natural gas development and a 19.6% (except three wells with 9.8%) interest in the Cendere oil field. More information may be found on www.sedar.com, and our website.
Contact
Sean Stofer, Chairman
Brian Park, VP of Finance
1-778-819-1585
E-mail: info@trillionenergy.com
Website: www.trillionenergy.com
Cautionary Statement Regarding Forward-Looking Statements
This news release may contain certain forward-looking information and statements, including without limitation, statements pertaining to the Company's ability to obtain regulatory approval of the executive officer and director appointments. All statements included herein, other than statements of historical fact, are forward-looking information and such information involves various risks and uncertainties. Trillion does not undertake to update any forward-looking information except in accordance with applicable securities laws.
These statements are no guarantee of future performance and are subject to certain risks, uncertainties, delay, change of strategy, and assumptions that are difficult to predict and which may change over time. Accordingly, actual results and strategies could differ materially and adversely from those expressed in any forward-looking statements as a result of various factors. These factors include unforeseen securities regulatory challenges, COVID, oil and gas price fluctuations, operational and geological risks, changes in capital raising strategies, the ability of the Company to raise necessary funds for development; the outcome of commercial negotiations; changes in technical or operating conditions; the cost of extracting gas and oil may increase and be too costly so that it is uneconomic and not profitable to do so and other factors discussed from time to time in the Company’s filings on www.sedar.com" target="_blank" rel="noopener noreferrer">www.sedar.com" target="_blank" rel="noopener noreferrer">www.sedar.com, including the most recently filed Annual Report on Form 20-F and subsequent filings. For a full summary of our oil and gas reserves information for Turkey, please refer to our Forms F-1,2,3 51-101 filed on www.sedar.com, and or request a copy of our reserves report effective December 31, 2022 and updated January 31 2023.
Investing News Network websites or approved third-party tools use cookies. Please refer to the cookie policy for collected data, privacy and GDPR compliance. By continuing to browse the site, you agree to our use of cookies.