The Conversation (0)

NV Gold Corporation (TSXV:NVX)(OTCQB:NVGLF) ("NV Gold" or the "Company") is pleased to announce that the Company has completed its IP Survey at its 100% owned Sandy Gold Project ("Sandy"), located within the Walker Lane, Lyon County, Nevada, USA. The Company's objective was to delineate sulfide concentrations via the chargeability and lithologies alteration via the resistivity (see Figure 1). The IP Survey results have led to the Company identifying various untested, potentially altered, and mineralized new targets to be drill-tested 1st Q of 2022
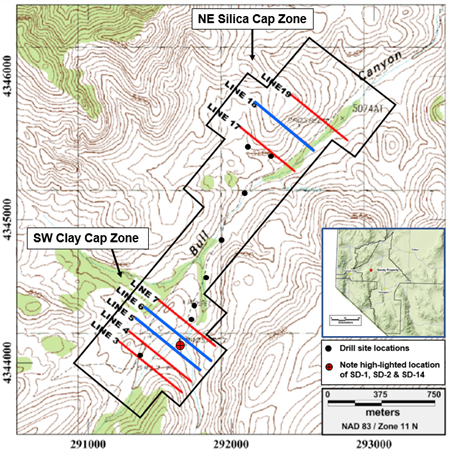
Figure 1 - IP Lines over topography and 2021 drill hole locations. (Note that IP Lines in blue color were used to present the interpreted IP targets)
Previously announced Highlights
CONCLUSIONS AND NEXT STEPS
The IP survey delineates lithologies, structures and alteration over two specific areas within the Sandy property. Numerous areas of sulfide concentration are also interpreted, which do not exhibit strong lithologic controls, but locations of hydrothermal alteration proximal to feeder structures. Vein responses are noted on Lines 4 through 6, and 18 and 19 along a prominent structural zone traversing the southwest and northeast borders of both survey blocks. This zone also correlates with moderate to high chargeability anomalies (see Figure 2 & 3). A low resistivity feeder to the silica cap on Line 18 is also interpreted (see Figure 4). Drill testing of the various targets will be conducted 1st Q of 2022 following a complete technical review to include integration of the IP results with all other of the property data.
"Previously stated conclusions of Leapfrog modeling combined with the recent results and interpretations of the Induced Polarization (IP) Survey strongly support the presence of a mineralized epithermal gold system at Sandy! The 2021 "maiden" RC (reverse circulation) drilling program did not intersect any of the new targets, neither underneath the Southwestern Clay Cap nor below the Northeastern Silica Cap. However, given the fact that most of our RC holes returned "system-indicating" gold values suggests strong potential for higher grade gold when targeting the overlapping resistor and chargeability anomalies. Having chargeability numbers up to 47 msec is very indicative for elevated sulfide occurrences which could represent a sulfide halo adjacent to mineralized quartz-veins. I am excited to evaluate the new anomalies and target interpretations of the Southwest Clay Cap and Northeast Silica Cap in our 2nd Phase drilling campaign in 1st Q of 2022", stated Thomas Klein, VP Exploration, NV Gold.
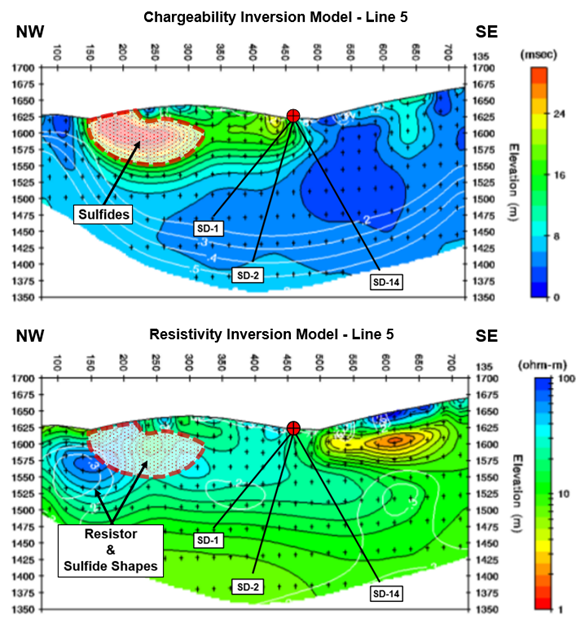
Figure 2 - Induced Polarization Survey: Inverted Chargeability and Resistivity Sections of Line 5. SD-2 which returned 22.9 meters @ 0.65 g/t Au starting at 29 meters appears to be drilled distal to the main chargeability and resistivity anomalies. (Note that drill holes are located in between IP Line 5 & 6 (refer to Figure 1)).
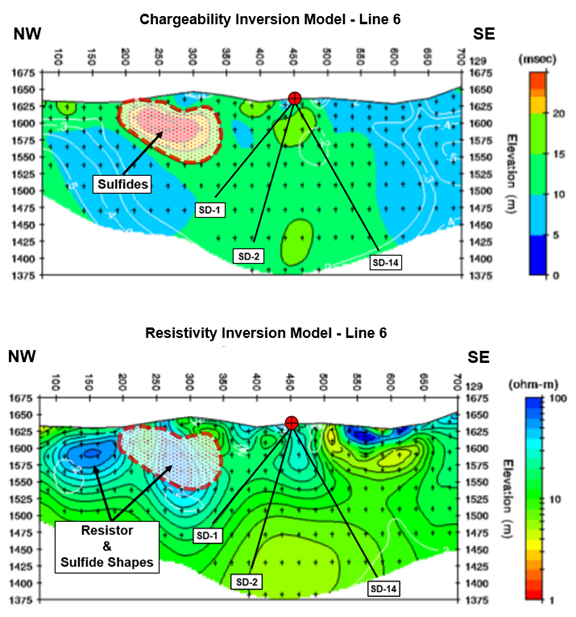
Figure 3 - Induced Polarization Survey: Inverted Chargeability and Resistivity Sections of Line 6. SD-2 which returned 22.9 meters @ 0.65 g/t Au starting at 29 meters appears to be drilled distal to the main chargeability and resistivity anomalies. (Note that drill holes are located in between IP Line 5 & 6 (refer to Figure 1)).
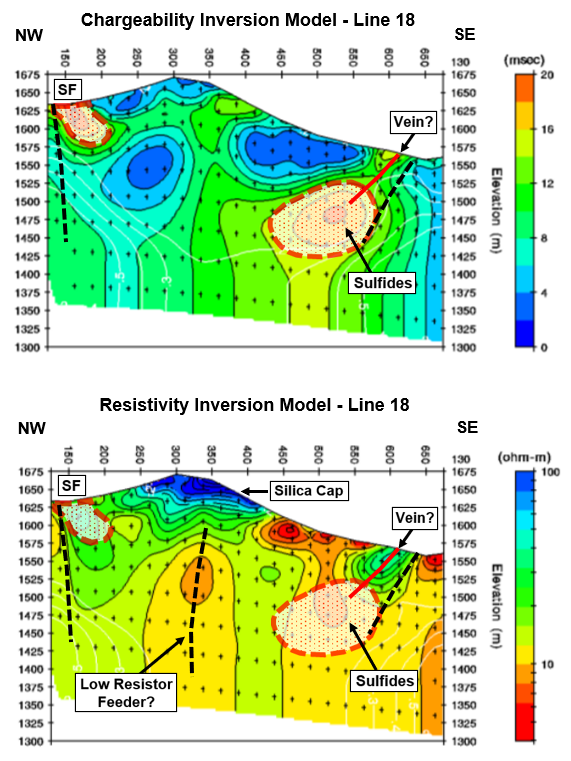
Figure 4 - Induced Polarization Survey: Inverted Chargeability and Resistivity Sections of Line 18. Note there was no drilling performed on this section (refer to Figure 1).
On behalf of the Board of Directors,
John E. Watson
President & CEO
For further information, visit the Company's website at www.nvgoldcorp.com or contact Freeform Communications at (604) 245-0054.
Neither the TSX Venture Exchange nor its Regulation Service Provider (as that term is defined in the policies of the TSX Venture Exchange) accepts responsibility for the adequacy or accuracy of this release.
Forward-Looking Statement
This news release includes certain forward-looking statements or information. All statements other than statements of historical fact included in this release, including, without limitation, statements regarding the extent and timing of the Company's planned exploration activities, the interpretation of the IP Survey results as indicating areas of alteration, sulphides or vein or feeder structures and the potential of these to host elevated gold system and the dimensions of the strike length and width are forward-looking statements that involve various risks and uncertainties. There can be no assurance that such statements will prove to be accurate and actual results and future events could differ materially from those anticipated in such statements. Important factors that could cause actual results to differ materially from the Company's plans or expectations include regulatory issues, market prices, availability of capital and financing, general economic, market or business conditions, timeliness of government or regulatory approvals, The Company disclaims any intention or obligation to update or revise any forward-looking statements whether because of new information, future events or otherwise, except as otherwise required by applicable securities legislation.
SOURCE: NV Gold Corporation
News Provided by ACCESSWIRE via QuoteMedia