
May 24, 2022
Latest drill results extend known mineralisation, paving way for an upgrade of the existing 873,500 oz mineral resource
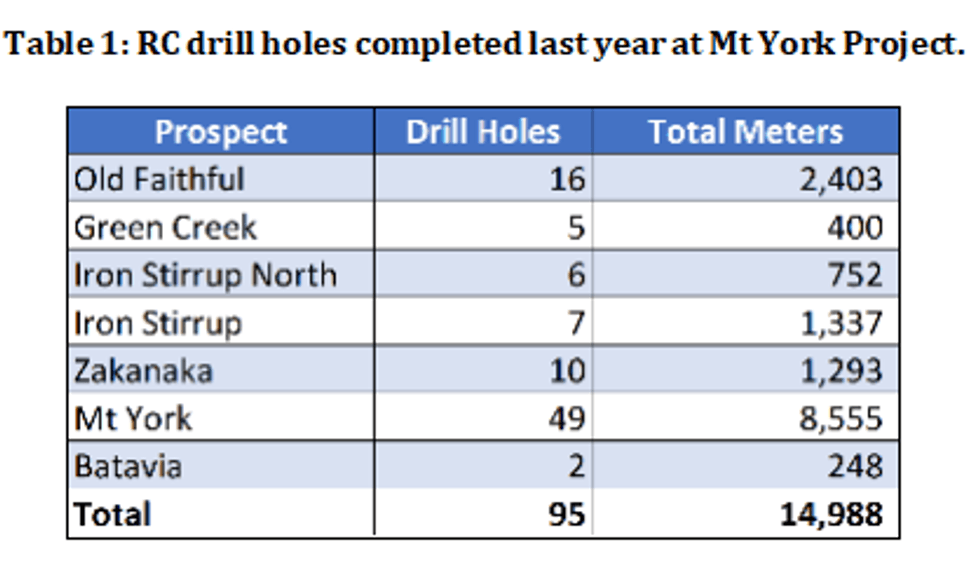
Kairos Minerals Ltd (ASX: KAI) is pleased to advise that it has received all final 4m-composite sample results from the RC drilling program conducted in 2021 at its 100%-owned Mt York Gold Project located in the Pilbara region of Western Australia. The 2021 RC drilling program at Mt York project comprised 95 drill holes for a total of 14,988m, and it was completed on the 19th of November. A breakdown of the drilling program is shown in Table 1. Previous results of this programme were announced in press releases by Kairos Minerals on 15th September 2021, 23rd November 2021 and 13th January 2022.
Highlights
- Final 4m-composite sample results received from the 14,988m Reverse Circulation drilling program completed in 2021 at the 873,500oz Mt York Gold Project
- Latest results include:
- 49m @ 1.75g/t Au from 135m in KMYC196 (The Gap), including:
- 19m @ 3.29g/t Au from 153m
- 24m @ 3.14g/t Au from 100m in KMYC198 (The Gap), including:
- 14m @ 4.30g/t Au from 104m
- 28m @ 1.66g/t Au from 32m in KMYC194 (Main Hill), including:
- 12m @ 3.26g/t Au from 32m
- 49m @ 1.75g/t Au from 135m in KMYC196 (The Gap), including:
- Results extend the new high-grade lode down-dip at “The Gap”, with intercepts including 8m @ 6.16g/t Au from 172m (KMYC197)
- These highly encouraging new results will help underpin a resource upgrade
- 1m re-splits submitted with results expected in June
Kairos Managing Director Dr Peter Turner said: “These results confirm that the Mt York Gold Project is a big system that is yet to be fully understood. The technical team has done a superb job targeting parts of the orebody that are either under-drilled or not drilled at all and have provided the Company with excellent results that it will take into the next round of resource estimation. These are some of the best grade and widths we have seen at Mt York to date.
“We have commenced a technical review of the deposit and are looking for more opportunities to increase our confidence in the mineralisation and importantly, substantially grow the resource. I remain extremely positive about delivering cost-effective exploration to deliver value with this highly promising asset.
“Organic growth through targeted drilling is in our view the best way to create shareholder value and is entirely in line with our strategy. We anticipate a further 10,000m drill programme at Mt York in the second half of the year”.
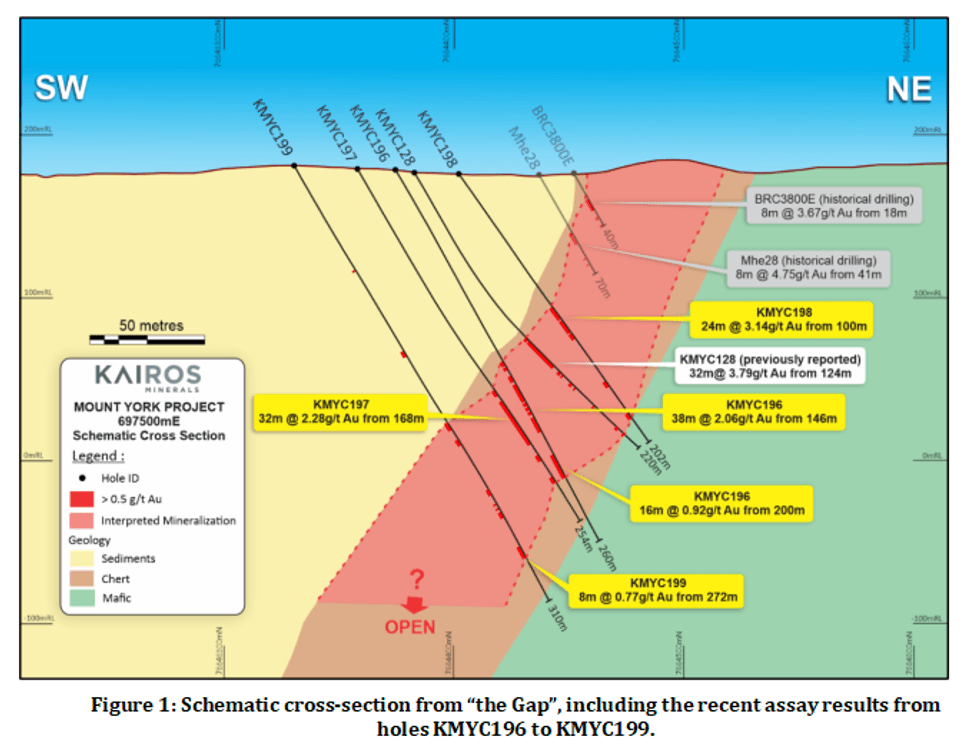
The RC holes drilled at the Mt York deposit continue to deliver exceptional results, including 49m @ 1.75g/t Au from 135m in KMYC196. See Figure 1 for a cross-section and Figure 3 for a plan view.
The Company is expecting results of the 1m resplit samples of mineralised intervals next month in preparation for a mineral resource update later in the year.
Mt York RC Drilling Program
This follow-up drilling at “The Gap” prospect, between Main Hill and Breccia Hill historic pits extends the mineralization zone approximately 75m down-dip with mineralisation remaining open at depth. KMYC197 returned exceptional intercepts of 8m @ 6.16g/t Au, extending the high-grade lode previously intercepted in hole KMYC128 (see ASX release, 15 September 2021).
These latest results will likely have a positive impact on the next mineral resource estimate, especially for the Gap prospect, where the previous estimate relied on only shallow drilling (see press release dated 4th March 2020).
Figure 1 shows the cross-section with the RC holes drilled to follow up the results from the KMYC128.
In-fill drilling conducted underneath the historic Main Hill pit, returned exceptional grades of up to 6.31 g/t Au (KMYC194), within a thick and shallow zone of 16m @ 2.60 g/t Au from 32m. See Figure 2 for a cross- section and Figure 3 for a plan view.
Click here for the full ASX Release
This article includes content from Kairos Minerals , licensed for the purpose of publishing on Investing News Australia. This article does not constitute financial product advice. It is your responsibility to perform proper due diligence before acting upon any information provided here. Please refer to our full disclaimer here.
KAI:AU
The Conversation (0)
14 February 2022
Kairos Minerals
Overview
When it comes to raw materials, the state of Western Australia in Australia stands out as one of the world’s largest exporters of raw materials. The state is the main exporter of minerals and petroleum commodities in Australia, including iron ore, gold, alumina, nickel, liquified natural gas, copper and lithium. Western Australia also produces a significant proportion of these commodities –– including 32 percent of the world’s iron ore and 29 percent of the world’s garnet.
However, Western Australia is considerably well-known for its long and documented history of gold rushes dating back to the late 1800s. In 2021, Australia was the third-largest producer of gold and according to the Annual Survey of Mining Companies for 2021, Western Australia bested other jurisdictions in terms of the Investment Attractiveness Index. Today, Western Australia’s Pilbara region is home to multiple gold-producing mines, including Novo Resources Corp.’s (TSE:NVO) Nullagine Gold project, Northern Star Resources Ltd.’s (ASX:NST) Paulsens Gold mine and Newcrest Mining Ltd.’s (TSE:NCM) Telfer mine.
Kairos Minerals Ltd. (ASX:KAI) is a mineral exploration company focused on advancing a portfolio of highly prospective gold projects in Australia. Kairos Minerals has two key project hubs located in Western Australia's premier mining districts. The company is led by a strong management team with decades of experience in mineral exploration.
The company’s fully-owned Pilbara Gold Project is located at the epicenter of the Pilbara gold rush in Pilgangoora. The project is home to the historical Lynas gold project which produced more than 125,000 ounces of gold from 1994 to 1998. The Pilbara Gold project is prospective for Hemi style intrusive related gold targets. The Hemi gold deposit is one of Australia’s recent major gold discoveries that sparked interest for its intrusive style of geology that was previously not well known for its mineralization.
Kairos Minerals’ Pilbara Gold project features three deposits, including the Mount York, Iron Stirrup and Old Faithful deposits which form the cornerstone of the project. Kairos announced an updated Indicated and Inferred Mineral Resource Estimate for these three centrally located deposits comprising 9 million tonnes at 1.3g/t gold for 873,500 ounces of contained gold which includes a Mineral Resource Estimate for the Mt York deposit of 17.2 million tonnes at 1.26g/t gold for 697,700 ounces of contained gold.
The company’s Pilbara Gold project consists of the Mount York and Pilbara Regional Gold projects. The flagship Mount York project includes an indicated and inferred resource of 17.2 million tonnes at 1.26 g/t of gold for 697,700 thousand ounces. The Mount York deposit is located approximately 100 kilometers southeast of Port Hedland. In January 2022, the company identified a significant new gold target with anomalous rock chip samples of up to 4.6 g/t of gold at the Mount York project.
Kairos Minerals’ Pilbara Regional Gold project is highly prospective for gold and lithium. The project spans 2,026 square kilometers of tenure, including granted and applications. In December 2021, the company confirmed the presence of pegmatites at the Wodgina project. As a part of the company’s review of its exploration portfolio for lithium, new targets were identified in the Pilbara region in 2022. Kairos confirmed a series of significant large-scale Lithium-Caesium-Tantalum (LCT) pegmatite targets prospective for lithium mineralisation within its 100 percent-owned Lalla Rookh Project.
In August 2022, Kairos reported high-grade lithium assays that confirm significant spodumene-bearing pegmatite discovered during routine earthmoving activities next to the flagship Mt York gold deposit. Five pegmatite samples from the Lucky Sump prospect have returned exceptional assays including 1.91 percent Li2O & 103 ppm Ta (MYR393), 1.56 percent Li2O & 115 ppm Ta (MYR401) and 0.58 percent Li2O & 167 ppm Ta (MYR396). The company further plans to conduct RC drill-test within the large area of Lucky Sump in September.
Kairos Minerals’ Eastern Goldfields project is situated in a world-class gold province with more than 130 million ounces of gold produced. The Eastern Goldfields project consists of the Roe Hills project located 120 kilometers east of Kalgoorlie in Western Australia’s Eastern Goldfields.
The fully-owned Roe Hills project comprises an extensive tenement portfolio. The company’s recent exploration work on the Roe Hills project has confirmed the potential for significant discoveries of high-grade gold, nickel, cobalt and lithium mineralization. A review of the soil sampling program conducted in 2020 has identified a coherent lithium and pathfinder elements anomaly in the area. The 2.7 kilometers x 0.4 kilometers northeast-trending lithium anomaly is similar in terms of its interpreted geology, orientation,and geochemistry to the Manna Lithium Prospect, now 80 percent-owned by Global Lithium Resources (ASX: GL1), located ~10km north of the Roe Hills project area.
The company leverages the strategic positioning of its assets. Kairos Minerals' Roe Hill project adjoins the emerging Lake Roe gold discovery that is owned by Breaker Resources (ASX: BRB). The Roe Hills project is also located near Silver Lake Resources’ Mount Monger/Randalls Gold operations and the Aldiss Gold project with million-plus tonne resources each. The company’s Pilbara Gold project is immediately adjacent to Pilbara Minerals’ major lithium-tantalum project which is currently in production.
The company is currently awaiting further assay results from RC drilling on its Mount York project. Going forward, the company is focused on obtaining results from the in-fill AC drilling program at the Kangan project. Kairos Minerals is also putting efforts into gold and lithium target generation from the previous exploration. Additionally, the company also plans to conduct mining studies for the Mount York project and commence analysis of the regional geochemistry sampling from Mount York, Wodgine, Kangan and Skywell projects. The company also hopes to complete additional heritage surveys at the Kangan and Skywell project as well as gold and lithium exploration at Roe Hills.
Company Highlights
- Kairos Minerals Ltd. (ASX:KAI) is a mineral exploration company focused on advancing a portfolio of highly prospective gold projects in premier mining districts in Western Australia, Australia.
- Kairos Minerals’ fully-owned Pilbara Gold project in a prolific district and features a JORC total mineral resource of 20.93 million tonnes at 1.3 g/t of gold for 873,000 ounces.
- The Pilbara Gold project is home to the historical Lynas gold project which produced more than 125,000 ounces of gold from 1994 to 1998.
- The company’s Pilbara Gold project consists of the flagship Mount York and Pilbara Regional Gold projects. The Mount York project includes an indicated and inferred resource of 17.2 million tonnes at 1.26 g/t of gold for 697,700 thousand ounces.
- Kairos Minerals’ Eastern Goldfields project consists of the fully-owned Roe Hills project in a world-class gold province. The Roe Hills project has the potential for significant discoveries of high-grade gold, nickel, cobalt and lithium mineralization.
- The company leverages the strategic positioning of its assets near major mineral discoveries and mineral-producing mines.
Get access to more exclusive Gold Investing Stock profiles here
Keep reading...Show less
Developing Highly Prospective Gold Projects in a World-Class Gold District
13h
Earthwise Minerals: Advancing the Iron Range Gold Project in BC
Earthwise Minerals (CSE:WISE,FSE:966) is an emerging gold exploration company leveraging a data-driven strategy to unlock significant upside in a tier-one Canadian jurisdiction. The company is advancing its Iron Range project in southeastern British Columbia—a district-scale land package with geological analogues to some of North America’s most prolific polymetallic systems.
Earthwise Minerals is pursuing a measured growth strategy that blends investor outreach with disciplined exploration. By integrating over $8 million of historic data with modern techniques, the company is advancing the Iron Range Gold Project efficiently and cost-effectively. A staged four-year option agreement provides a low-entry framework for exploration and supports a clear path toward drilling.
The Iron Range Gold Project is Earthwise Minerals’ flagship asset, spanning 21,437 hectares in southeastern British Columbia, just northeast of Creston. The property sits along the Iron Mountain Fault Zone (IMFZ), a major regional structure within the Purcell Supergroup that also hosts the world-class Sullivan SEDEX deposit. Earthwise controls over 50 kilometres of strike length along the IMFZ and its associated splays. The project benefits from excellent infrastructure, including Highway 3 crossing the property, Canadian Pacific rail access, and nearby BC Hydro power, natural gas, and water. Exploration is further streamlined by a multi-year area-based (MYAB) permit, enabling trenching, geophysics, road access, and drilling without the need for annual approvals.
Company Highlights
- Tight Capital Structure: Only 37.2 million shares fully diluted, providing strong leverage to exploration success without heavy dilution
- Flagship Iron Range Gold Project: District-scale property covering 21,437 hectares, strategically located along the Iron Mountain Fault Zone, within the same stratigraphy as the legendary Sullivan SEDEX deposit
- Strong Geological Foundation: Over $8 million of historical exploration, including geophysics, geochemistry, and drilling, provides a data-rich base for new high-impact targeting
- Low-cost Option Agreement: Earthwise can earn up to 80 percent of Iron Range from Eagle Plains Resources through staged payments and exploration commitments totaling $4 million over four years
- World-class Infrastructure: The project is road accessible, bisected by Highway 3 and Canadian Pacific rail, with nearby power, natural gas and water resources
- Proven Leadership: CEO Mark Luchinski and VP exploration George Yordanov bring capital markets expertise and technical discovery experience, supported by a well-rounded board with financial and digital strategy capabilities
This Earthwise Minerals profile is part of a paid investor education campaign.*
Click here to connect with Earthwise Minerals (CSE:WISE) to receive an Investor Presentation
Keep reading...Show less
15h
Chen Lin: Gold, Silver Prices Breaking Out, My Stock Strategy Now
Chen Lin of Lin Asset Management discusses what's behind gold's latest price move.
"Recently the stock in China's gold futures market just went parabolic — that actually preceded the recent gold breakout ... both had been rangebound for a long, long time, and then suddenly started breaking out two weeks ago," the expert explained.
Don't forget to follow us @INN_Resource for real-time updates!
Securities Disclosure: I, Charlotte McLeod, hold no direct investment interest in any company mentioned in this article.
Keep reading...Show less
17h
Earthwise Minerals
Investor Insight
With a data-driven exploration strategy, Earthwise Minerals is an emerging gold exploration company with significant upside potential in a tier-one Canadian jurisdiction. The company is advancing the Iron Range gold project in southeastern British Columbia, a district-scale land package with geological analogues to some of North America’s most prolific polymetallic systems.
Overview
Earthwise Minerals (CSE:WISE,FSE:966) is a Vancouver-based exploration company advancing the fully permitted Iron Range Gold Project in southeastern British Columbia. The project benefits from a multi-year exploration and drilling permit that provides flexibility for efficient advancement. With a history of significant gold discoveries and more than $8 million in historic exploration work, Iron Range represents the company’s primary focus and a district-scale opportunity in a tier-one jurisdiction.
Iron range property looking from Talon Zone area towards Arrow Creek
Earthwise Minerals is pursuing a measured growth strategy that blends investor outreach with disciplined exploration. By integrating over $8 million of historic data with modern techniques, the company is advancing the Iron Range Gold Project efficiently and cost-effectively. A staged four-year option agreement provides a low-entry framework for exploration and supports a clear path toward drilling.
Company Highlights
- Tight Capital Structure: Only 37.2 million shares fully diluted, providing strong leverage to exploration success without heavy dilution
- Flagship Iron Range Gold Project: District-scale property covering 21,437 hectares, strategically located along the Iron Mountain Fault Zone, within the same stratigraphy as the legendary Sullivan SEDEX deposit
- Strong Geological Foundation: Over $8 million of historical exploration, including geophysics, geochemistry, and drilling, provides a data-rich base for new high-impact targeting
- Low-cost Option Agreement: Earthwise can earn up to 80 percent of Iron Range from Eagle Plains Resources through staged payments and exploration commitments totaling $4 million over four years
- World-class Infrastructure: The project is road accessible, bisected by Highway 3 and Canadian Pacific rail, with nearby power, natural gas and water resources
- Proven Leadership: CEO Mark Luchinski and VP exploration George Yordanov bring capital markets expertise and technical discovery experience, supported by a well-rounded board with financial and digital strategy capabilities
Key Project
Iron Range Gold Project
The Iron Range Gold Project is Earthwise Minerals’ flagship asset, covering 21,437 hectares in southeastern British Columbia, just northeast of Creston. The property is underlain by the Iron Mountain Fault Zone (IMFZ), a major regional structure within the Purcell Supergroup that also hosts the world-class Sullivan SEDEX deposit. Earthwise controls more than 50 kilometres of strike length along the IMFZ and associated splays. The project benefits from excellent infrastructure, with Highway 3 crossing the property, Canadian Pacific rail access, and nearby BC Hydro power, natural gas, and water. Exploration is further supported by a multi-year area-based (MYAB) permit, allowing trenching, geophysics, road access, and drilling without the need for annual approvals.
A robust exploration dataset underpins the project. A 2004 VTEM survey outlined conductivity trends coincident with the IMFZ, while systematic soil geochemistry defined multi-element anomalies (arsenic, lead, zinc, and gold), including “Sullivan-style” lead-zinc responses within the Lower–Middle Aldridge Contact — a stratigraphic horizon strongly associated with SEDEX mineralization. Induced polarization (IP) surveys completed in 2017 identified a down-plunge chargeability anomaly at the Talon/Canyon Zone. Follow-up drilling in 2018 confirmed this target, returning mineralized intercepts consistent with the geophysical model and demonstrating continuity beneath surface anomalies.
Mineralization styles at Iron Range are polymetallic and diverse, including intermediate-sulphidation epithermal systems with alteration assemblages of silica, K-feldspar, sericite, and carbonate. Mineralization occurs within brittle shear and breccia zones ranging from one metre to several tens of metres wide, spatially associated with the IMFZ and concentrated within approximately 150 metres of the LMC.
Historic drilling at the Talon/Canyon Zone has returned broad and high-grade intercepts, including:
- 56.5 m grading 1.9 g/t gold, 0.44 percent lead, 0.59 percent zinc, and 19.7 g/t silver
- 14.0 m grading 5.1 g/t gold, 1.86 percent lead, 2.1percent zinc, and 75.3 g/t silver
- 2.0 m grading 12.8 g/t gold, 4.18 percent lead, 5.06 percent zinc, and 122.5 g/t silver (drill hole IR10-010)
Mineralization remains open along strike and at depth, with overlapping geophysical and geochemical vectors indicating potential for parallel or offset mineralized shoots. Earthwise’s 2025 exploration program is focused on detailed structural mapping, systematic geochemical sampling, and expanded IP surveys to refine 3D chargeability and resistivity models, helping to de-risk future drill targeting. A Phase 1 drill campaign (~2,500 metres) is scheduled for 2026 to test down-plunge extensions of the Talon/Canyon Zone and evaluate additional parallel structures.
Under the option agreement with Eagle Plains Resources, Earthwise can earn a 70 percent interest over four years through staged cash, share and exploration commitments. An additional 10 percent interest (to 80 percent) can be acquired for a $1-million cash payment within 120 days of vesting at 70 percent. Eagle Plains retains a 1 percent NSR on part of the property. This represents a low-cost entry relative to the more than $8 million of historical work already completed, allowing Earthwise to direct capital toward geophysics and drilling rather than re-establishing baseline exploration.
The emphasis on geophysics is strategic. In structurally complex belts where mineralization occurs in breccia, veins and disseminated sulphides, IP surveys are a proven, cost-effective discriminator. They can identify disseminated to semi-massive sulphides, distinguish mineralized from barren host rocks, and provide depth slices for 3D geological modelling. When integrated with legacy VTEM, geochemical surveys and drill data, modern IP provides the most efficient pathway to precise, high-value drilling designed to answer key questions of geometry, grade distribution and vectoring within the system.
Management Team
Mark Luchinski – Chief Executive Officer
Mark Luchinski is a seasoned entrepreneur and capital markets specialist with two decades of experience managing public companies and advancing exploration projects. He has guided multiple firms through financing, acquisitions, exploration and public listings. In addition to Earthwise, he serves as a director of Aeonian Resources.
George Yordanov – VP Exploration and Director
A professional geologist and NI 43-101 qualified person with over 15 years of exploration experience, George Yordanov has contributed to grassroots discoveries with Osisko Mining, Sumitomo Metal and Dundee Precious Metals, bringing expertise across gold, base metals and lithium exploration.
Solomon Kasirye – Director
Solomon Kasirye is a registered geoscientist with over a decade of experience across resource estimation, exploration, mine geology and commodity research. He is the managing director of SoloCore Solutions and holds advanced degrees in Metal & Energy Finance (Imperial College London) and Mineral Resource Management (University of Free State)
Mateo Arcila – Director
An engineer with 10+ years of business development and digital strategy experience, Mateo Arcila leads Earthwise’s corporate outreach, digital presence and capital markets engagement. His background spans marketing, big data analytics and international business
Ikavinder Deol – Chief Financial Officer
Ikavinder Deol is CPA with over six years of experience in financial reporting and regulatory compliance for junior mining companies. She is also with Cross Davis & Company, specializing in IFRS reporting for resource companies
Keep reading...Show less
17h
Newmont Withdraws from Mount Coolon Joint Venture, GBM Regains Full Ownership
GBM Resources (ASX:GBZ) announced it has regained ownership of the Mount Coolon gold project in Queensland following Newmont’s (TSX:NEM,NYSE:NEM,ASX:NEM) termination of a 2022 farm-in agreement.
GBM made the deal with Newcrest Mining before that company was acquired by Newmont in 2023.
Newmont's withdrawal is part of its focus on divesting non-core assets to hone in on its more profitable and stable tier one operations. The company has made substantial adjustments to its portfolio this year.
GBM reacted positively to Monday's (September 15) news, saying that regaining full ownership of the project aligns with its strategy to build a leading gold portfolio in the Drummond Basin.
“We are excited to regain 100 percent ownership, and our exploration team are enthusiastic about getting on the ground as we see significant upside on the Mt Coolon Tenure,” commented CEO Daniel Hastings.
Located within the Drummond Basin and near GBM’s Twin Hills and Yandan projects, Mount Coolon has a JORC resource of 6.65 million tonnes at 1.54 grams per tonne gold for 330,000 ounces of the metal.
Together, Twin Hills and Yandan hold a total resource of 1.84 million ounces of gold.
“With Twin Hills and Yandan nearby, we now control a substantial area of highly prospective ground within the Drummond Basin which provides GBM with the scale and flexibility to unlock significant value," Hastings added.
Newmont also announced the sale of its Coffee project in Yukon, Canada, to Fuerte Metals (TSXV:FMT,OTCQB:FUEMF) on Monday for potential total consideration of US$150 million. The company said that sale was also part of its efforts to streamline its portfolio and sharpen its focus on core operations.
On September 10, Newmont said it plans to voluntarily delist from the Toronto Stock Exchange.
Don’t forget to follow us @INN_Resource for real-time updates!
Securities Disclosure: I, Gabrielle de la Cruz, hold no direct investment interest in any company mentioned in this article.
Keep reading...Show less
19h
What Was the Highest Price for Gold?
Gold has long been considered a store of wealth, and the price of gold often makes its biggest gains during turbulent times as investors look for cover in this safe-haven asset.
The 21st century has so far been heavily marked by episodes of economic and sociopolitical upheaval. Uncertainty has pushed the precious metal to record highs as market participants seek its perceived security.
And each time the gold price rises, there are calls for even higher record-breaking levels.
Gold market gurus from Lynette Zang to Chris Blasi to Jordan Roy-Byrne have shared eye-popping predictions on the gold price that would intrigue any investor — gold bug or not.
Some have posited that the gold price may rise as high as US$4,000 or US$5,000 per ounce, and there are those who believe that US$10,000 gold or even US$40,000 gold could become a reality.
These impressive price predictions have investors wondering, what is gold's all-time high (ATH)?
In the past year, gold has reached new all-time highs dozens of times. Find out what has driven it to these levels, plus how the gold price has moved historically and what has impacted its performance in recent years.
In this article
How is gold traded?
Before discovering what the highest gold price ever was, it’s worth looking at how the precious metal is traded. Knowing the mechanics behind gold's historical moves can help illuminate why and how its price changes.
Gold bullion is traded in dollars and cents per ounce, with activity taking place worldwide at all hours, resulting in a live price. Investors trade gold in major commodities markets such as New York, London, Tokyo and Hong Kong.
London is seen as the center of physical precious metals trading, including for silver. The COMEX division of the New York Mercantile Exchange is home to most paper trading.
There are many popular ways to invest in gold. The first is through purchasing gold bullion products such as bullion bars, bullion coins and rounds. Physical gold is sold on the spot market, meaning that buyers pay a specific price per ounce for the metal and then have it delivered or stored in a secure facility. In some parts of the world, such as India, buying gold in the form of jewelry is the largest and most traditional route to investing in gold.
Another path to gold investment is paper trading, which is done through the gold futures market. Participants enter into gold futures contracts for the delivery of gold in the future at an agreed-upon price.
In such contracts, two positions can be taken: a long position under which delivery of the metal is accepted or a short position to provide delivery of the metal. Paper trading as a means to invest in gold can provide investors with the flexibility to liquidate assets that aren’t available to those who possess physical gold bullion.
One significant long-term advantage of trading in the paper market is that investors can benefit from gold’s safe-haven status without needing to store it. Furthermore, gold futures trading can offer more financial leverage in that it requires less capital than trading in the physical market. Investors can also purchase physical gold via the futures market, but the process is complicated and lengthy and comes with a large investment and additional costs.
Aside from those options, market participants can invest in gold through exchange-traded funds (ETFs). Investing in a gold ETF is similar to trading a gold stock on an exchange, and there are numerous gold ETF options to choose from depending on your preference. For instance, some ETFs focus solely on physical gold bullion, while others focus on gold futures contracts. Other gold ETFs center on gold-mining stocks or follow the gold spot price.
It is important to understand that you will not own any physical gold when investing in an ETF — in general, even a gold ETF that tracks physical gold cannot be redeemed for tangible metal.
Gold has an interesting relationship with the stock market. The two often move in sync during “risk-on periods” when investors are bullish. On the flip side, they tend to become inversely correlated in times of volatility.
According to the World Gold Council, gold's ability to decouple from the stock market during periods of stress makes it “unique amongst most hedges in the marketplace.” It is often during these times that gold outperforms the stock market. For that reason, it is often used as a portfolio diversifier to hedge against uncertainty.
There are a variety of options for investing in gold stocks, including gold-mining stocks on the TSX and ASX, gold juniors, precious metals royalty companies and gold stocks that pay dividends.
What was the highest gold price ever?
The gold price peaked at US$3,702.45, its all-time high, during trading on September 16, 2025.
What drove it to this new ATH? Gold reached its new highest price the first day of the September US Federal Reserve meeting of the Federal Open Market Committee, at which an interest rate cut is widely expected.
On September 12, the prior trading day, the release of US consumer price index (CPI) data for August showed the overall inflation rose to 2.9 percent on an annual basis and 0.4 percent over July. Weak jobs data the week before further fueled expectations of a rate cut at the upcoming US Fed meeting.
Additionally, the US dollar index continued its largely downward trend that started in mid-January, falling to a year-to-date low 96.56 on September 16. Traditionally, gold often trades higher when the US dollar is weak, making gold a popular hedge investment.
While gold's fresh ATH came on September 15, on September 7 gold's record breaking run officially surpassed its inflation adjusted all-time high of US$850 per ounce set in January 1980 the week before.
It has set multiple news highs in the preceding weeks amid significant uncertainty in the US and global economies and surging gold ETF purchases.
One key driver came on August 29, when a US federal appeals court ruled that US President Donald Trump's "Liberation Day" tariffs, announced in April, are illegal, stating that only Congress has the power to enact widespread tariffs. The Trump administration is expected to appeal the ruling, which will go into effect on October 14.
Bond market turmoil in the US and abroad on September 2 also provided tailwinds for the gold price.
2025 gold price performance
Gold price chart, December 31, 2024, to September 16, 2025.
Chart via the Investing News Network.
Why is the gold price setting new highs in 2025?
Gold's record-setting activity extends beyond the last two weeks as well.
Increased economic and geopolitical turmoil caused by the Trump administration has been a tailwind for gold this year, as well as a weakening US dollar, sticky inflation in the country and increased safe-haven gold demand.
Since coming into office in late January, Trump has threatened or enacted tariffs on many countries, including blanket tariffs on longtime US allies Canada and Mexico and tariffs on the EU.
Trump has also implemented 25 percent tariffs on all steel and aluminum imports.
The gold price set a string of new highs in the month of April amid high market volatility as markets reacted to tariff decisions from Trump and the escalating trade war between the US and China. By April 11, Trump had raised US tariffs on Chinese imports to 145 percent and China had raised its tariffs on US products to 125 percent. Trump has reiterated that the US may need to go through a period of economic pain to enter a new "golden age" of economic prosperity.
Falling markets and a declining US dollar have supported gold too, as well as increased buying from China. Elon Musk's call to audit the gold holdings in Fort Knox has also brought attention to the yellow metal.
What factors have driven the gold price in the last five years?
Despite these recent runs, gold has seen its share of both peaks and troughs over the last decade. After remaining rangebound between US$1,100 and US$1,300 from 2014 to early 2019, gold pushed above US$1,500 in the second half of 2019 on a softer US dollar, rising geopolitical issues and a slowdown in economic growth.
Gold’s first breach of the significant US$2,000 price level in mid-2020 was due in large part to economic uncertainty caused by the COVID-19 pandemic. To break through that barrier and reach what was then a record high, the yellow metal added more than US$500, or 32 percent, to its value in the first eight months of 2020.
Gold price chart, September 14, 2020, to September 15, 2025.
Chart via the Investing News Network.
The gold price surpassed that level again in early 2022 as Russia's invasion of Ukraine collided with rising inflation around the world, increasing the allure of safe-haven assets and pulling the yellow metal up to a price of US$2,074.60 on March 8. However, it fell throughout the rest of 2022, dropping below US$1,650 in October.
Although it didn't quite reach the level of volatility as the previous year, the gold price experienced drastic price changes in 2023 on the back of banking instability, high interest rates and the breakout of war in the Middle East.
After central bank buying pushed the gold price up to the US$1,950.17 mark by the end of January, the Fed's 0.25 percent rate hike on February 1 sparked a retreat as the dollar and treasury yields saw gains. The precious metal went on to fall to its lowest price level of the year at US$1,809.87 on February 23.
The banking crisis that hit the US in early March caused a domino effect through the global financial system and led to the mid-March collapse of Credit Suisse, Switzerland’s second-largest bank. The gold price had jumped to US$1,989.13 by March 15. The continued fallout in the global banking system throughout the second quarter of the year allowed gold to break above US$2,000 on April 3, and go on to flirt with a near-record high of US$2,049.92 on May 3.
Those gains were tempered by the Fed’s ongoing rate hikes and improvements in the banking sector, resulting in a downward trend in the gold price throughout the remainder of the second quarter and throughout Q3. By October 4, gold had fallen to a low of US$1,820.01 and analysts expected the precious metal to drop below US$1,800.
That was before the October 7 attacks by Hamas on Israel ignited legitimate fears of a much larger conflict erupting in the Middle East. Reacting to those fears, and to rising expectations that the Fed would begin to reverse course on interest rates, gold broke through the important psychological level of US$2,000 and closed at US$2,007.08 on October 27. As the fighting intensified, gold reached a then-new high of US$2,152.30 in intraday trading on December 3.
That robust momentum in the spot gold price continued into 2024, chasing new highs on fears of a looming US recession, the promise of Fed rate cuts on the horizon, the worsening conflict in the Middle East and the tumultuous US presidential election year. By mid-March, gold was pushing up against the US$2,200 level.
That record-setting momentum continued into the second quarter of 2024, when gold broke through US$2,400 in mid-April on strong central bank buying, sovereign debt concerns in China and investors expecting the Fed to start cutting interest rates. The precious metal went on to hit US$2,450.05 on May 20.
Throughout the summer, the hits kept on coming.
The global macro environment was highly bullish for gold leading up to the US election. Following the failed assassination attempt on Trump and a statement about coming rate cuts by Fed Chair Jerome Powell, the gold spot price hit a then new all-time high on July 16 at US$2,469.30. One week later, news that then-President Joe Biden would not seek re-election and would instead pass the baton to Vice President Kamala Harris eased some of the tension in the stock market and strengthened the US dollar. This also pushed the price of gold down to US$2,387.99 on July 22, 2024.
However, the bullish factors supporting gold remained in play, and the spot price for gold went on to breach US$2,500 on August 2 that year on a less-than-stellar US jobs report; it closed just above the US$2,440 level. A few weeks later, gold pushed past US$2,500 once again on August 16, closing above that level for the first time ever after the US Department of Commerce released data showing a fifth consecutive monthly decrease in a row for homebuilding.
The news that the Chinese government issued new gold import quotas to banks in the country following a two month pause also helped fuel the gold price rally. Central bank gold buying has been a significant tailwind for the gold price this year, and China's central bank has been one of the strongest buyers.
Market watchers expected the Fed to cut interest rates by a quarter point at its September 2024 meeting, but news on September 12 that the regulators were still deciding between the expected cut or a larger half-point cut led the gold price on a rally that carried through into the next day, bringing the metal near US$2,600.
At the September 18 Fed meeting, the committee ultimately made the decision to cut rates by half a point, news that sent gold even higher. By September 20, it had moved above US$2,600 and was holding above US$2,620.
In October 2024, gold first breached the US$2,700 level and continued to higher on a variety of factors, including further rate cuts and economic data anticipation, the escalating conflict in the Middle East between Israel and Hezbollah, and economic stimulus in China — not to mention the very close race between the US presidential candidates.
While the gold price fell following Trump's win in early November and largely held under US$2,700 through the end of the year, it began trending upward in 2025 to the new all-time high discussed earlier in the article.
What's next for the gold price?
What's next for the gold price is never an easy call to make. There are many factors to consider, but some of the most prevalent long-term drivers include economic expansion, market risk, opportunity cost and momentum.
Economic expansion is one of the primary gold price contributors as it facilitates demand growth in several categories, including jewelry, technology and investment. As the World Gold Council explains, “This is particularly true in developing economies where gold is often used as a luxury item and a means to preserve wealth.”
Market risk is also a prime catalyst for gold values as investors view the precious metal as the “ultimate safe haven,” and a hedge against currency depreciation, inflation and other systemic risks.
Going forward, in addition to the Fed, inflation and geopolitical events, experts will be looking for cues from factors like supply and demand. In terms of supply, the world’s five top gold producers are China, Australia, Russia, Canada and the US. The consensus in the gold market is that major miners have not spent enough on gold exploration in recent years. Gold mine production has fallen from around 3,200 to 3,300 metric tons (MT) each year between 2018 and 2020 to around 3,000 to 3,100 MT each year between 2021 and 2023.
On the demand side, China and India are the biggest buyers of physical gold, and are in a perpetual fight for the title of world’s largest gold consumer. That said, it's worth noting that the last few years have brought a big rebound in central bank gold buying, which dropped to a record low in 2020, but reached a 55 year high of 1,136 MT in 2022.
World Gold Council data shows 2024 central bank gold purchases came to 1,044.6 MT, marking the third year in a row above 1,000 MT. In H1 2025, the organization says gold purchases from central banks reached 415.1 MT.
“I expect the Fed’s rate-cutting cycle to be good for gold, but central bank buying has been and remains a major factor," Lobo Tiggre, CEO of IndependentSpeculator.com, told the Investing News Network (INN) at the start of Q4 2024.
David Barrett, CEO of the UK division of global brokerage firm EBC Financial Group, is also keeping an eye on central bank purchases of gold. “I still see the global central bank buying as the main driver — as it has been over the last 15 years,” the expert said in an email to INN. "This demand removes supply from the market. They are the ultimate buy-and-hold participants and they have been buying massive amounts."
In addition to central bank moves, analysts are also watching escalating tensions in the Middle East, a weakening US dollar, declining bond yields and further interest rate cuts as factors that could push gold higher as investors look to secure their portfolios. “When it comes to outside factors that affect the market, it’s just tailwind after tailwind after tailwind. So I don’t really see the trend changing,” said Eric Coffin of Hard Rock Analyst.
Randy Smallwood of Wheaton Precious Metals (TSX:WPM,NYSE:WPM) told INN in March 2025 that gold is seeing support from many factors, including central bank buying, nervousness around the US dollar and stronger institutional interest. Smallwood is seeing an influx of fund managers wanting to learn about precious metals.
Joe Cavatoni, senior market strategist, Americas, at the World Gold Council, believes that market risk and uncertainty surrounding tariffs and continued demand from central banks are the main drivers of gold.
"Market risk in particular is a key strategic driver for the gold price and performance," Cavatoni told INN in a July 2025 interview. "Think strategically when you think about gold, and keep that allocation in mind."
Check out more of INN's interviews to find out what experts have said about the gold price during its 2025 bull run and where it could go next.
Should you beware of gold price manipulation?
It’s important for investors to be aware that gold price manipulation is a hot topic in the industry.
In 2011, when gold hit what was then a record high, it dropped swiftly in just a few short years. This decline after three years of impressive gains led many in the gold sector to cry foul and point to manipulation.
Early in 2015, 10 banks were hit in a US probe on precious metals manipulation.
Evidence provided by Deutsche Bank (NYSE:DB) showed “smoking gun” proof that UBS Group (NYSE:UBS), HSBC Holdings (NYSE:HSBC), the Bank of Nova Scotia (TSX:BNS,NYSE:BNS and other firms were involved in rigging gold and silver rates in the market from 2007 to 2013. Not long after, the long-running London gold fix was replaced by the LBMA gold price in a bid to increase gold price transparency. The twice-a-day process, operated by the ICE Benchmark Administration, still involves a variety of banks collaborating to set the gold price, but the system is now electronic.
Still, manipulation has by no means been eradicated, as a 2020 fine on JPMorgan Chase & Co. (NYSE:JPM) shows. The next year, chat logs were released in a spoofing trial for two former precious metals traders from the Bank of America's (NYSE:BAC) Merrill Lynch unit. They show a trader bragging about how easy it is to manipulate the gold price.
Gold market participants have consistently spoken out about manipulation. In mid-2020, Chris Marcus, founder of Arcadia Economics and author of the book “The Big Silver Short,” said that when gold fell back below the US$2,000 mark after hitting close to US$2,070, he saw similarities to what happened with the gold price in 2011.
Marcus has been following the gold and silver markets with a focus specifically on price manipulation for nearly a decade. His advice? “Trust your gut. I believe we’re witnessing the ultimate ’emperor’s really naked’ moment. This isn’t complex financial analysis. Sometimes I think of it as the greatest hypnotic thought experiment in history.”
Investor takeaway
While we have the answer to what the highest gold price ever is as of now, it remains to be seen how high gold can climb, and if the precious metal can reach as high as US$5,000, US$10,000 or even US$40,000.
Even so, many market participants believe gold is a must have in any investment profile, and there is little doubt investors will continue to see gold price action making headlines this year and beyond.
This is an updated version of an article first published by the Investing News Network in 2020.
Don’t forget to follow us @INN_Resource for real-time updates!
Securities Disclosure: I, Lauren Kelly, hold no direct investment interest in any company mentioned in this article.
Editorial Disclosure: The Investing News Network does not guarantee the accuracy or thoroughness of the information reported in the interviews it conducts. The opinions expressed in these interviews do not reflect the opinions of the Investing News Network and do not constitute investment advice. All readers are encouraged to perform their own due diligence.
Keep reading...Show less
16 September
Angkor Resources: Unlocking Cambodia’s Resource Potential through Energy and Minerals Assets
Founded in 2009 and listed in 2011, Angkor Resources (TSXV:ANK,OTCQB:ANKOF) has developed a dual focus on energy and minerals across Asia and North America.
Angkor Resources is advancing a dual-track strategy across energy and minerals. In Canada, its subsidiary EnerCam Exploration generates revenue from oil production, water disposal, and gas processing, while also pioneering carbon capture and conversion solutions.
In Cambodia, subsidiary EnerCam Resources is driving the nation’s first-ever onshore oil and gas exploration on Block VIII, positioning the company for transformational growth. On the mineral side, Angkor is a first-mover in Cambodia’s underexplored belts, with licenses at Andong Meas and Andong Bor targeting both precious and base metals, where exploration has already confirmed copper porphyry systems and high-grade gold mineralization.
Angkor mitigates risk by diversifying revenue, combining recurring Canadian cash flow with high-impact exploration in Cambodia, where management prioritizes hydrocarbons and copper, highlighting 25 million recoverable barrels and significant copper-gold potential.
Company Highlights
- Diversified Energy & Mineral Portfolio: Exposure to high-impact oil and gas exploration in Cambodia (Block VIII), recurring energy revenues in Canada, and copper-gold porphyry systems with gold epithermal near-surface prospects in Cambodia.
- Near-term Catalysts:
- Results from copper porphyry in Cambodia within 30 to 60 days;
- Seismic completion and interpretation for drill targets on Block VIII within 90 days; and
- Acquisition of oil production for increased recurring revenue streams.
- Transformational Asset: Block VIII is Cambodia’s first onshore oil and gas exploration license, strategically located near export infrastructure. Potential minimum targets estimated at 25 to 50+ million recoverable barrels.
- Revenue-backed Model: EnerCam Canada provides recurring revenue streams via oil production, water disposal, gas processing, and carbon capture solutions, insulating Angkor from over-reliance on equity markets.
- Strong ESG Commitment: Recognized at the United Nations for sustainability, Angkor integrates carbon capture, community partnerships and environmental responsibility into every project.
- Aligned Shareholder Base: Over 40 percent insider ownership with regular insider buying, demonstrating management’s confidence in long-term growth.
This Angkor Resources profile is part of a paid investor education campaign.*
Click here to connect with Angkor Resources (TSXV:ANK) to receive an Investor Presentation
Keep reading...Show less
Latest News
Latest Press Releases
Related News
TOP STOCKS
American Battery4.030.24
Aion Therapeutic0.10-0.01
Cybin Corp2.140.00