The Conversation (0)

TDG Gold Corp. (TSXV:TDG) (the "Company" or "TDG") is pleased to announce the results of diamond drillhole SH21-006 from its 2021 drill program at TDG's former producing high-grade gold-silver Shasta Mine located in the historical Toodoggone Production Corridor of north-central B.C. Highlights include 95.5 metres ("m") of 0.98 grams per tonne ("g/t") gold ("Au") and 29 g/t silver ("Ag") [1.35 g/t AuEq*] from 27.5-123.0 m depth (see Table 1).
As with TDG's recently published drillholes from the 2021 Shasta drill program (see TDG news releases January 04, 2022 and January 11, 2022), drillhole SH21-006 demonstrates continuity of grade and mineralization along with confirmation of grades of the surrounding historical holes and validation of the expected dimensions of mineralized zone in that section of Shasta (Figure 1). An oblique cross-section is presented in this news release that spans the Creek, JM and Upper Creek Zones (Figure 3).
Drillhole SH21-006 represents the most northerly hole drilled at the Shasta Creek Zone target in the 2021 drill program and spanned the northern portion of the Creek Zone across to the northern portion of JM Zone. The drillhole trace started approximately 150 m north of the Creek Pit and ending approximately 300 m north of the JM Pit (Figure 1). The purpose of SH21-006 was to step out to the north of 2021 drilling and infill between historical drillholes, including SH89-40, SH89-41, SH89-55 and SH89-56 (et al.), highlights from which include 37.0 m of 1.84 g/t Au and 106 g/t Ag [3.16 g/t AuEq*] in SH89-40; and 12.3 m of 1.60 g/t Au and 120 g/t Ag [3.10 g/t AuEq*] in SH89-55 (see Table 2 for historical drillhole highlights).
Table 1. Significant Results from Hole SH21-006.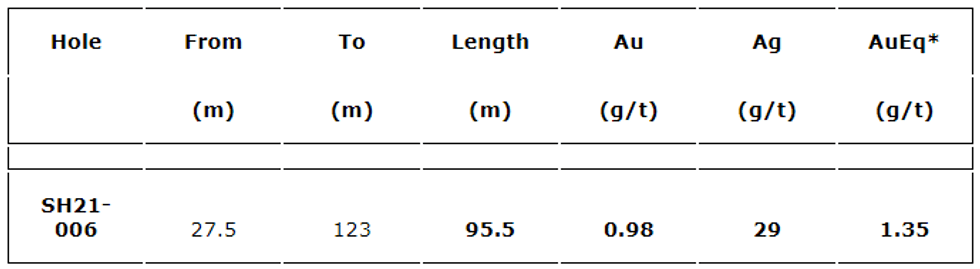
*Gold equivalent (AuEq) calculated using 80:1 silver to gold ratio.
** Intervals are core-length weighted. True width is estimated between 75 to 95 % of core length.
Drillhole SH21-006 intersected variably silicified, potassic-altered volcaniclastic rocks below the Shasta Fault (at 17.4 m) that carried a mineralized assemblage of dominantly pyrite and acanthite associated with quartz-carbonate veins, composite vein sets and breccias. Sulphide mineralization was identified as disseminated throughout and vein-vein selvage hosted Figure 2 presents the style and grade of typical mineralization encountered.
The northern portions of the Creek, JM and Upper Creek Zones represent areas for potential expansion of the Mineralized Target Zone at Shasta because historical drill holes in the vicinity neglected to sample near surface intervals and instead focused on visually identifying higher grades for assay in concert with typical cut-off grades at the time of mining (~ > 5 g/t Au). With further drilling, this area (Figure 1, and identified in Figure 3) has the opportunity to add minable tonnage to a Shasta resource (if defined) and decrease strip ratio in the vicinity as the closest historical underground workings are over 100 m to the west.
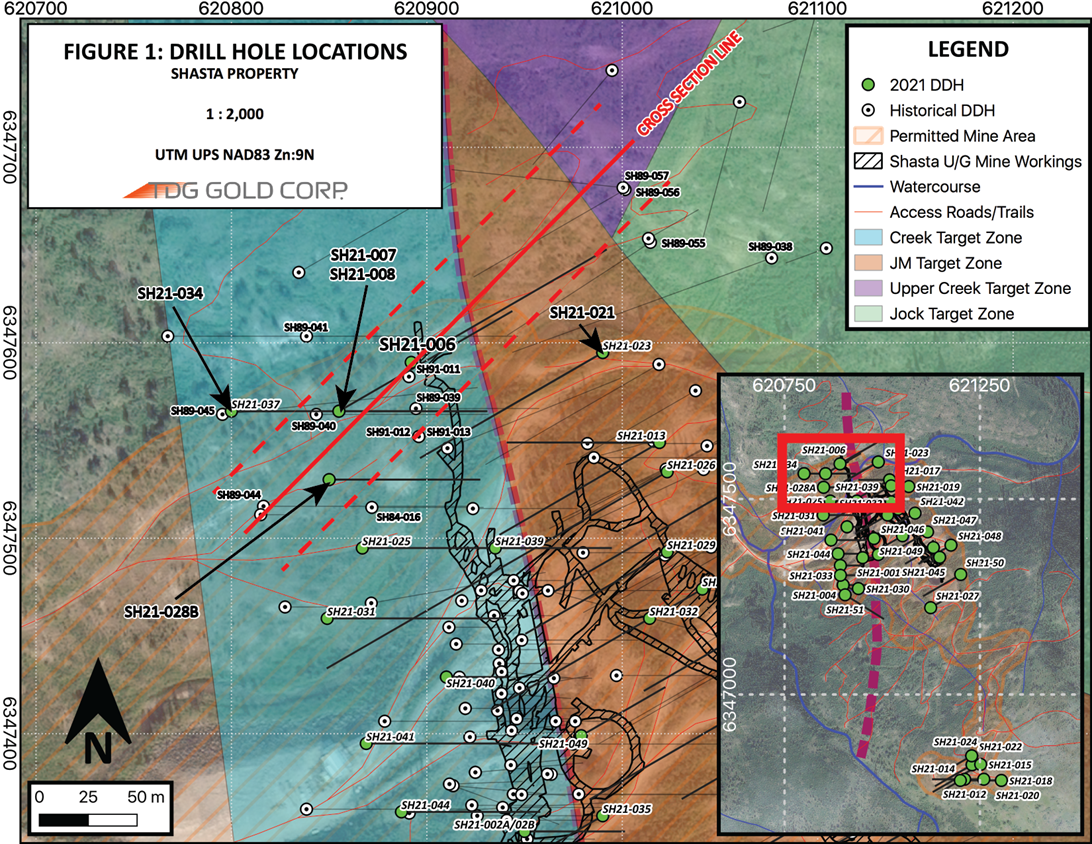
Figure 1. Plan view of the northern Shasta Creek Target Zone/JM Target Zone (Hole SH21-006).
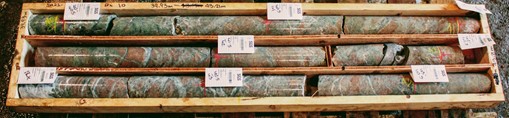
Figure 2. Shasta drillhole SH21-006; mineralization encountered grading 1.46 Au g/t, 69 g/t Ag [2.32 g/t AuEq*] from 43.5 m to 46.5 m depth.
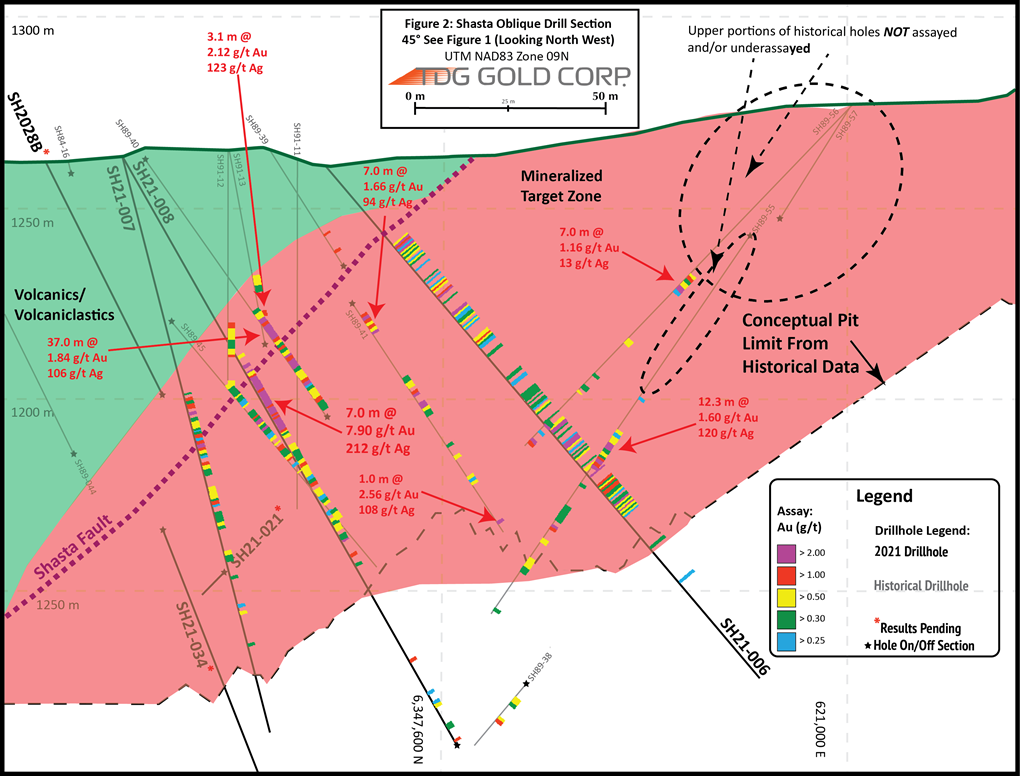 Figure 3. Oblique Cross Section of Shasta Creek/JM/Upper Creek Target Zone(s) (Hole SH21-006, and historical holes adjacent to 2021 drilling).
Table 2. Significant Results from Historical Holes Adjacent to SH21-006.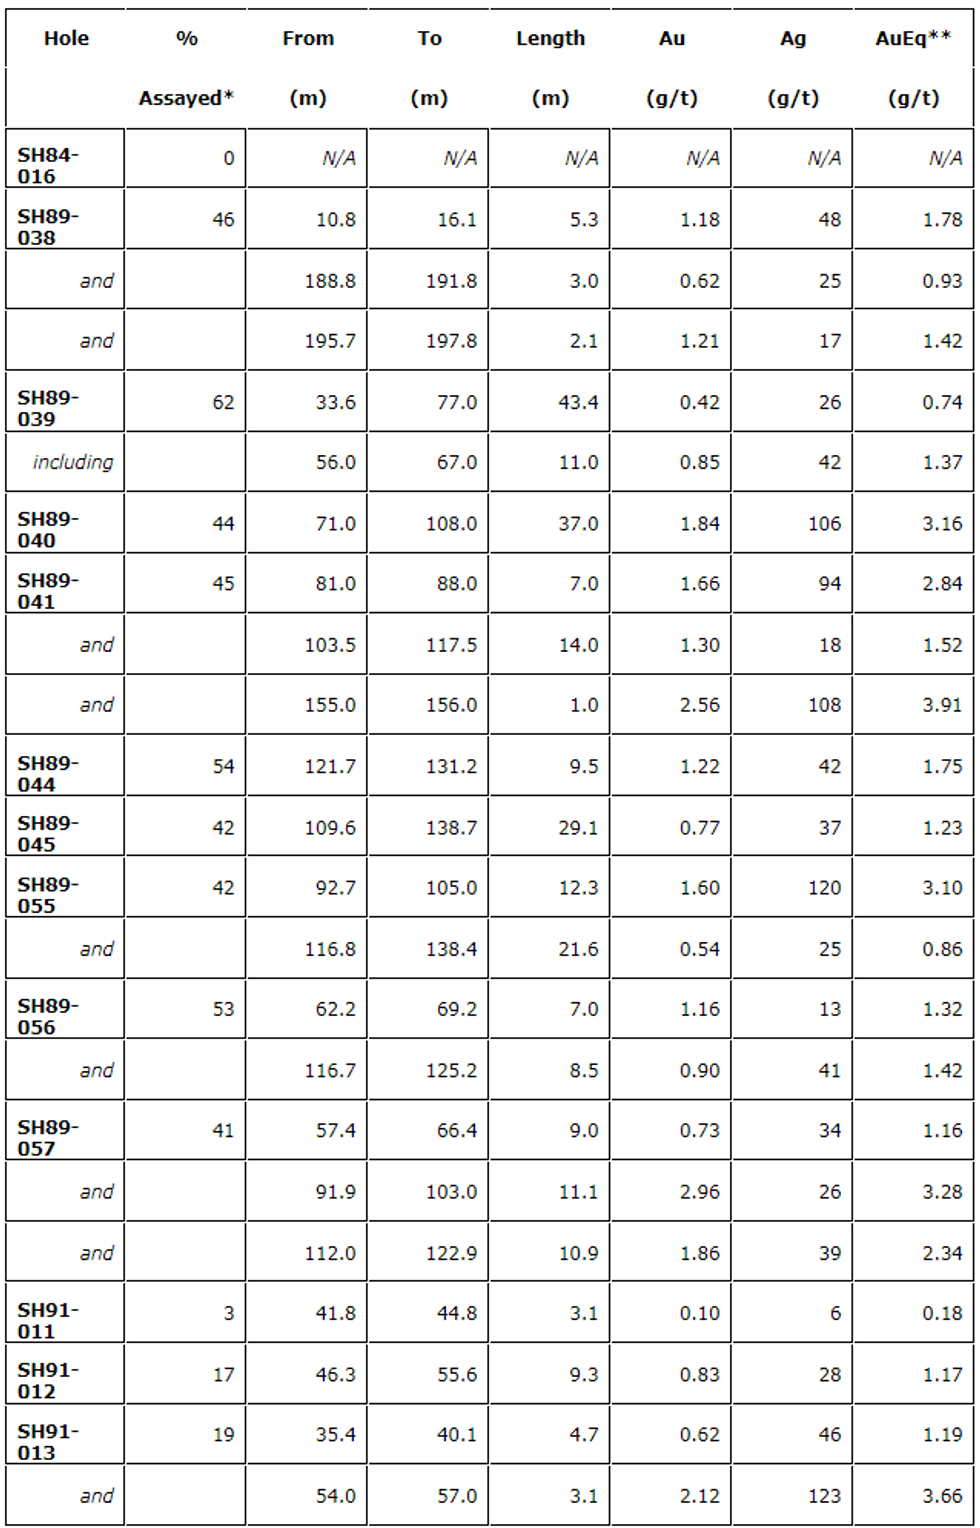
* "% Assayed" is the assayed portion of the drillhole in the historical database, compared to total drilled length
**Gold equivalent (AuEq) calculated using 80:1 silver to gold ratio.
** Intervals are core-length weighted. True width from historical core is unknown.
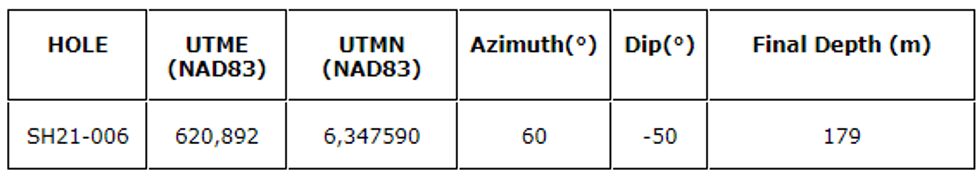
All 2021 drill holes are HQ sized drill cores. Particulars for drill holes (location, depth, etc.) are presented in Table 3. Assay results for remaining 2021 drillholes are still pending at this time.
Table 3. Drillhole particulars.
QA/QC
Samples for the Shasta 2021 drill program followed chain of custody between collection, processing and delivery to an SGS laboratory in Burnaby, B.C. The drill cores were delivered to the core shack at TDG's Baker Mine site, and processed by geologists who inserted certified reference materials, blanks and duplicates (pulp and coarse) into the sampling sequence. 2021 Drill core was cut in half (1/2 HQ core) and placed in zip-tied polyurethane bags, then in security-sealed rice bags before being delivered directly from the Baker Mine site, to Bandstra Transportation Systems in Prince George, B.C., and ultimately to SGS laboratory Burnaby, B.C. Core samples were prepared for analysis according to SGS method PRP89: dry samples to 105°C, crush to 75 % passing 2 mm, split 250 g, pulverize 85 % passing 75 microns. Samples were analyzed following procedures summarized in Table 4, where information about methodology can be found on the SGS Canada Website, in the analytical guide (here).
Table 4. Au and Ag Analytical Methods
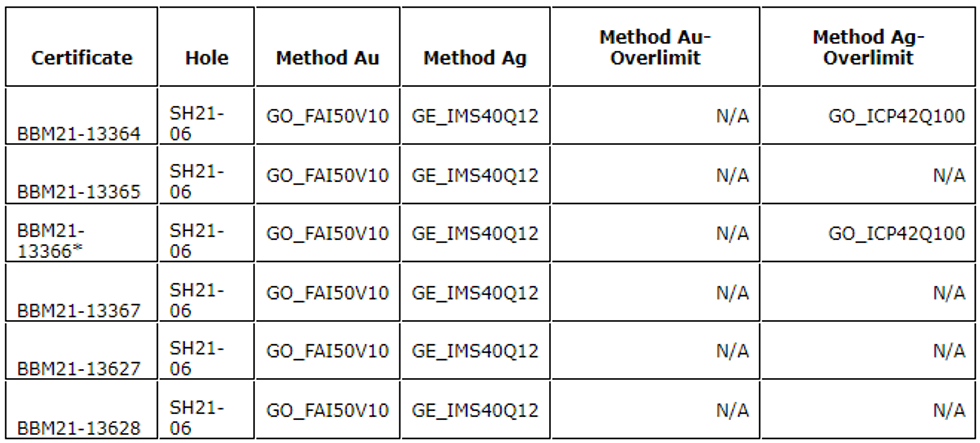
* Sample C00126417 returned > 1000 g/t Ag in over limit method GO_ICP42Q100, and is currently pending a second over limit using method GO_FAG37V. For purposes of this News Release, Sample C00126417 has been capped at 1000 g/t Ag, and is reflected in any calculations for composite interval purposes.
Quality assurance and control ("QAQC") is maintained internally at the lab through rigorous use of internal certified reference materials, blanks, and duplicates. An additional QAQC program was administered by TDG Gold through the use of certified reference materials ("CRMs"), duplicate samples and blank samples that were blindly inserted into the sample batch. If a QAQC sample returns an unacceptable value an investigation into the results is triggered and when deemed necessary, the samples that were tested in the batch with the failed QAQC sample are re-tested. For the purposes of this press release, results are ‘preliminary' and thus have not undergone TDG's comprehensive QAQC investigations.
Qualified Person
The technical content of this news release has been reviewed and approved by Steven Kramar, MSc., P.Geo., a qualified person as defined by National Instrument 43-101.
This news release includes historical drilling information that has been reviewed by the Company's geological team. The Company's review of the historical records and information reasonably substantiate the validity of the information presented in this news release; however, the Company cannot directly verify the accuracy of the historical data, including the procedures used for sample collection and analysis. Therefore, the Company encourages investors to exercise appropriate caution when evaluating these results. Further data review is underway, in order to verify the validity of the data for the anticipated NI 43-101 compliant mineral resource estimate.
About TDG Gold Corp.
TDG is a major mineral claim holder in the historical Toodoggone Production Corridor of north-central British Columbia, Canada, with over 23,000 hectares of brownfield and greenfield exploration opportunities under direct ownership or earn-in agreement. TDG's flagship projects are the former producing, high-grade gold-silver Shasta, Baker and Mets mines, which are all road accessible, produced intermittently between 1981-2012, and have over 65,000 m of historical drilling. In 2021, TDG has advanced the projects through compilation of historical data, new geological mapping, geochemical and geophysical surveys, and, for Shasta, drill testing of the known mineralization occurrences and their extensions. TDG currently has 78,361,085 common shares issued and outstanding.
ON BEHALF OF THE BOARD
Fletcher Morgan
Chief Executive Officer
For further information contact:
TDG Gold Corp.,
Telephone: +1.604.536.2711
Email: info@tdggold.com
Neither TSX Venture Exchange nor its Regulation Services Provider (as that term is defined in the policies of the TSX Venture Exchange) accepts responsibility for the adequacy or accuracy of this release.
This news release contains forward-looking statements that are based on the Company's current expectations and estimates. Forward-looking statements are frequently characterized by words such as "plan", "expect", "project", "intend", "believe", "anticipate", "estimate", "suggest", "indicate" and other similar words or statements that certain events or conditions "may" or "will" occur. Such forward-looking statements involve known and unknown risks, uncertainties and other factors that could cause actual events or results to differ materially from estimated or anticipated events or results implied or expressed in such forward-looking statements. Such factors include, among others: the actual results of current exploration activities; conclusions of economic evaluations; changes in project parameters as plans to continue to be refined; possible variations in ore grade or recovery rates; accidents, labour disputes and other risks of the mining industry; delays in obtaining governmental approvals or financing; and fluctuations in metal prices. There may be other factors that cause actions, events or results not to be as anticipated, estimated or intended. Any forward-looking statement speaks only as of the date on which it is made and, except as may be required by applicable securities laws, the Company disclaims any intent or obligation to update any forward-looking statement, whether as a result of new information, future events or results or otherwise. Forward-looking statements are not guarantees of future performance and accordingly undue reliance should not be put on such statements due to the inherent uncertainty therein.
Click here to connect with TDG Gold Corp. (TSXV:TDG) to receive an Investor Presentation