NextSource Materials Announces First Production of SuperFlake Graphite at Molo Mine in Madagascar

NextSource Materials Announces First Production of SuperFlake Graphite at Molo Mine in Madagascar

NextSource Materials Inc. (TSX:NEXT)(OTCQB:NSRCF) ("NextSource" or the "Company") is pleased to announce the first production of SuperFlake® graphite concentrate at its Molo mine in Madagascar

President and CEO, Craig Scherba, commented:

"First production of our SuperFlake® graphite is a significant achievement for NextSource and a testament to the dedication and hard work of our commissioning and operations teams, our employees and contractors, as well as the ongoing support that we have received from the local community and government. As we ramp up the production stage of operations, the Company is in the enviable position of transitioning into a significant and sustainable global producer of high-quality graphite and anode material just as demand for their use in lithium-ion batteries is growing exponentially."

NextSource Materials Inc., Thursday, June 22, 2023, Press release picture
Molo mine workforce alongside first tonne of SuperFlake® graphite concentrate

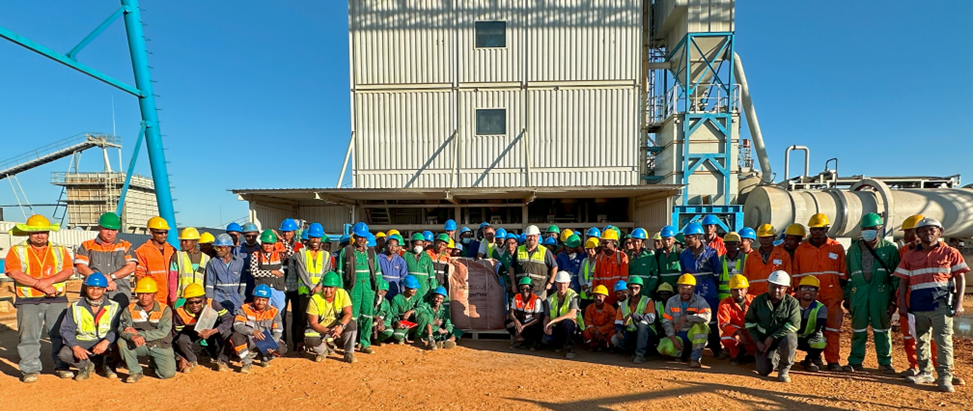
As part of the commissioning and optimization of the processing plant, the commissioning sequence was prioritized for initial production of coarse flake concentrate, with the first tonne of production consisting of +48 mesh (jumbo size) SuperFlake® graphite.

Since initiation of plant commissioning on March 23, 2023, the commissioning and operations teams have progressed methodically through debottlenecking and optimization activities. The operations team will now shift their focus to ramping up the plant throughput to its nameplate capacity of 17,000 tonnes per annum.

The Company expects to sell all the flake graphite produced at the Molo Graphite Mine to key customers under existing offtake agreements, which includes Germany's thyssenkrupp Materials Trading GmbH and the Company's Japanese technical partner, whom is the main supplier of value-added graphite to Japan's largest anode processor that in turn supplies multiple Japanese and international OEMs with graphite anode material.

The Company continues to be engaged in advanced discussions with several major EV companies (OEMs) and has received requests for multi-tonne samples of battery anode material as part of the OEMs qualification process. As such, the Company will begin sending flake graphite qualifying material to its Battery Anode Facility (BAF) technical partners for conversion into coated, spheronized, purified graphite ("CSPG"), which is the final form of anode material that is assembled along with cathode material into finished lithium-ion batteries used in electric vehicle ("EV") applications.

Mauritius Battery Anode Facility and Global BAF Strategy

The Company announced on February 28, 2023 its strategy for the staged buildout of a series of BAFs in key geographic locations. The BAFs are value-added processing facilities that convert flake graphite into CSPG.

BAF Strategy Highlights:

  • Plans to construct multiple BAFs capable of producing CSPG anode material for use in lithium-ion batteries for EV applications in key jurisdictions. The BAF designs will leverage the Company's exclusive partnership with two leading value-added graphite processors and use their proprietary and well-established graphite anode processing technology, which currently produces CSPG for the supply chains of major OEMs, including Tesla and Toyota.
  • The first BAF will be in Mauritius (the "Mauritius BAF"), which was selected due to its proximity to the Molo Graphite Mine in Madagascar and its position on strategic shipping routes to Asian markets.
  • A long-term industrial lease has been signed to build the Mauritius BAF within an exisiting industrial facility in Port Louis, Mauritius. The BAF site location is also classified as an Industrial Freeport, with a 3% corporate tax rate and 0% VAT.
  • A technical study for the Mauritius BAF with an initial production capacity of 3,600 tpa (Line 1) of CSPG (the "Mauritius BAF Technical Study") dated February 28, 2023 estimated initial capital costs and working capital investments of US$32.8 million and annual revenues at US$33.7 million with an EBITDA of US$13.2 million. The resulting post-tax economic results demonstrated an NPV of US$106.9 million using an 8% discount rate, an IRR of 42.7% and a payback of 2.2 years.
  • Adding 3 additional lines (Lines 2,3,4) to the Mauritius BAF for a total capacity of 14,400 tpa of CSPG demonstrated a total post-tax NPV8% of US$439.7m, incremental capex US$74m, IRR of 45.8%
  • Subject to obtaining necessary funding, completion of the front-end engineering and design (FEED) study, and completion of the environmental and social impact assessment (ESIA) process, the Company is targeting the start of a 12-month construction process in Q3 2023 resulting in potential initial production at the Mauritius BAF in Q3 2024.
  • Evaluation of the potential construction of a BAF in North America and initiation of the application process to access various financial loans and grants offered under Canadian federal and provincial programs and under the U.S. Inflation Reduction Act.
  • Evaluation of the potential construction of a BAF in the United Kingdom (UK) and initiation of the application process to access various financial loans and grants offered under the UK Government Automotive Transformation Fund.
  • Evaluation of the potential construction of a BAF in the European Union.
  • Evaluation and potential construction of an artificial graphite (AG) production facility, which would enable the Company to supply AG anode material along with natural flake-based anode material.

About NextSource Materials Inc.

NextSource Materials Inc. is a battery materials development company based in Toronto, Canada that is intent on becoming a vertically integrated global supplier of battery materials through the mining and value-added processing of graphite and other minerals.

The Company's Molo graphite project in Madagascar is one of the largest known and highest-quality graphite resources globally, and the only one with SuperFlake® graphite. The Molo mine has begun production, with Phase 1 mine operations currently being optimized to reach its nameplate production capacity of 17,000 tpa of graphite concentrate.

The Company is also developing a significant downstream graphite value-add business through the staged rollout of Battery Anode Facilities capable of large-scale production of coated, spheronized and purified graphite for direct delivery to battery and automotive customers, outside of existing Asian supply chains, in a fully transparent and traceable manner. The first of its Battery Anode Facilities will be located in Mauritius with initial production targeted in Q3 2024.

NextSource Materials is listed on the Toronto Stock Exchange (TSX) under the symbol "NEXT" and on the OTCQB under the symbol "NSRCF".

For further information about NextSource visit our website at www.nextsourcematerials.com or contact us at +1.416.364.4911 or email Brent Nykoliation, Executive Vice President at brent@nextsourcematerials.com or Craig Scherba, President & CEO at craig@nextsourcematerials.com.

Safe Harbour: This press release contains statements that may constitute "forward-looking information" or "forward-looking statements" within the meaning of applicable Canadian and United States securities legislation. Readers are cautioned not to place undue reliance on forward-looking information or statements. Forward looking statements and information are frequently characterized by words such as "plan", "expect", "project", "intend", "believe", "anticipate", "estimate", "potential", "possible" and other similar words, or statements that certain events or conditions "may", "will", "could", or "should" occur. Forward-looking statements include any statements regarding, among others, timing of, and completion of, commissioning the processing plant, construction of the Solar Hybrid Battery System, and commissioning of the Molo mine, timing of construction and completion of the Mauritius BAF and proposed timing of future locations of additional BAFs, timing and completion of front-end engineering and design and ESIA permitting, the economic results of the BAF Technical Study including capital costs estimates, operating costs estimates, payback, NPV, IRR, production, sales pricing and working capital estimates, the construction and potential expansion of the BAFs, expansion plans, as well as the Company's intent on becoming a fully integrated global supplier of critical battery and technology materials. These statements are based on current expectations, estimates and assumptions that involve several risks, which could cause actual results to vary and, in some instances, to differ materially from those anticipated by the Company and described in the forward-looking statements contained in this press release. No assurance can be given that any of the events anticipated by the forward-looking statements will transpire or occur or, if any of them do so, what benefits the Company will derive there from. The forward-looking statements contained in this news release are made as at the date of this news release and the Company does not undertake any obligation to update publicly or to revise any of the forward-looking statements, whether because of new information, future events or otherwise, except as may be required by applicable securities laws. Although the forward-looking statements contained in this news release are based on what management believes are reasonable assumptions, the Company cannot assure investors that actual results will be consistent with them. These forward-looking statements are made as of the date of this news release and are expressly qualified in their entirety by this cautionary statement. Subject to applicable securities laws, the Company does not assume any obligation to update or revise the forward-looking statements contained herein to reflect events or circumstances occurring after the date of this news release.

SOURCE: NextSource Materials Inc.


View source version on accesswire.com:
https://www.accesswire.com/762947/NextSource-Materials-Announces-First-Production-of-SuperFlakeR-Graphite-at-Molo-Mine-in-Madagascar

News Provided by ACCESSWIRE via QuoteMedia

NEXT:CA
NextSource Materials

NextSource Materials Investor Kit

  • Corporate info
  • Insights
  • Growth strategies
  • Upcoming projects

GET YOUR FREE INVESTOR KIT

The Conversation (0)
NextSource Materials

NextSource Materials


Keep reading...Show less

Molo Graphite Mine now in Production with Downstream Battery Anode Facility Not Far Behind

NextSource Materials Announces Results of 2024 Annual Meeting of Shareholders

NextSource Materials Announces Results of 2024 Annual Meeting of Shareholders

NextSource Materials Inc. (TSX:NEXT)(OTCQB:NSRCF) ("NextSource" or the "Company") is pleased to announce the results of the Annual Meeting of Shareholders of the Company (the "Meeting") held virtually at 9:00 AM (Toronto time) on December 5, 2024

AGM Results
The final voting results of the Meeting are set out below:

News Provided by ACCESSWIRE via QuoteMedia

Keep reading...Show less
NextSource Materials Closes Final Tranche of Private Placement for Additional Gross Proceeds of CAD$720,800

NextSource Materials Closes Final Tranche of Private Placement for Additional Gross Proceeds of CAD$720,800

Not for distribution to U.S. news wire services or for dissemination in the United States or to a U.S. Person.

NextSource Materials Inc. (TSX:NEXT)(OTCQB:NSRCF) ("NextSource" or the "Company") announces it has closed a second and final tranche of its previously announced non-brokered private placement offering, issuing an additional 1,360,000 common shares of the Company ("Shares") at a price of CAD$0.53 per Share for aggregate gross proceeds of CAD$720,800 (the "Offering

News Provided by ACCESSWIRE via QuoteMedia

Keep reading...Show less
NextSource Materials Welcomes New President and CEO Hanré Rossouw to Deliver Next Phase of Growth

NextSource Materials Welcomes New President and CEO Hanré Rossouw to Deliver Next Phase of Growth

NextSource Materials Inc. (TSX:NEXT)(OTCQB:NSRCF) ("NextSource" or the "Company") confirms, further to the announcement on 28th May 2024, Hanré Rossouw has officially begun his role as President and CEO. His tenure begins in Madagascar, where he will visit the Molo graphite mine operations as well as engage with the community and government as part of a structured leadership transition plan

Also effective today, the former President and CEO, Craig Scherba, will continue as a Director and transition to the newly created role of Chief Development Officer to focus on developing strategy, managing offtake negotiations and expanding the Company's OEM relationships globally.

News Provided by ACCESSWIRE via QuoteMedia

Keep reading...Show less
NextSource Materials Completes First Commercial Shipments of Graphite Concentrate to Germany and USA

NextSource Materials Completes First Commercial Shipments of Graphite Concentrate to Germany and USA

NextSource Materials Inc. (TSX:NEXT)(OTCQB:NSRCF) ("NextSource" or "the Company") is pleased to announce it has completed its first commercial shipments of SuperFlake® graphite concentrate from its Molo Graphite Mine (the "Molo mine") in southern Madagascar

Full container loads of high-quality, coarse flake graphite concentrate were exported from the Port of Tulear, Madagascar to Germany and to the United States of America (USA) under existing offtake agreements. These initial container shipments of SuperFlake® graphite are destined for key demand markets for higher value graphite products, including refractory materials and graphite foils for consumer electronics and fire-retardant applications.

News Provided by ACCESSWIRE via QuoteMedia

Keep reading...Show less
NextSource Materials Closes Private Placement for Gross Proceeds of CAD$14.7 Million

NextSource Materials Closes Private Placement for Gross Proceeds of CAD$14.7 Million

Not for distribution to U.S. news wire services or for dissemination in the United States or to a U.S. Person.

NextSource Materials Inc. (TSX:NEXT)(OTCQB:NSRCF) ("NextSource" or the "Company") announces it has closed a non-brokered private placement offering of 27,728,100 common shares of the Company ("Shares") at a price of CAD$0.53 per Share for aggregate gross proceeds of CAD$14,695,893 (the "Offering

News Provided by ACCESSWIRE via QuoteMedia

Keep reading...Show less
SAGA Metals Announces Non-Brokered Private Placement and Provides Corporate Update

SAGA Metals Announces Non-Brokered Private Placement and Provides Corporate Update

NOT FOR DISTRIBUTION TO U.S. NEWS WIRE SERVICES OR FOR DISSEMINATION IN THE UNITED STATES.

Saga Metals Corp. (the "Company" or "SAGA") (TSXV: SAGA) (OTCQB: SAGMF) (FSE: 20H) a North American exploration company focused on critical mineral discovery in Canada, is pleased to announce that it intends to complete a financing by way of a non-brokered private placement for aggregate gross proceeds of C$2,500,000 comprised of: (i) 2,500,000 flow-through common share units of the Company (the " FT Units ") at C$0.30 per FT Unit for gross proceeds of C$750,000, and, (ii) 7,000,000 hard dollar common share units of the Company (the " HD Units ", and together with the FT Units, the " Securities ") at C$0.25 per HD Unit for gross proceeds of C$1,750,000 (collectively, the " Offering ").

News Provided by GlobeNewswire via QuoteMedia

Keep reading...Show less
Aben Minerals Ltd. Receives Name Change Approval to Aben Gold Corp.

Aben Minerals Ltd. Receives Name Change Approval to Aben Gold Corp.

Aben Minerals Ltd. (TSX-V: ABM ) (OTCQB: ABNAF ) (Frankfurt: R26 ) ("Aben" or "the Company") announces change of name to Aben Gold Corp ., effective at market open on Tuesday, May 6, 2025, as approved by the TSX Venture Exchange.

News Provided by GlobeNewswire via QuoteMedia

Keep reading...Show less
International Lithium Announces Upsize and Extension of Private Placement

International Lithium Announces Upsize and Extension of Private Placement

International Lithium Corp. (TSXV: ILC) (OTCQB: ILHMF) (FSE: IAH) (the "Company" or "ILC") is pleased to announce that it is increasing the size of its non-brokered private placement financing (the "Offering") from $600,000 to $855,000 and extending the closing of the Offering to May 30, 2025. The Offering was originally announced on February 5, 2025. The upsized Offering is comprised of up to 57,000,000 common shares of the Company at a price of $0.015 per share for gross proceeds of up to $855,000.

On March 31, 2025, the Company closed the first tranche the Offering and issued 23,666,666 common shares at $0.015 per share for proceeds of $355,000. The proposed payments from the first tranche proceeds included $183,600 to pay the outstanding fees to non-arm's length creditors.

News Provided by Newsfile via QuoteMedia

Keep reading...Show less
American Salars Signs Letter Of Intent To Acquire Cauchari Lithium Brine Project, Argentina

American Salars Signs Letter Of Intent To Acquire Cauchari Lithium Brine Project, Argentina

(TheNewswire)

American Salars Lithium Inc

VANCOUVER, BC MAY 1 st 2025 TheNewswire - American Salars Lithium Inc. ("AMERICAN SALARS" OR THE "COMPANY") (CSE: USLI, OTC: USLIF, FWB: Z3P, WKN: A3E2NY ) announces it has signed a Letter of Intent ("LOI") with an arms length Vendor to acquire a 100% interest in the Cauchari Minas Ines 01 Lithium Salar Project ("Cauchari" or  "Project"), located o n the south end of the Cauchari Salt Lake, Department Los Andes in the Province of Salta, Argentina.

News Provided by TheNewsWire via QuoteMedia

Keep reading...Show less
Albemarle Reports First Quarter 2025 Results

Albemarle Reports First Quarter 2025 Results

Albemarle Corporation (NYSE: ALB), a global leader in providing essential elements for mobility, energy, connectivity and health, today announced its results for the first quarter ended March 31, 2025 .

Albemarle Corp. Logo. (PRNewsFoto/Albemarle Corporation)

First-Quarter   2025 and Recent Highlights
(Unless otherwise stated, all percentage changes represent year-over-year comparisons)

  • Net sales of $1.1 billion , with double-digit volume growth in Specialties (+11%) and record Energy Storage lithium salt production from the company's integrated conversion network
  • Net income of $41 million , or ($0.00) per diluted share attributable to common shareholders; adjusted diluted loss per share attributable to common shareholders of ($0.18)
  • Adjusted EBITDA of $267 million ; year-over-year gains in Specialties (+30%) and Ketjen (+76%)
  • Cash from operations of $545 million , which included a $350 million customer prepayment; excluding the prepayment, operating cash flow conversion (a) was 73%; line of sight to breakeven free cash flow assuming current lithium market pricing
  • Through April, achieved approximately 90% run-rate against midpoint $350 million cost and productivity improvement target; identified opportunities to reach high-end of the $300 to $400 million range
  • Maintaining full-year 2025 outlook considerations, including ranges based on recently observed lithium market price scenarios; ranges include the anticipated direct impact of tariffs announced as of April 29, 2025

(a)   Defined as Operating Cash Flow divided by Adj. EBITDA, which is a non-GAAP measure. See Non-GAAP Reconciliations for further details.

"Our business continues to perform in line with our outlook considerations, including first-quarter adjusted EBITDA of $267 million with strong year-over-year improvements in Specialties and Ketjen," said Kent Masters , Chairman and CEO. "We continue to focus on what we can control - taking decisive actions to reduce costs, optimize our lithium conversion network and increase efficiencies to preserve our long-term competitive position. While the full economic impact of the recently announced tariffs and other global trade actions is unclear, we benefit from our global footprint and the current exemptions for critical minerals; as a result, we are maintaining our full year 2025 outlook considerations."

First Quarter 2025 Results

In millions, except per share amounts

Q1 2025


Q1 2024


$ Change


% Change

Net sales

$    1,076.9


$    1,360.7


$      (283.9)


(20.9) %

Net income attributable to Albemarle Corporation

$         41.3


$           2.4


$         38.9


1,620.8 %

Adjusted EBITDA (a)

$       267.1


$       291.2


$       (24.1)


(8.3) %

Diluted loss per share attributable to common
shareholders

$       (0.00)


$       (0.08)


$         0.08


(100.0) %

Non-recurring and other unusual items (a)

(0.18)


0.34


Adjusted diluted (loss) earnings per share attributable
to common shareholders (a)(b)

$       (0.18)


$         0.26


$       (0.44)


(169.2) %


(a)    See Non-GAAP Reconciliations for further details.

(b)    Totals may not add due to rounding.

Net sales for the first quarter of 2025 were $1.1 billion compared to $1.4 billion for the prior-year quarter, a decline of 21% driven primarily by lower pricing in Energy Storage, partially offset by higher volumes in Specialties (+11%). Adjusted EBITDA of $267 million declined by $24 million from the prior-year quarter as lower net sales were mostly offset by lower average input costs and on-going cost reduction efforts. Net income attributable to Albemarle of $41 million increased year-over-year by $39 million .

The effective income tax rate for the first quarter of 2025 was 21.0% compared to 2.2% in the same period of 2024. On an adjusted basis, the effective income tax rates were (42.8)% and (12.4)% for the first quarters of 2025 and 2024, respectively, with the decrease primarily due to changes in geographic income mix and the impact of tax valuation allowances in Australia and China.

Energy Storage Results

In millions

Q1 2025


Q1 2024


$ Change


% Change

Net Sales

$           524.6


$           800.9


$          (276.3)


(34.5) %

Adjusted EBITDA

$           186.4


$           198.0


$           (11.6)


(5.9) %

Energy Storage net sales for the first quarter of 2025 were $525 million , a decrease of $276 million , or 35%, due to lower pricing (-34%). Volumes were flat as record production at our integrated conversion network offset reduced tolling volumes. Adjusted EBITDA of $186 million decreased $12 million , as lower net sales were mostly offset by lower average input costs and on-going cost reduction efforts.

Specialties Results

In millions

Q1 2025


Q1 2024


$ Change


% Change

Net Sales

$           321.0


$           316.1


$               4.9


1.6 %

Adjusted EBITDA

$             58.7


$             45.2


$             13.5


29.8 %

Specialties net sales for the first quarter of 2025 were $321 million , an increase of $5 million , or 2%, primarily due to higher volumes (+11%), which more than offset lower prices (-8%). Adjusted EBITDA of $59 million increased $13 million versus the year-ago quarter due to higher sales volumes and decreased manufacturing costs related to productivity initiatives.

Ketjen Results

In millions

Q1 2025


Q1 2024


$ Change


% Change

Net Sales

$           231.3


$           243.8


$           (12.5)


(5.1) %

Adjusted EBITDA

$             38.6


$             22.0


$             16.6


75.6 %

Ketjen net sales for the first quarter of 2025 were $231 million , down 5% compared to the prior-year quarter as higher prices (+4%) were more than offset by lower volumes (-8%), primarily due to the timing of sales, offset by favorable pricing due to product mix. Adjusted EBITDA of $39 million increased $17 million , driven by favorable product mix and higher equity income from joint ventures.

2025 Outlook Considerations

Total Corporate Outlook Considerations are Unchanged
The table below reflects expected outcomes for the total company based on recently observed lithium market price scenarios, unchanged from the prior quarter. Ranges include the anticipated direct impact of announced tariffs as of April 29, 2025 . Ranges are based on variation in sales volume and mix, including a projected increase in Energy Storage volumes of 0% to 10% in 2025 compared to 2024. All three scenarios assume flat market pricing flowing through Energy Storage's current contract book. Scenarios also assume spodumene pricing averages 10% of the lithium carbonate equivalent (LCE) price, while other costs are assumed to be constant.


Total Corporate FY 2025E

Including Energy Storage Scenarios

Observed market price case (a)

YE 2024

H1 2024 range

Q4 2023 average

Average lithium market price ($/kg LCE) (a)

~$9

$12-15

~$20

Net sales

$4.9 - $5.2 billion

$5.3 - $6.1 billion

$6.5 - $7.0 billion

Adjusted EBITDA (b)

$0.8 - $1.0 billion

$1.2 - $1.8 billion

$2.5 - $2.7 billion


(a)

Price represents blend of relevant market pricing including spot and regional indices for the periods referenced.

(b)

The company does not provide a reconciliation of forward-looking non-GAAP financial measures to the most directly comparable financial measures calculated and reported in accordance with GAAP, as the company is unable to estimate significant non-recurring or unusual items without unreasonable effort. See "Additional information regarding Non-GAAP Measures" for more information.

Energy Storage Market Price Scenarios


Energy Storage FY 2025E

Observed market price case (a)

YE 2024

H1 2024 range

Q4 2023 average

Average lithium market price ($/kg LCE) (a)

~$9

$12-15

~$20

Net sales

$2.5 - $2.6 billion

$2.9 - $3.5 billion

$4.2 - $4.5 billion

Adjusted EBITDA

$0.6 - $0.7 billion

$1.0 - $1.5 billion

$2.2 - $2.4 billion

Equity in net income of unconsolidated investments
(net of tax) (b)

$0.2 - $0.3 billion

$0.3 - $0.5 billion

$0.6 - $0.7 billion


(a)

Price represents blend of relevant market pricing including spot and regional indices for the periods referenced.

(b)

Included in adjusted EBITDA on a pre-tax basis.

Specialties and Ketjen Outlook Considerations
Specialties outlook reflects modest volume growth in key end markets led by pharma, automotive, and oilfield, partially offset by weakness in building and construction.

Ketjen outlook assumes favorable product revenue mix, lower input costs and the continuation of its turnaround plan execution.


Segment FY 2025E

Specialties net sales

$1.3 - $1.5 billion

Specialties adjusted EBITDA

$210 - $280 million

Ketjen net sales

$1.0 - $1.1 billion

Ketjen adjusted EBITDA

$120 - $150 million

Other Corporate Outlook Considerations
Albemarle expects its 2025 capital expenditures to be in the range of $700 million to $800 million , down more than 50% from $1.7 billion in 2024. This level of spending reflects a prioritization on sustaining existing assets and resources, with the remainder allocated to select growth projects and high-return, quick payback improvements.


Other Corporate FY 2025E

Capital expenditures

$700 - $800 million

Depreciation and amortization

$630 - $670 million

Adjusted effective tax rate (a)

(40%) - 25%

Corporate costs (b)

$70 - $100 million

Interest and financing expenses

$180 - $210 million

Weighted-average common shares outstanding (diluted)

118 million


(a)    Adjusted effective tax rate dependent on lithium market prices and geographic income mix

(b)    FY 2025E outlook includes FX impact year to date

Cash Flow and Capital Deployment
Cash from operations of $545 million increased $447 million compared to the prior-year period. A customer prepayment received in January and improved working capital more than offset lower adjusted EBITDA and reduced dividends received from equity investments. Capital expenditures of $183 million decreased by $397 million versus the prior-year period, reflecting the impact of decisions that stopped or slowed spending and the completion of capacity expansions in Energy Storage and Specialties.

Balance Sheet and Liquidity
As of March 31, 2025, Albemarle had estimated liquidity of approximately $3.1 billion , including $1.5 billion of cash and cash equivalents, $1.5 billion available under its revolver and $106 million available under other credit lines. Total debt was $3.5 billion , representing a debt covenant net debt to adjusted EBITDA ratio of approximately 2.4 times.

Earnings Call

Date:

Thurs., May 1, 2025

Time:

8:00 AM Eastern time

Dial-in (U.S.):

1-800-590-8290

Dial-in (International):

1-240-690-8800

Conference ID:

ALBQ1

The company's earnings presentation and supporting material are available on Albemarle's website at https://investors.albemarle.com .

About Albemarle
Albemarle Corporation (NYSE: ALB) is a global leader in transforming essential resources into critical ingredients for mobility, energy, connectivity, and health. We partner to pioneer new ways to move, power, connect and protect with people and planet in mind. A reliable and high-quality global supply of lithium and bromine allow us to deliver advanced solutions for our customers. Learn more about how the people of Albemarle are enabling a more resilient world at albemarle.com and on X (formerly Twitter) @AlbemarleCorp.

Albemarle regularly posts information to www.albemarle.com , including notification of events, news, financial performance, investor presentations and webcasts, non-GAAP reconciliations, Securities and Exchange Commission ("SEC") filings and other information regarding the company, its businesses and the markets it serves.

Forward-Looking Statements
This press release contains statements concerning our expectations, anticipations and beliefs regarding the future, which constitute "forward-looking statements" within the meaning of the Private Securities Litigation Reform Act of 1995. These forward-looking statements, which are based on assumptions that we have made as of the date hereof and are subject to known and unknown risks and uncertainties, often contain words such as "anticipate," "believe," "estimate," "expect," "guidance," "intend," "may," "outlook," "scenario," "should," "would," and "will". Forward-looking statements may include statements regarding: our 2025 company and segment outlooks, including expected market pricing of lithium and spodumene and other underlying assumptions and outlook considerations; expected capital expenditure amounts and the corresponding impact on cash flow; expected impact of tariffs and other trade restrictions; market pricing of lithium carbonate equivalent and spodumene; plans and expectations regarding other projects and activities, cost reductions and accounting charges, and all other information relating to matters that are not historical facts. Factors that could cause Albemarle's actual results to differ materially from the outlook expressed or implied in any forward-looking statement include: changes in economic and business conditions; changes in trade policies and tariffs; financial and operating performance of customers; timing and magnitude of customer orders; fluctuations in lithium market prices; production volume shortfalls; increased competition; changes in product demand; availability and cost of raw materials and energy; technological change and development; fluctuations in foreign currencies; changes in laws and government regulation; regulatory actions, proceedings, claims or litigation; cyber-security breaches, terrorist attacks, industrial accidents or natural disasters; geopolitical conflicts and political unrest; trade policies and tariffs; changes in inflation or interest rates; volatility in the debt and equity markets; acquisition and divestiture transactions; timing and success of projects; performance of Albemarle's partners in joint ventures and other projects; changes in credit ratings; and the other factors detailed from time to time in the reports Albemarle files with the SEC, including those described under "Risk Factors" in Albemarle's most recent Annual Report on Form 10-K and any subsequently filed Quarterly Reports on Form 10-Q, which are filed with the SEC and available on the investor section of Albemarle's website (investors.albemarle.com) and on the SEC's website at www.sec.gov . These forward-looking statements speak only as of the date of this press release. Albemarle assumes no obligation to provide any revisions to any forward-looking statements should circumstances change, except as otherwise required by securities and other applicable laws.

Albemarle Corporation and Subsidiaries
Consolidated Statements of Income
(In Thousands Except Per Share Amounts) (Unaudited)


Three Months Ended


March 31,


2025


2024

Net sales

$ 1,076,881


$ 1,360,736

Cost of goods sold

920,582


1,321,798

Gross profit

156,299


38,938

Selling, general and administrative expenses

123,502


161,376

Restructuring charges and asset write-offs

(1,063)


33,536

Research and development expenses

14,099


23,532

Operating profit (loss)

19,761


(179,506)

Interest and financing expenses

(48,977)


(37,969)

Other income, net

10,250


49,901

Loss before income taxes and equity in net income of unconsolidated investments

(18,966)


(167,574)

Income tax benefit

(3,978)


(3,721)

Loss before equity in net income of unconsolidated investments

(14,988)


(163,853)

Equity in net income of unconsolidated investments (net of tax)

64,286


180,500

Net income

49,298


16,647

Net income attributable to noncontrolling interests

(7,950)


(14,199)

Net income attributable to Albemarle Corporation

41,348


2,448

Mandatory convertible preferred stock dividends

(41,688)


(11,584)

Net loss attributable to Albemarle Corporation common shareholders

$         (340)


$      (9,136)

Basic loss per share attributable to common shareholders

$        (0.00)


$        (0.08)

Diluted loss per share attributable to common shareholders

$        (0.00)


$        (0.08)


Weighted-average common shares outstanding – basic

117,603


117,451

Weighted-average common shares outstanding – diluted

117,603


117,451

Albemarle Corporation and Subsidiaries
Condensed Consolidated Balance Sheets
(In Thousands) (Unaudited)


March 31,


December 31,


2025


2024

ASSETS


Current assets:


Cash and cash equivalents

$        1,518,511


$        1,192,230

Trade accounts receivable

670,775


742,201

Other accounts receivable

137,080


238,384

Inventories

1,656,365


1,502,531

Other current assets

124,551


166,916

Total current assets

4,107,282


3,842,262

Property, plant and equipment

12,660,018


12,523,368

Less accumulated depreciation and amortization

3,356,979


3,191,898

Net property, plant and equipment

9,303,039


9,331,470

Investments

1,124,777


1,117,739

Other assets

628,277


504,711

Goodwill

1,606,144


1,582,714

Other intangibles, net of amortization

229,739


230,753

Total assets

$      16,999,258


$      16,609,649

LIABILITIES AND EQUITY


Current liabilities:


Accounts payable to third parties

$           778,658


$           793,455

Accounts payable to related parties

139,296


150,432

Accrued expenses

379,871


467,997

Current portion of long-term debt

410,477


398,023

Dividends payable

61,312


61,282

Income taxes payable

174,779


95,275

Total current liabilities

1,944,393


1,966,464

Long-term debt

3,128,655


3,118,142

Postretirement benefits

31,908


31,930

Pension benefits

115,846


116,192

Other noncurrent liabilities

1,125,943


819,204

Deferred income taxes

378,171


358,029

Commitments and contingencies


Equity:


Albemarle Corporation shareholders' equity:


Common stock

1,177


1,176

Mandatory convertible preferred stock

2,235,105


2,235,105

Additional paid-in capital

2,991,389


2,985,606

Accumulated other comprehensive loss

(633,136)


(742,062)

Retained earnings

5,433,704


5,481,692

Total Albemarle Corporation shareholders' equity

10,028,239


9,961,517

Noncontrolling interests

246,103


238,171

Total equity

10,274,342


10,199,688

Total liabilities and equity

$      16,999,258


$      16,609,649

Albemarle Corporation and Subsidiaries
Selected Consolidated Cash Flow Data
(In Thousands) (Unaudited)


Three Months Ended

March 31,


2025


2024

Cash and cash equivalents at beginning of year

$   1,192,230


$      889,900

Cash flows from operating activities:


Net income

49,298


16,647

Adjustments to reconcile net income to cash flows from operating activities:


Depreciation and amortization

161,754


123,751

Stock-based compensation and other

6,966


9,317

Equity in net income of unconsolidated investments (net of tax)

(64,286)


(180,500)

Dividends received from unconsolidated investments and nonmarketable
securities

60,335


50,756

Pension and postretirement expense

1,696


1,273

Pension and postretirement contributions

(5,196)


(4,824)

Realized loss on investments in marketable securities


33,746

Unrealized loss on investments in marketable securities

5,331


6,737

Deferred income taxes

(5,669)


116,447

Working capital changes

(21,992)


(52,320)

Noncurrent liability changes and other, net

357,146


(23,076)

Net cash provided by operating activities

545,383


97,954

Cash flows from investing activities:


Capital expenditures

(182,624)


(579,322)

Sales of marketable securities, net

3,381


84,893

Investments in equity investments and nonmarketable securities

(60)


(74)

Net cash used in investing activities

(179,303)


(494,503)

Cash flows from financing activities:


Proceeds from issuance of mandatory convertible preferred stock


2,236,750

Repayments of long-term debt and credit agreements

(9,615)


(29,019)

Proceeds from borrowings of long-term debt and credit agreements


29,019

Other debt repayments, net

(1,195)


(620,753)

Dividends paid to common shareholders

(47,607)


(46,908)

Dividends paid to mandatory convertible preferred shareholders

(41,688)


Dividends paid to noncontrolling interests

(18,169)


Proceeds from exercise of stock options

1,186


86

Withholding taxes paid on stock-based compensation award distributions

(2,904)


(10,619)

Other

(14)


(1,256)

Net cash (used in) provided by financing activities

(120,006)


1,557,300

Net effect of foreign exchange on cash and cash equivalents

80,207


5,162

Increase in cash and cash equivalents

326,281


1,165,913

Cash and cash equivalents at end of period

$   1,518,511


$   2,055,813

Albemarle Corporation and Subsidiaries
Consolidated Summary of Segment Results
(In Thousands) (Unaudited)


Three Months Ended


March 31,


2025


2024

Net sales:


Energy Storage

$   524,565


$   800,898

Specialties

321,014


316,065

Ketjen

231,302


243,773

Total net sales

$ 1,076,881


$ 1,360,736


Adjusted EBITDA:


Energy Storage

$   186,355


$   197,996

Specialties

58,666


45,181

Ketjen

38,588


21,979

Total segment adjusted EBITDA

283,609


265,156

Corporate

(16,465)


26,080

Total adjusted EBITDA

$   267,144


$   291,236

See accompanying non-GAAP reconciliations below.

Additional Information regarding Non-GAAP Measures

It should be noted that adjusted net income attributable to Albemarle Corporation, adjusted net (loss) income attributable to Albemarle Corporation common shareholders, adjusted diluted loss per share attributable to common shareholders, non-operating pension and other post-employment benefit ("OPEB") items per diluted share, non-recurring and other unusual items per diluted share, adjusted effective income tax rates, EBITDA, adjusted EBITDA (on a consolidated basis), EBITDA margin and adjusted EBITDA margin, and operating cash flow conversion are financial measures that are not required by, or presented in accordance with, accounting principles generally accepted in the United States , or GAAP. These non-GAAP measures should not be considered as alternatives to Net income attributable to Albemarle Corporation ("earnings") or other comparable measures calculated and reported in accordance with GAAP. These measures are presented here to provide additional useful measurements to review the company's operations, provide transparency to investors and enable period-to-period comparability of financial performance. The company's chief operating decision maker uses these measures to assess the ongoing performance of the company and its segments, as well as for business and enterprise planning purposes.

A description of other non-GAAP financial measures that Albemarle uses to evaluate its operations and financial performance, and reconciliation of these non-GAAP financial measures to the most directly comparable financial measures calculated and reported in accordance with GAAP can be found on the following pages of this press release, which is also is available on Albemarle's website at https://investors.albemarle.com . The company does not provide a reconciliation of forward-looking non-GAAP financial measures to the most directly comparable financial measures calculated and reported in accordance with GAAP, as the company is unable to estimate significant non-recurring or unusual items without unreasonable effort. The amounts and timing of these items are uncertain and could be material to the company's results calculated in accordance with GAAP.

Albemarle Corporation AND SUBSIDIARIES

Non-GAAP Reconciliations

(Unaudited)

See below for a reconciliation of adjusted net income attributable to Albemarle Corporation, adjusted net (loss) income attributable to Albemarle Corporation common shareholders, EBITDA and adjusted EBITDA (on a consolidated basis), which are non-GAAP financial measures, to Net income attributable to Albemarle Corporation, the most directly comparable financial measure calculated and reported in accordance with GAAP. Adjusted net (loss) income attributable to Albemarle Corporation common shareholders is defined as net income (loss) after mandatory convertible preferred stock dividends, but before the non-recurring, other unusual and non-operating pension and other post-employment benefit (OPEB) items as listed below. The non-recurring and unusual items may include acquisition and integration related costs, gains or losses on sales of businesses, restructuring charges, facility divestiture charges, certain litigation and arbitration costs and charges, and other significant non-recurring items. EBITDA is defined as net income attributable to Albemarle Corporation before interest and financing expenses, income tax expense, and depreciation and amortization. Adjusted EBITDA is defined as EBITDA plus or minus the proportionate share of Windfield Holdings income tax expense, non-recurring, other unusual and non-operating pension and OPEB items as listed below.


Three Months Ended


March 31,


2025


2024

In thousands, except percentages and per share amounts

$


% of
net
sales


$


% of
net
sales

Net income attributable to Albemarle Corporation

$41,348


$    2,448


Add back:


Non-operating pension and OPEB items (net of tax)

125


(351)


Non-recurring and other unusual items (net of tax)

(21,200)


40,044


Adjusted net income attributable to Albemarle Corporation

20,273


42,141


Mandatory convertible preferred stock dividends

(41,688)


(11,584)


Adjusted net (loss) income attributable to Albemarle Corporation common shareholders

$ (21,415)


$  30,557


Adjusted diluted (loss) earnings per share attributable to common shareholders

$     (0.18)


$      0.26


Adjusted weighted-average common shares outstanding – diluted

117,603


117,451


Net income attributable to Albemarle Corporation

$41,348


3.8 %


$    2,448


0.2 %

Add back:


Interest and financing expenses

48,977


4.5 %


37,969


2.8 %

Income tax (benefit)

(3,978)


(0.4) %


(3,721)


(0.3) %

Depreciation and amortization

161,754


15.0 %


123,751


9.1 %

EBITDA

248,101


23.0 %


160,447


11.8 %

Proportionate share of Windfield income tax expense

25,326


2.4 %


73,689


5.4 %

Non-operating pension and OPEB items

275


— %


(325)


— %

Non-recurring and other unusual items

(6,558)


(0.6) %


57,425


4.2 %

Adjusted EBITDA

$ 267,144


24.8 %


$ 291,236


21.4 %


Net sales

$  1,076,881


$  1,360,736


Non-operating pension and OPEB items, consisting of mark-to-market actuarial gains/losses, settlements/curtailments, interest cost and expected return on assets, are not allocated to Albemarle's operating segments and are included in the Corporate category. In addition, the company believes that these components of pension cost are mainly driven by market performance, and the company manages these separately from the operational performance of the company's businesses. In accordance with GAAP, these non-operating pension and OPEB items are included in Other income, net. Non-operating pension and OPEB items were as follows (in thousands):


Three Months Ended


March 31,


2025


2024

Interest cost

$       8,810


$       8,505

Expected return on assets

(8,535)


(8,830)

Total

$          275


$        (325)

In addition to the non-operating pension and OPEB items disclosed above, the company has identified certain other items and excluded them from Albemarle's adjusted net income calculation for the periods presented. A listing of these items, as well as a detailed description of each follows below (per diluted share):


Three Months Ended


March 31,


2025


2024

Restructuring charges and asset write-offs (1)

$       (0.02)


$         0.23

Acquisition and integration related costs (2)

0.01


0.01

Loss in fair value of public equity securities (3)

0.03


0.35

Other (4)

(0.08)


(0.15)

Tax related items (5)

(0.12)


(0.10)

Total non-recurring and other unusual items

$       (0.18)


$         0.34


(1)

The Company took several actions during 2024 as part of a broader effort that will focus on preserving its world-class resource advantages, optimizing its global conversion network, improving the Company's cost competitiveness and efficiency, reducing capital intensity and enhancing the Company's financial flexibility. Those actions included stopping construction of Kemerton Trains 3 and 4, as well as certain other capital projects, placing Kemerton Train 2 in care and maintenance and transitioning the Company's operating structure to a fully integrated functional model (excluding Ketjen). Subsequently, in early 2025, the Company announced its additional decision to put the Chengdu, China conversion plant into care and maintenance by mid-year 2025. As a result, the Company recorded restructuring and asset write-off charges of ($1.1 million) in Restructuring charges and asset write-offs and losses of $0.2 million in Other income, net for the three months ended March 31, 2025. Due to the impact of valuation allowances, this resulted in total after-tax gains of $2.1 million, or $0.02 per share for the three months ended March 31, 2025. During the three months ended March 31, 2024, the Company recorded restructuring and asset write-off charges of $33.5 million in Restructuring charges and asset write-offs and losses of $2.7 million in Other income, net. In total, this resulted in after-tax losses of ($27.0 million after income taxes, or $0.23 per share) for the three months ended March 31, 2024.


(2)

Costs related to the acquisition, integration and divestitures for various significant projects, recorded in Selling, general and administrative expenses for the three months ended March 31, 2025 and 2024 were $1.4 million and $1.9 million ($1.1 million and $1.5 million after income taxes, or $0.01 and $0.01 per share), respectively.


(3)

Loss of $5.0 million ($3.9 million after income taxes, or $0.03 per share) recorded in Other income, net resulting from the net change in fair value of investments in public equity securities for the three months ended March 31, 2025. Losses of $33.7 million and $9.4 million recorded in Other income, net resulting from the sale of investments in public equity securities and the change in fair value of investments in public equity securities, respectively, for the three months ended March 31, 2024 ($41.1 million after income taxes, or $0.35 per share).


(4)

Other adjustments for the three months ended March 31, 2025 included amounts recorded in:


Selling, general and administrative expenses - $3.2 million of gains from the sale of assets at a site not part of our operations, partially offset by $0.6 million of expenses related to certain historical legal matters.

Other income, net - $9.8 million of income from PIK dividends of preferred equity in a Grace subsidiary and a $1.9 million gain primarily resulting from the adjustment of indemnification related to previously disposed businesses, partially offset by $1.9 million of charges for asset retirement obligations at a site not part of our operations.

After income taxes, these net gains totaled $9.8 million, or $0.08 per share.


Other adjustments for the three months ended March 31, 2024 included amounts recorded in:

Cost of goods sold - $1.4 million of expenses related to non-routine labor and compensation related costs that are outside normal compensation arrangements.

Selling, general and administrative expenses - $0.1 million of expenses related to certain legal costs.

Other income, net - $17.3 million gain primarily from the sale of assets at a site not part of our operations, an $8.7 million gain from PIK dividends of preferred equity in a Grace subsidiary and a $2.4 million gain primarily resulting from the adjustment of indemnification related to a previously disposed business, partially offset by $2.9 million of charges for asset retirement obligations at a site not part of our operations.


After income taxes, these net gains totaled $17.3 million, or $0.15 per share.


(5)

Included in Income tax benefit for the three months ended March 31, 2025 are discrete net tax benefits of $14.2 million, or $0.12 per share, primarily related to the reduction in a foreign tax reserve and excess tax benefits realized from stock-based compensation arrangements.


Included in Income tax benefit for the three months ended March 31, 2024 are discrete net tax benefits of $12.3 million, or $0.10 per share primarily related to the reduction in a foreign tax reserve and excess tax benefits realized from stock-based compensation arrangements.

See below for a reconciliation of the adjusted effective income tax rate, the non-GAAP financial measure, to the effective income tax rate, the most directly comparable financial measure calculated and reporting in accordance with GAAP (in thousands, except percentages).


(Loss) income
before income taxes
and equity in net
income of
unconsolidated
investments


Income tax (benefit)
expense


Effective income tax
rate

Three months ended March 31, 2025


As reported

$                     (18,966)


$                       (3,978)


21.0 %

Non-recurring, other unusual and non-operating pension and OPEB
items

(6,283)


14,792


As adjusted

$                     (25,249)


$                      10,814


(42.8) %


Three months ended March 31, 2024


As reported

$                   (167,574)


$                       (3,721)


2.2 %

Non-recurring, other unusual and non-operating pension and OPEB
items

57,100


17,407


As adjusted

$                   (110,474)


$                      13,686


(12.4) %

See below for the calculation of operating cash flow conversion, which the Company defines as Net cash provided by operating activities from the statement of cash flows divided by adjusted EBITDA, which is a non-GAAP measure. A reconciliation of adjusted EBITDA, the non-GAAP financial measure, from net income attributable to Albemarle Corporation, the most directly comparable financial measure calculated and reporting in accordance with GAAP, is provided in the above tables (in thousands, except percentages).


Three Months Ended


March 31, 2025

Net cash provided by operating activities

$                545,383

Less: Customer prepayment

350,000

Net cash provided by operating activities excluding customer prepayment

$                195,383


Adjusted EBITDA

$                267,144


Operating cash flow conversion

204 %

Operating cash flow conversion excluding customer prepayment

73 %

Contact:


invest@albemarle.com

1.980.299.5700

Cision View original content to download multimedia: https://www.prnewswire.com/news-releases/albemarle-reports-first-quarter-2025-results-302442938.html

SOURCE Albemarle Corporation

News Provided by PR Newswire via QuoteMedia

Keep reading...Show less
NextSource Materials

NextSource Materials Investor Kit

  • Corporate info
  • Insights
  • Growth strategies
  • Upcoming projects

GET YOUR FREE INVESTOR KIT

Latest Press Releases

Related News

×