The Conversation (0)

ASX Release
Westgold is a leading, ASX100 Australian gold producer, with a clear purpose - to unearth enduring value for all our stakeholders.
Our vision is to become the leading Australian gold company, sustaining safe, responsible and profitable production.
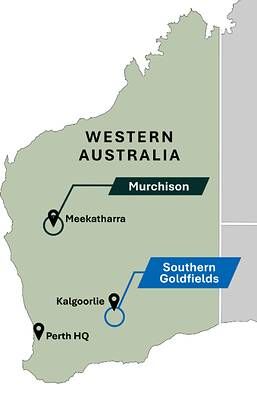
Our operations comprise four mining hubs, with combined processing capacity of ~6Mtpa across the Murchison and Southern Goldfields, two of Western Australia's most prolific gold-producing regions.
Financial values are reported in A$ unless otherwise specified.
This announcement is authorised for release to the ASX by the Board.
FY26 Production Guidance Exceeded Q4 Underlying Cash Build of $233M
PERTH, Western Australia, July 22, 2026 /CNW/ -- Westgold Resources Limited (ASX: WGX) (TSX: WGX) (Westgold or the Company) is pleased to report results for the period ending 30 June 2026 (Q4 FY26).
HIGHLIGHTS
SAFETY
Lost Time Injury Frequency Rate (LTIFR) at 1.58 / million hours worked
PRODUCTION
FY26 Gold Production of 387,354oz - above FY26 Guidance range*
FY26 All in Sustaining Cost (AISC)** of $2,841/oz - within FY26 Cost Guidance
Q4 FY26 Gold production of 98,854oz Au at AISC of $2,802/oz
Record mining rates achieved at Bluebird South-Junction in Q4, with annualised mining rates beyond 1Mtpa at the end of the quarter
Record annual gold production for Meekatharra and Fortnum Hubs under Westgold ownership
TREASURY
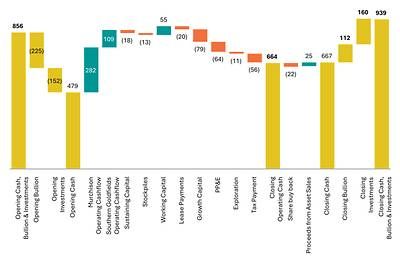
Q4 FY26 underlying cash build of $233M - before investments in growth ($142M), shareholder returns through buybacks ($22M), investment in exploration ($11M) and proceeds from asset sales (+$25M)
$939M in closing cash, bullion, and liquid investments @ 30 June 2026 - an increase of $575M for FY26 and $83M Q on Q
Westgold is 100% debt free and remains fully unhedged
CORPORATE
Divestment of Peak Hill and Chalice Gold Projects - simplifies the portfolio and marks completion of non-core asset divestments
Share buyback continues - $27M of Westgold shares purchased on-market in FY26
FY27 Guidance, updated 3 Year Outlook, Full Year Financial Results, and dividend update - to be reported in August 2026
* Refer to the Company's ASX announcement titled "FY26 Guidance" dated 7 August 2025 for further information regarding the FY26 Guidance. |
** AISC reported exclusive of ore purchase agreement (OPA) costs and associated production |
Westgold Managing Director and CEO Wayne Bramwell commented:
"FY26 was a defining year for Westgold and showed our strategy is delivering results.
Over the past two years, we have simplified our portfolio, focused on our highest return assets and prudently allocated capital on key projects and infrastructure that enables future growth. In FY26, this strategy delivered record annual production of 387,354oz, above our guidance range, achieved our cost guidance, and placed Westgold in the strongest treasury position in its history.
Improving operational delivery generated an underlying cash build of $233M for the quarter, with Westgold closing FY26 with $939M in cash, bullion and liquid investments. We remain debt free, unhedged and with the financial strength to fund both organic growth, and ongoing return of capital to our shareholders.
During the quarter, we invested $142M in growth, optimisation and infrastructure projects across the business. This included $79M of planned investment in key growth projects including the Bluebird-South Junction and Great Fingall mine developments and the early commencement of the Murchison Open Pit Programme which was brought forward from FY27. We also invested $64M in plant and equipment including the purchase of the Westgold Village, formerly known as the Bluebush Accommodation Village in Kambalda.
Corporately we have been active, completing the Valiant Gold (ASX: VAL) IPO in March and the divestment of our remaining non-core assets during Q4. These initiatives streamline our portfolio and immediately unlock significant value for our shareholders.
On a cost basis, Westgold's full year cost performance was within our guidance and reflects greater scale, improving asset utilisation and more disciplined operational and commercial execution. In FY27 cost control remains key, with our team focused on lifting mill feed grade, mine productivity and processing efficiency to offset potential cost inflation across the sector.
Westgold enters FY27 with a committed team, increasing operational momentum, a robust balance sheet and confidence in our long-term strategy. These factors enhance the resilience of our business and with our four processing hubs being optimised, cornerstone mines ramping up and our internal financial capacity to support organic growth, Westgold is well placed to continue to deliver sustainable returns to our shareholders."
Executive Summary
Cash Position as of 30 June 2026
Westgold closed Q4 FY26 with cash, bullion and liquid investments of $939M – representing a quarter-on-quarter build of $83M.
Underlying cash build for Q4 FY26 was $233M - before share buy backs ($22M), growth and exploration spend (invested $142M on non-sustaining capital and $11M on exploration), and one-off cash inflows (proceeds from asset divestment totalled $25M).
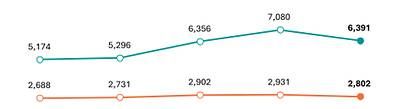
This result was driven by a strong realised gold price of $6,391/oz and a competitive AISC margin of $3,589/oz.
Notes for Q4 Cash, Bullion and Liquid Investment Movements
1 Refer to the Company's ASX announcement titled "Completion of the Peak Hill Gold Project Divestment" dated 1 July 2026 for further information. |
Group Highlights – Q4, FY26
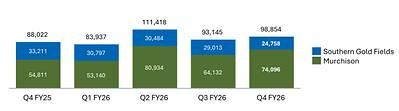
In Q4 FY26, Westgold processed 1,468 kt (Q3 FY26: 1,481kt) of ore at an average grade of 2.3g/t Au (Q3 FY26: 2.1g/t Au), producing 98,854oz of gold (Q3 FY26: 93,145oz). The higher production was driven from the Murchison business with increasing contributions from higher grade ore from Starlight, the expanding Bluebird-South Junction underground mine, improvement in the Cue operations and third party purchased ore processed at the Meekatharra hub.
During the quarter, Westgold mined 1,334kt at 2.1g/t Au (Q3 FY26: 1,148kt at 2.2g/t Au). Total tonnes mined increased quarter on quarter due to improving mining rates at Bluebird-South Junction, Big Bell, Great Fingall and Beta Hunt.
On a full year basis, Westgold produced 387,354oz of gold for FY26, achieving record annual production for the Company and exceeding the top end of our FY26 production guidance of 345,000 – 385,000oz.2
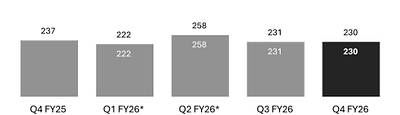
All-In Sustaining Cost (AISC) for Q4 FY26 was $230M (Q3 FY26: $231M), and on a per ounce basis was $2,802/oz (Q3 FY26: $2,931/oz). The reduction in AISC/oz was driven primarily by the higher production quarter on quarter.
FY26 AISC was $2,841/oz - delivering our FY26 cost guidance range of $2,600 – $2,900/oz.2
Increases in the price of diesel added $12M to Westgold's cost base in Q4 FY26, offset by a reduction in royalty payments due to the softening of the gold price compared to the prior quarter.
Importantly, Westgold has not experienced any diesel supply disruptions. The Company maintains long-term supply agreements with a global major diesel producer, providing security of supply across its operations. Westgold retains contingency plans to manage potential supply disruptions due to geopolitical developments in the Middle East, ensuring operational continuity and the protection of shareholder value.
Westgold's current 3-Year Outlook3 (3YO) outlines a clear strategy going forward to optimise value from our core assets. Lower grade stockpile feed is progressively being replaced with higher grade sources across the portfolio, with Westgold actively accelerating organic opportunities (such as the Murchison Open Pit Programme) that can bring value forward across the 3YO.
Westgold will provide its full year FY26 Financial Results, a dividend update, and FY27 Guidance in August 2026. With FY26 now complete, the Company will also provide an updated 3 Year Outlook in August that will incorporate FY29.
*Q1 and Q2 FY26 AISC adjusted post Half-Year Financial Report for the period ended 31 December 2025
2 Refer to the Company's ASX announcement titled "FY26 Guidance" dated 7 August 2025 for further information regarding the FY26 Guidance. |
3 Refer to the Company's ASX announcement titled "Westgold Provides 3-Year Outlook" dated 1 October 2025 for further information. |
In Q4 FY26, the Company sold 110,345oz of gold achieving a price of $6,391/oz, generating $705M in revenue. With Westgold hedge free, operations generated $313M of mine operating cashflows and a strong AISC margin of $3,589/oz.
Total non-sustaining capital expenditure during Q4 FY26 of $142M (Q3 FY26: $81M) includes $79M of planned investment in growth projects (Bluebird-South Junction and Great Fingall development, and the early commencement of the Murchison Open Pit Programme brought forward from FY27) and $64M in plant and equipment (processing facilities, ventilation, water, and camp infrastructure across the Group, and purchase of the Westgold Village, formerly known as the Bluebush Accommodation Village in Kambalda).
Total non-sustaining capital expenditure for FY26 was $341M, above FY26 guidance of $270M2. The increase primarily reflects the deliberate acceleration of several high-return growth and optimisation initiatives planned for FY27, including bringing forward capital elements of the Murchison Open Pit Programme and investment in infrastructure in FY26 to support future production growth.
Investment in exploration and resource development for the quarter was $11M (Q3 FY26: $13M). For FY26, exploration and resource development investment was $42M, below the FY26 exploration guidance of $50M2. The variance primarily reflects the timing of approvals and access requirements for planned drilling programs, with expenditure deferred into FY27.
Westgold expects exploration investment to increase in FY27. This is a deliberate decision as increasing our drilling budgets in resource development and exploration can build value and reduce execution risk of the Company's extensive pipeline of organic growth opportunities.
The net mine cash inflow for Q4 FY26 was $159M (refer Table 1 under Group Performance Metrics).
Group Performance Metrics
Westgold's quarterly physical and financial outputs for Q4 FY26 are summarised below.
Table 1: Westgold Q4 FY26 Performance
Physical Summary | Units | Murchison | Southern | Group |
ROM - Ore Mined | t | 879,967 | 453,924 | 1,333,891 |
Grade Mined | g/t | 2.2 | 2.0 | 2.1 |
Ore Processed1 | t | 1,060,799 | 406,873 | 1,467,672 |
Head Grade1 | g/t | 2.3 | 2.0 | 2.3 |
Recovery1 | % | 92 | 94 | 93 |
Gold Produced1 | oz | 74,096 | 24,758 | 98,854 |
Gold Sold | oz | 78,372 | 31,973 | 110,345 |
Achieved Gold Price | A$/oz | 6,391 | 6,391 | 6,391 |
Cost Summary | Units | Murchison | Southern | Group |
Mining2 | A$'M | 71 | 65 | 136 |
Processing | A$'M | 38 | 11 | 49 |
Admin | A$'M | 8 | 8 | 16 |
Stockpile Movements | A$'M | 3 | (16) | (13) |
Royalties | A$'M | 13 | 11 | 24 |
Sustaining Capital | A$'M | 15 | 3 | 18 |
All-in Sustaining Costs | A$'M | 148 | 82 | 230 |
All-in Sustaining Costs | A$/oz | 2,567 | 3,331 | 2,802 |
Notional Cashflow Summary | Units | Murchison | Southern | Group |
Notional Revenue (produced oz) | A$'M | 473 | 158 | 631 |
All-in Sustaining Costs | A$'M | (148) | (82) | (230) |
Ore Purchase Agreements1,2 | A$'M | (88) | — | (88) |
Mine Operating Cashflow | A$'M | 237 | 76 | 313 |
Growth Capital | A$'M | (65) | (14) | (79) |
Plant and Equipment | A$'M | (29) | (35) | (64) |
Exploration Spend | A$'M | (7) | (4) | (11) |
Net Mine Cashflow | A$'M | 136 | 23 | 159 |
Net Mine Cashflow | A$/oz | 1,825 | 981 | 1,614 |
1. Processing physicals includes 172kt of New Murchison OPA ore processed at 3.1g/t for 16,505oz in the Murchison and 9kt of Forrestania Resources OPA ore processed at 0.6g/t for 151oz in the Southern Goldfields. Third party ounces from OPAs are included in gold production but excluded from A$/oz calculations | |
2. Mining costs exclude costs in relation to OPAs |
Table 2: Westgold FY26 YTD Performance
Physical Summary | Units | Murchison | Southern | Group |
ROM - Ore Mined | t | 3,047,782 | 1,847,976 | 4,895,758 |
Grade Mined | g/t | 2.3 | 2.1 | 2.2 |
Ore Processed1 | t | 4,075,487 | 1,757,819 | 5,833,306 |
Head Grade1 | g/t | 2.3 | 2.2 | 2.2 |
Recovery1 | % | 92 | 94 | 93 |
Gold Produced1 | oz | 272,302 | 115,052 | 387,354 |
Gold Sold | oz | 271,949 | 118,409 | 390,358 |
Achieved Gold Price | A$/oz | 6,238 | 6,238 | 6,238 |
Cost Summary | Units | Murchison | Southern | Group |
Mining2 | A$'M | 304 | 238 | 542 |
Processing | A$'M | 153 | 64 | 217 |
Admin | A$'M | 33 | 35 | 68 |
Stockpile Movements | A$'M | (16) | (29) | (45) |
Royalties | A$'M | 50 | 55 | 105 |
Sustaining Capital | A$'M | 45 | 9 | 54 |
All-in Sustaining Costs | A$'M | 569 | 372 | 941 |
All-in Sustaining Costs | A$/oz | 2,629 | 3,241 | 2,841 |
Notional Cashflow Summary | Units | Murchison | Southern | Group |
Notional Revenue (produced oz) | A$'M | 1,724 | 720 | 2,444 |
All-in Sustaining Costs | A$'M | (569) | (372) | (941) |
Ore Purchase Agreements1,2 | A$'M | (309) | — | (309) |
Mine Operating Cashflow | A$'M | 846 | 348 | 1,194 |
Growth Capital | A$'M | (180) | (37) | (217) |
Plant and Equipment | A$'M | (65) | (59) | (124) |
Exploration Spend | A$'M | (24) | (18) | (42) |
Net Mine Cashflow | A$'M | 577 | 234 | 811 |
Net Mine Cashflow | A$/oz | 2,119 | 2,034 | 2,094 |
1. Processing physicals includes 506kt of New Murchison OPA ore processed at 3.4g/t for 55,862oz in the Murchison and 13kt of Forrestania Resources OPA ore processed at 0.7g/t for 276oz in the Southern Goldfields. Third party ounces from OPAs are included in gold production but excluded from A$/oz calculations | |
2. Mining costs exclude costs in relation to OPAs |
Q4 FY26 Group Performance Overview
MURCHISON
Westgold's Murchison operations delivered a stronger quarter-on-quarter performance, producing 74,096oz of gold in Q4 FY26 (Q3 FY26: 64,132oz). The improvement was driven by increased production from the Meekatharra Hub following the continued ramp-up of Bluebird-South Junction, together with stronger contributions from Big Bell, Great Fingall, Starlight and third party purchased ore.
At the Meekatharra Hub, Bluebird-South Junction continues to demonstrate the benefits of the updated mine design and operating methodology, delivering higher mining rates (including hitting a 1Mtpa run rate in June), increased ore supply and improved production outcomes quarter-on-quarter. The operation continues to build momentum as one of Westgold's key growth assets, with mining performance tracking in line with the planned expansion profile.
Development and mining productivity remained strong during the period, underpinning confidence in Bluebird-South Junction's ability to deliver sustained mining rates through FY27.
Additional quarter on quarter production growth was delivered from Big Bell, Great Fingall and Starlight. Following completion of the Big Bell ventilation upgrade in Q3, improved airflow increased access to mining areas and supported record ore outputs. Great Fingall continued its progressive ramp-up as deeper virgin stopes were opened, while Starlight benefited from improved grade performance from the Nightfall stopes.
These Murchison assets provided a meaningful contribution to Westgold's stronger quarter-on-quarter performance and reflect the operational flexibility within the Murchison business unit.
Also at the Meekatharra Hub, the New Murchison OPA delivered 17koz at 3.1g/t in Q4 FY26, up from 14koz at 3.1g/t in Q3 FY26. The OPA material provided more oxide material than expected, facilitating continued higher than planned processing rates through Westgold's Meekatharra processing hub.
Total AISC of $148M (Q3 FY26: $128M) was higher than the prior quarter due to improved milling performance drawing down on surface stockpiles built during the prior quarter.
AISC per ounce of $2,567/oz (Q3 FY26: $2,584/oz) was in line with the prior quarter.
Total Non-Sustaining Capital Expenditure of $94M, includes Growth Capital ($65M) and plant and equipment ($29M) across the Murchison. Growth capital was higher than the prior quarter as a result of increased development costs at Great Fingall, longer-dated extensional drilling at Bluebird-South Junction and the deliberate decision to commence the Murchison Open Pit Programme earlier than originally planned (in late FY26), bringing value forward in the 3YO.
SOUTHERN GOLDFIELDS
The Southern Goldfields produced 24,758oz of gold in Q4 FY26 and as expected, was lower than the prior quarter (Q3 FY26: 29,013oz). The lower quarter-on-quarter production outcome was primarily driven by reduced tonnes processed, reflecting the scheduled deferral of a 50kt toll treatment parcel at the Lakewood processing facility (previously flagged in Q3 FY26). Toll treatment at Lakewood is scheduled to recommence in Q1 FY27.
The total AISC in the Southern Goldfields decreased quarter on quarter (Q4 FY26 AISC: $82M vs Q3 FY26 AISC: $103M). On a per ounce basis, AISC was lower at $3,331/oz in Q4 FY26 (Q3 FY26: $3,546/oz). This is predominantly due to lower processing maintenance spend with no major planned shutdown and no toll treating at Lakewood.
Total Non-Sustaining Capital Expenditure of $48M in Q4 FY26 - includes Growth Capital ($14M) and plant and equipment ($35M) across the Southern Goldfields Operations mainly relating to the purchase of Westgold Village ($22M), primary ventilation, extensional drilling and power distribution equipment at the Beta Hunt mine, and tailings storage facilities at Higginsville.
Table 3: Q4 FY26 Group Mining Physicals
| Ore Mined ('000 t) | Mined Grade (g/t) | Contained ounces (Oz) | |
Murchison | 880 | 2.2 | 62,197 |
Bluebird | 220 | 2.4 | 16,974 |
Fender | 39 | 2.8 | 3,517 |
Big Bell | 351 | 1.7 | 18,996 |
Great Fingall | 35 | 2.5 | 2,826 |
Starlight | 229 | 2.7 | 19,602 |
Murchison OP | 6 | 1.6 | 282 |
Southern Goldfields | 454 | 2.0 | 30,011 |
Beta Hunt | 411 | 2.0 | 25,900 |
Two Boys | 43 | 3.0 | 4,111 |
GROUP TOTAL | 1,334 | 2.1 | 92,208 |
Table 4: Q4 FY26 Group Processing Physicals
| Ore Milled ('000 t) | Head Grade (g/t) | Recovery (%) | Gold Production (Oz) | |
Murchison | 1,061 | 2.3 | 92 | 74,096 |
Bluebird | 249 | 2.5 | 95 | 18,624 |
Fender | 4.1 | 3.3 | 90 | 390 |
Ore Purchase | 172 | 3.1 | 97 | 16,505 |
Open Pit & Low Grade | 69 | 1.1 | 90 | 2,224 |
Meekatharra Hub | 494 | 2.5 | 95 | 37,743 |
Big Bell | 262 | 1.8 | 85 | 13,043 |
Fender | 37 | 2.7 | 86 | 2,733 |
Great Fingall | 26 | 2.4 | 85 | 1,706 |
Open Pit & Low Grade | 17 | 1.6 | 84 | 736 |
Cue Hub | 342 | 1.9 | 85 | 18,218 |
Starlight | 205 | 2.9 | 94 | 17,674 |
Open Pit & Low Grade | 20 | 0.8 | 95 | 461 |
Fortnum Hub | 225 | 2.7 | 95 | 18,135 |
Southern Goldfields | 407 | 2.0 | 94 | 24,758 |
Beta Hunt | 331 | 2.1 | 94 | 20,825 |
Two Boys | 44 | 2.3 | 92 | 2,993 |
Lake Cowan | 8 | 1.3 | 93 | 313 |
Ore Purchase | 9 | 0.6 | 91 | 151 |
Open Pit & Low Grade | 15 | 1.0 | 92 | 476 |
GROUP TOTAL | 1,468 | 2.3 | 93 | 98,854 |
Operations
Safety & Sustainability
Q4 FY26 saw continued improvement across key safety indicators, supported by sustained frontline engagement, critical control verification and leadership field presence. Leading indicator performance remained strong, while lagging indicators improved, reflecting ongoing focus on fatality prevention, critical risk management and injury reduction across the Group.
No Lost Time Injuries were recorded during the quarter, with LTIFR at 1.58 and TRIFR at 11.77 for the quarter. There were no significant environmental non-compliance events.
The Murchison
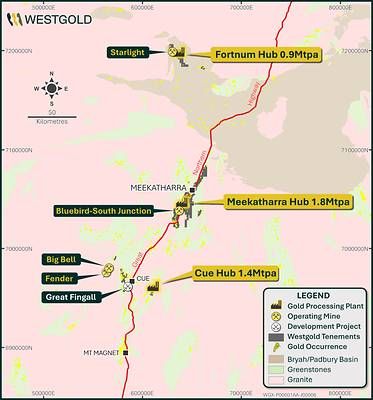
In Q4 FY26, the Fortnum Hub processed 225kt at 2.7g/t with 95% recovery for 18,135oz (Q3 FY26: 218kt at 2.4g/t with 95% recovery for 16,175oz). Fortnum's higher production outcomes were primarily driven by sequencing with higher grade material in Q4 being processed from the Nightfall lodes.
This production result capped off a stellar financial year for Fortnum, in which it produced a record 72koz of gold.
The West Ramp project was completed in the quarter which allows underground haulage direct to the processing ROM eliminating third party rehandle and haulage of underground material which will drive cost savings from Q1 FY27.
The Meekatharra Hub output continues to improve. In Q4, it processed 494kt of ore at 2.5g/t with 95% recovery for 37,743oz (Q3 FY26: 477kt at 2.2g/t with 94% recovery for 31,394oz). This was driven principally by the continued ramp-up of Bluebird–South Junction, displacement of lower grade stockpile feed, and contributions from third party ore under the third party ore purchase agreement.
Operationally, the Meekatharra Hub continues to benefit from the stronger performance of the Bluebird–South Junction underground mine, Westgold's cornerstone growth asset in the Murchison. During the quarter, Bluebird–South Junction delivered record mining rates and ore supply, supporting increased mill throughput and gold production having mined 220kt at 2.4 g/t for 16,974oz (Q3 FY26: 195kt at 2.7 g/t for 16,916oz). In June, Bluebird-South Junction achieved a milestone annualised mining rate of over 1Mtpa, mining 84kt of ore.
The Hub also benefited from ore supplied under the ore purchase agreement with New Murchison Gold Limited (ASX: NMG) (OPA). During the quarter, approximately 172kt of purchased ore at 3.1g/t was processed through the Meekatharra plant, contributing 16,505oz of gold production. The OPA provides additional ore optionality and mill feed flexibility, enabling Westgold to maximise utilisation of available processing capacity while generating strong cash margins.
In FY26, the Meekatharra Hub produced a record 133koz.
In Q4 the Cue Hub outputs lifted again, processing 342kt at 1.9g/t with 85% recovery for 18,218oz (Q3 FY26: 329kt at 1.8g/t with 87% recovery for 16,563oz). The improved result reflects increasing production across the hub, led by Big Bell, which achieved record quarterly and annual mining rates, following completion of ventilation upgrades at the end of Q3 FY26.
Great Fingall also continued its progressive ramp-up during the quarter, delivering 35kt at 2.5g/t for 2,826oz mined and achieving access to the first ore drive in the Golden Crown orebody. As development continues and access increases to deeper mining fronts, Great Fingall is expected to make an increasing contribution to hub production through FY27.
The Murchison Open Pit Programme was originally planned to start in FY27 but commenced in earnest in Q4, FY26, with 6kt mined at 1.6g/t for 282 contained ounces. Mining activities remain in the early stages of development, with production expected to progressively increase through FY27 as the open pits are further established and additional ore zones become available.
The Southern Goldfields
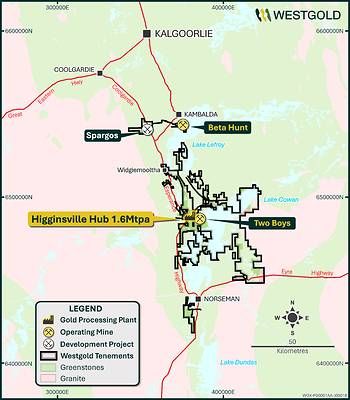
Production output at the Higginsville Hub was broadly in line with the prior quarter, with the 1.6Mtpa Higginsville processing plant treating 407kt at 2.0g/t with a 94% recovery for 24,758oz (Q3 FY26: 396kt at 2.2g/t with 94% recovery for 25,957oz).
Importantly, Q4 was Beta Hunt's best quarter for mining performance in FY26, mining 411kt at 2.0g/t for 25,900oz (Q3 FY26: 342kt at 2.0g/t for 21,982oz). The increase reflects continued improvement in production and development rates across the operation.
Legacy ventilation issues at Beta Hunt continued to be addressed during the quarter. Westgold installed the ventilation bracing works advised by the primary fan vendor to resolve fan performance. The system ran at full capacity, demonstrated the ability to support mining rates consistent with Beta Hunt's targeted 2.0Mtpa operating profile, but the bracing did not resolve the underlying performance issue. Westgold continues to work closely with the fan vendor and other technical specialists to identify and implement a long-term solution.
In the short term, Westgold has utilised existing inventory and installed fans that allow for a run rate of approximately 1.7Mtpa. A new system, which is suitable to deliver >2Mtpa production rates, has been procured and will be operational during Q2 FY27.
Westgold does not expect ventilation capacity to have a material impact on Group production or cash generation as the mine remains capable of delivering mining rates that exceed current milling capacity.
During the quarter, Westgold completed the acquisition of the Bluebush Accommodation Village in Kambalda, which has since been rebranded as the Westgold Village. The investment of $22M supports the Company's strategy to consolidate its Kambalda business, simplify ground logistics and secure long‑term accommodation capacity for its Southern Goldfields operations.
Westgold did not toll treat Beta Hunt ore at the Lakewood mill in Q4, having taken an opportunity to process an extra parcel in FY25 in lieu of a FY26 Q4 parcel (Q3 FY26: 62kt at 1.7g/t with 92% recovery for 3,056oz).
Toll treatment at Lakewood is scheduled to resume in Q1 FY27.
Exploration and Growth
During the quarter, Westgold invested $11M (Q3 FY26: $13M) in Exploration and Resource Definition with a total of $42M invested for FY26. At the end of the quarter, Westgold had 16 underground diamond rigs, five surface diamond rigs and one surface RC rig (22 drills) operating across the portfolio.
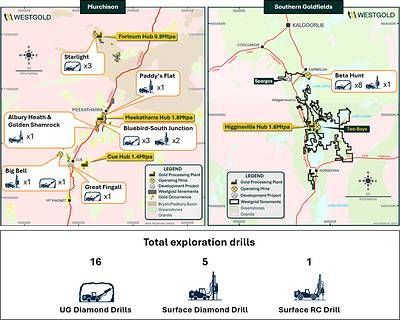
Near Meekatharra, Westgold continued resource definition activities at Paddy's Flat. Diamond drilling with multiple surface rigs are testing the potential to recommence open pit mining across the package, which could add a significant new ore source to the Meekatharra Hub. This program will continue over the coming quarters.
Also at Meekatharra, drilling efforts intensified within the Bluebird / South Junction / Polar Star system to the south of the current underground mining areas. Two surface rigs are drilling southern step-out holes, complementing the underground rigs currently active on infill work within the known extents of these orebodies.
In regard to enabling additional open pit opportunities proximate to the Meekatharra hub, the Company continued resource definition activities to support the Murchison Open Pit Programme with drilling undertaken during the quarter on the Albury Heath and Golden Shamrock deposits that form part of the program in the Meekatharra area.
At Cue, Westgold is also continuing to drill to the south of Big Bell. Drilling in this area has progressed to evaluating a potential return to open pit mining proximate to the Cue processing hub.
Murchison greenfields activities focused on preparation works for upcoming exploration drilling programs at Aladdin North, Caledonian South (near Meekatharra) and Pelican (near Cue).
In the Southern Goldfields, the focus on drilling at Beta Hunt continues, with multiple rigs active in current mining areas and the Fletcher zone. In addition, a greenfields exploration drill program commenced on the McKay target located within the Gamma Block at the southern end of Beta Hunt.
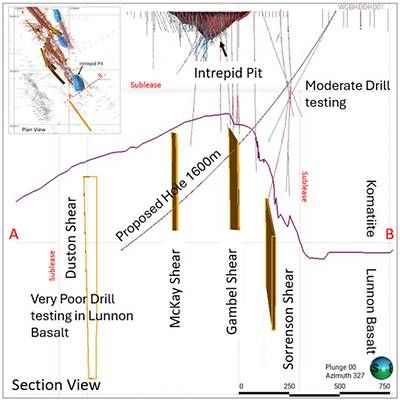
The McKay Shear is a major feature of the largely untested Gamma Block region and is interpreted to be a fault offset of the Western Flanks/Larkin mineralisation trend. An initial single deep (>1600m) diamond drill hole will test the McKay target, as well as the upper portion of the Gamble Shear target, and depending on drilling conditions, could be extended to test the Duston Shear target further to the west.
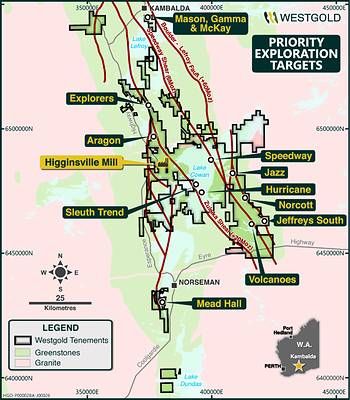
Greenfields exploration drilling was also completed at a number of regional targets including Norcott, Rainier and Jeffreys South, whilst preparation works continued for the upcoming lake-based drilling of the Speedway and Sleuth targets.
Speedway is targeting a structural setting analogous to the large Invincible gold deposit at St Ives (owned by Gold Fields), while Sleuth represents a 13km-long mineralised corridor along the southern extension of the Zuleika Shear Zone, both offering significant greenfields discovery potential beneath Lake Cowan cover.
Growth Projects
During the quarter, Westgold continued to advance the Higginsville Expansion Project (HXP) EPC tender.
To reduce future execution risk (capital and schedule impacts) Westgold has ordered key long lead items including the SAG mill prior to the award of the EPC contract. Ordering these items early removes them from the critical path to project delivery and locks in the procured price.
In parallel, Westgold is assessing capital efficient optimisation opportunities across the Cue and Meekatharra processing hubs, with studies currently being finalised. These opportunities are focused on improving processing efficiency, increasing throughput and enhancing operational flexibility through disciplined but incremental capital investment.
Consistent with Westgold's approach to capital allocation, any expansion initiatives will be assessed against strict return thresholds, with the objective of delivering sustainable margin growth, stronger cash generation and long-term shareholder value.
Corporate
At the end of Q4 FY26, Westgold's cash, bullion and investments totalled $939M.
Cash, Bullion and Investments
Description | Mar 2026 | June 2026 | Variance ($M) | Variance (%) |
Cash | 479 | 667 | 188 | 39 |
Bullion | 225 | 112 | (113) | (50) |
Liquid Investments1 | 152 | 160 | 8 | 5 |
Cash, Bullion and Investments | 856 | 939 | 83 | 10 |
Investments | # shares held at | Share price at | Investment |
New Murchison Gold Limited (ASX: NMG) | 1,689,427,459 | 0.040 | 68 |
Alicanto Minerals Limited (ASX: AQI) | 32,216,744 | 1.350 | 43 |
Black Cat Syndicate (ASX: BC8) | 19,739,439 | 0.880 | 18 |
Kali Metals Limited (ASX: KM1) | 31,863,345 | 0.078 | 2 |
Great Boulder Resources (ASX:GBR) | 392,255,241 | 0.075 | 29 |
Total Liquid Investments | 160 | ||
Valiant Gold Limited (ASX: VAL) - escrow ends 27/3/28 | 240,000,100 | 0.200 | 48 |
Total Investments | 208 | ||
1. Liquid investments exclude holdings in Valiant Gold (VAL) under escrow until 27 March 2028. |
Portfolio simplification
At the end of the quarter, Westgold completed the divestment of the Peak Hill Gold Project to Great Boulder Resources Limited (ASX: GBR) and, in early July, completed the divestment of the Chalice Gold Project to Corazon Mining Limited (ASX:CZN,OTC:CRZNF). The divestments combined delivered ~$68M of immediate value4 and up to $11M of deferred value to shareholders. These transactions are consistent with Westgold's strategy to focus on its core operating assets and unlock value from non-core holdings, while retaining exposure to future upside through strategic equity holdings.
Debt
Westgold maintains undrawn $600M unsecured syndicated revolving facilities5. While the Company does not currently require additional funding, the establishment of long‑dated, unsecured liquidity provides flexibility to fund growth, manage volatility and bring forward value‑accretive opportunities within the Company's 3‑Year Outlook.
With a treasury balance of $939M at the end of June 2026, the new facilities increase total available liquidity to $1.5B and further underpin Westgold's capacity to execute its growth strategy from a position of financial strength.
4 $54M ($25M cash and 392M of GBR shares at $0.075/share at 30 June 2026) for Peak Hill and $14M ($8M cash and 47.6M of CZN shares at $0.12/share at 30 June 2026) for Chalice. |
5 See ASX announcement titled "Westgold Strengthens Balance Sheet Flexibility" - 12 March 2026 |
Gold Hedging
Westgold is fully unhedged and completely leveraged to the gold price. In Q4 FY26, Westgold achieved an average gold price of $6,391/oz (Q3 FY26 $7,080/oz).
Share Capital
Westgold closed the quarter with the following capital structure:
Security Type | Number on Issue |
Fully Paid Ordinary Shares | 939,667,506 |
Performance Rights (Rights) | 12,887,011 |
Share Buyback and Dividend
In August 2025, Westgold's Board authorised an on-market share buyback program to be executed over the next 12 months, to buyback a maximum of 5% of the Company's fully paid ordinary shares. This inaugural buyback, approved and announced during the September 2025 quarter, is designed to enhance capital management and reflects the Board's confidence in Westgold's intrinsic value and future cash flow generation capacity.
In open trading periods (as defined in the company's Securities Trading Policy) and to the end of Q4 FY26, Westgold had purchased and subsequently cancelled 5,164,058 Westgold shares at an average price of $5.14 per share for a total cash outlay of $26.6M.
At 30 June 2026, Westgold's Annual Dividend Policy remains unchanged. Given the Company's robust balance sheet, cash generation capacity and with a continued focus on shareholder returns, the Board will consider the FY26 dividend as part of the FY26 full year results process in August.
Any dividend announcement would be expected in August alongside the release of the Company's full year FY26 Financial Results, FY27 Guidance and updated 3 Year Outlook.
Quarterly conference call details
Wayne Bramwell (Managing Director & CEO), Tommy Heng (Chief Financial Officer) and Aaron Rankine (Chief Operating Officer) will present the results via webcast on Wednesday 22 July 2026 at 10:00AM AWST / 12:00PM AEST, followed by a Q&A session.
To listen to the Webcast live, please click on the link below and register your details. After registering, you will receive a confirmation email containing information about joining the webinar.
https://attendee.gotowebinar.com/register/7273084056273997915
Please log on a few minutes before the scheduled commencement time to ensure you are registered in time for the start of the call.
Compliance Statements
Forward Looking Statements
These materials prepared by Westgold Resources Limited (or the "Company") include forward looking statements. Often, but not always, forward looking statements can generally be identified by the use of forward looking words such as "may", "will", "expect", "intend", "believe", "forecast", "predict", "plan", "estimate", "anticipate", "continue", and "guidance", or other similar words and may include, without limitation, statements regarding plans, strategies and objectives of management, anticipated production or construction commencement dates and expected costs or production outputs.
Forward looking statements inherently involve known and unknown risks, uncertainties and other factors that may cause the Company's actual results, performance, and achievements to differ materially from any future results, performance, or achievements. Relevant factors may include, but are not limited to, changes in commodity prices, foreign exchange fluctuations and general economic conditions, increased costs and demand for production inputs, the speculative nature of exploration and project development, including the risks of obtaining necessary licenses and permits and diminishing quantities or grades of Ore Reserves, political and social risks, changes to the regulatory framework within which the Company operates or may in the future operate, environmental conditions including extreme weather conditions, recruitment and retention of personnel, industrial relations issues and litigation.
Forward looking statements are based on the Company and its management's good faith assumptions relating to the financial, market, regulatory and other relevant environments that will exist and affect the Company's business and operations in the future. The Company does not give any assurance that the assumptions on which forward looking statements are based will prove to be correct, or that the Company's business or operations will not be affected in any material manner by these or other factors not foreseen or foreseeable by the Company or management or beyond the Company's control.
Although the Company attempts, and has attempted, to identify factors that would cause actual actions, events or results to differ materially from those disclosed in forward looking statements, there may be other factors that could cause actual results, performance, achievements or events not to be as anticipated, estimated or intended, and many events are beyond the reasonable control of the Company. In addition, the Company's actual results could differ materially from those anticipated in these forward looking statements as a result of the factors outlined in the "Risk Factors" section of the Company's continuous disclosure filings available on SEDAR+ or the ASX, including, in the Company's current annual report, half year report or most recent management discussion and analysis.
Accordingly, readers are cautioned not to place undue reliance on forward looking statements. Forward looking statements in these materials speak only at the date of issue. Subject to any continuing obligations under applicable law or any relevant stock exchange listing rules, in providing this information the Company does not undertake any obligation to publicly update or revise any of the forward-looking statements or to advise of any change in events, conditions or circumstances.
Mineral Resources and Ore Reserves
The information in this report that relates to Mineral Resources is provided by Westgold technical employees and contractors under the supervision of the General Manager of Technical Services, Mr. Jake Russell B.Sc. (Hons), who is a member of the Australian Institute of Geoscientists and who has verified, reviewed, and approved such information. Mr Russell is a full-time employee to the Company and has sufficient experience which is relevant to the styles of mineralisation and types of deposit under consideration and to the activities which he is undertaking to qualify as a Competent Person as defined in the 2012 Edition of the Australasian Code for Reporting of Exploration Results, Mineral Resources and Ore Reserves (the "JORC Code") and as a Qualified Person as defined in the CIM Guidelines and National Instrument 43-101 – Standards of Disclosure for Mineral Projects ("NI 43-101"). Mr. Russell is an employee of the Company and, accordingly, is not independent for purposes of NI 43-101. Mr Russell consents to and approves the inclusion in this report of the matters based on his information in the form and context in which it appears. Mr Russell is eligible to participate in short and long-term incentive plans of the Company.
The information in this release that relates to Ore Reserve is based on information compiled by Mr. Leigh Devlin B.Eng. FAusIMM, who has verified, reviewed and approved such information. Mr. Devlin has sufficient experience which is relevant to the styles of mineralisation and types of deposit under consideration and to the activities which they are undertaking to qualify as a Competent Person as defined in the JORC Code and as a Qualified Person as defined in the CIM Guidelines and NI 43-101. Mr. Devlin is an employee of the Company and, accordingly, is not independent for purposes of NI 43-101. Mr. Devlin consents to and approves the inclusion in this release of the matters based on his information in the form and context in which it appears. Mr. Devlin is a full-time senior executive of the Company and is eligible to and may participate in short-term and long-term incentive plans of the Company as disclosed in its annual reports and disclosure documents.
It is a requirement of the ASX Listing Rules that the reporting of Mineral Resources, Ore Reserve Estimates in Australia complies with the JORC Code. Investors outside Australia should note that while Ore Reserve and Mineral Resource estimates of the Company in this report comply with the JORC Code (such JORC Code-compliant Ore Reserves and Mineral Resources being "Ore Reserves" and "Mineral Resources" respectively), they may not comply with the relevant guidelines in other countries. The JORC Code is an acceptable foreign code under NI 43-101. Information contained in this announcement describing mineral deposits may not be comparable to similar information made public by companies subject to the reporting and disclosure requirements of US securities laws, including Item 1300 of Regulation S-K. All technical and scientific information in this report has been prepared in accordance with the Canadian regulatory requirements set out in NI 43-101 and has been reviewed on behalf of the Company by Qualified Persons, as set forth above.
This report contains references to estimates of Mineral Resources and Ore Reserves. The estimation of Mineral Resources is inherently uncertain and involves subjective judgments about many relevant factors. Mineral Resources that are not Ore Reserves do not have demonstrated economic viability. The accuracy of any such estimates is a function of the quantity and quality of available data, and of the assumptions made and judgments used in engineering and geological interpretation, which may prove to be unreliable and depend, to a certain extent, upon the analysis of drilling results and statistical inferences that may ultimately prove to be inaccurate. Mineral Resource estimates may require re-estimation based on, among other things: (i) fluctuations in the price of gold; (ii) results of drilling; (iii) results of metallurgical testing, process and other studies; (iv) changes to proposed mine plans; (v) the evaluation of mine plans subsequent to the date of any estimates; and (vi) the possible failure to receive required permits, approvals and licenses.
Appendix A – Key metrics by operating asset
Q4 FY25 | Q1 FY26 | Q2 FY26 | Q3 FY26 | Q4 FY26 | ||
Fortnum Hub | ||||||
Ore milled | kt | 231 | 223 | 228 | 218 | 225 |
Milled grade | g/t | 2.6 | 2.3 | 3.1 | 2.4 | 2.7 |
Recovery | % | 93 | 94 | 95 | 95 | 95 |
Gold Produced | oz | 18,149 | 15,487 | 21,840 | 16,175 | 18,135 |
Meekatharra Hub | ||||||
Ore milled | kt | 377 | 392 | 515 | 477 | 494 |
Milled grade | g/t | 1.7 | 2.0 | 2.6 | 2.2 | 2.5 |
Recovery | % | 94 | 93 | 95 | 94 | 95 |
Gold Produced | oz | 19,640 | 23,367 | 40,730 | 31,394 | 37,743 |
Cue Hub | ||||||
Ore milled | kt | 333 | 291 | 342 | 329 | 342 |
Milled grade | g/t | 1.8 | 1.8 | 1.9 | 1.8 | 1.9 |
Recovery | % | 88 | 85 | 86 | 87 | 85 |
Gold Produced | oz | 17,022 | 14,286 | 18,364 | 16,563 | 18,218 |
Southern Goldfields | ||||||
Ore milled | kt | 467 | 449 | 444 | 457 | 407 |
Milled grade | g/t | 2.4 | 2.3 | 2.3 | 2.2 | 2.0 |
Recovery | % | 93 | 94 | 94 | 91 | 94 |
Gold Produced | oz | 33,211 | 30,797 | 30,484 | 29,013 | 24,758 |
Starlight UG | ||||||
Ore mined | kt | 197 | 202 | 212 | 233 | 229 |
Mined grade | g/t | 2.9 | 2.5 | 3.3 | 2.5 | 2.7 |
Contained gold | oz | 18,457 | 16,436 | 22,744 | 18,857 | 19,602 |
Bluebird-South Junction UG | ||||||
Ore mined | kt | 170 | 144 | 171 | 195 | 220 |
Mined grade | g/t | 2.6 | 3.2 | 2.5 | 2.7 | 2.4 |
Contained gold | oz | 14,027 | 14,615 | 13,827 | 16,916 | 16,974 |
OPA | ||||||
Ore Purchased | kt | - | 33 | 185 | 182 | 156 |
Ore grade | g/t | - | 3.3 | 4 | 3.1 | 3.2 |
Contained gold | oz | - | 3,231 | 23,731 | 17,882 | 15,960 |
Big Bell UG | ||||||
Ore mined | kt | 279 | 269 | 280 | 287 | 351 |
Mined grade | g/t | 1.8 | 1.7 | 1.8 | 1.7 | 1.7 |
Contained gold | oz | 16,416 | 14,975 | 16,379 | 15,440 | 18,996 |
Murchison OP | ||||||
Ore mined | kt | — | — | — | — | 6 |
Mined grade | g/t | — | — | — | — | 1.6 |
Contained gold | oz | — | — | — | — | 282 |
Great Fingall UG | ||||||
Ore mined | kt | 32 | 15 | 10 | 18 | 35 |
Mined grade | g/t | 1.44 | 1.3 | 2.4 | 2.0 | 2.5 |
Contained gold | oz | 1,498 | 597 | 749 | 1,146 | 2,826 |
Fender UG | ||||||
Ore mined | kt | 90 | 58 | 34 | 40 | 39 |
Mined grade | g/t | 1.9 | 2.3 | 2.7 | 2.3 | 2.8 |
Contained gold | oz | 5,551 | 4,214 | 2,989 | 2,980 | 3,517 |
Beta Hunt UG | ||||||
Ore mined | kt | 383 | 381 | 396 | 342 | 411 |
Mined grade | g/t | 2.3 | 2.3 | 2.2 | 2.0 | 2.0 |
Contained gold | oz | 28,533 | 27,642 | 27,603 | 21,982 | 25,900 |
Two Boys UG | ||||||
Ore mined | kt | 56 | 37 | 36 | 33 | 43 |
Mined grade | g/t | 2.9 | 3.3 | 4.3 | 3.2 | 3.0 |
Contained gold | oz | 5,210 | 3,868 | 5,029 | 3,488 | 4,111 |
Lake Cowan OP | ||||||
Ore mined | kt | 57 | 119 | 49 | — | — |
Mined grade | g/t | 1.4 | 1.4 | 1.7 | — | — |
Contained gold | oz | 2,582 | 5,446 | 2,587 | — | — |
Appendix B – Group metrics
Physical Summary | Units | Q4 FY25 | Q1 FY26 | Q2 FY26 | Q3 FY26 | Q4 FY26 |
ROM - Ore Mined | t | 1,264,056 | 1,225,331 | 1,188,114 | 1,148,422 | 1,333,891 |
Grade Mined | g/t | 2.3 | 2.2 | 2.4 | 2.2 | 2.1 |
Ore Processed1 | t | 1,408,120 | 1,355,192 | 1,529,426 | 1,481,016 | 1,467,672 |
Head Grade1 | g/t | 2.1 | 2.1 | 2.4 | 2.1 | 2.3 |
Recovery1 | % | 92 | 92 | 93 | 93 | 93 |
Gold Produced1 | oz | 88,022 | 83,937 | 111,418 | 93,145 | 98,854 |
Gold Produced - Excluding OPA | oz | 88,022 | 81,336 | 89,101 | 78,581 | 82,198 |
Gold Produced - OPA | oz | 0 | 2,601 | 22,317 | 14,564 | 16,656 |
Gold Sold | oz | 71,500 | 94,913 | 115,200 | 69,900 | 110,345 |
Achieved Gold Price | A$/oz | 5,174 | 5,296 | 6,356 | 7,080 | 6,391 |
Cost Summary | ||||||
Mining2 | A$'M | 152 | 138* | 131* | 137 | 136 |
Processing | A$'M | 54 | 58 | 58 | 52 | 49 |
Admin | A$'M | 15 | 17 | 17 | 18 | 16 |
Stockpile Movements | A$'M | (7) | (23) | 4 | (13) | (13) |
Royalties | A$'M | 12 | 20 | 35 | 26 | 24 |
Sustaining Capital | A$'M | 11 | 12 | 13 | 11 | 18 |
All-in Sustaining Costs | A$'M | 237 | 222* | 258* | 231 | 230 |
All-in Sustaining Costs | A$/oz | 2,688 | 2,731* | 2,902* | 2,931 | 2,802 |
Notional Cashflow Summary | ||||||
Notional Revenue (produced oz) | A$'M | 456 | 445 | 709 | 659 | 631 |
All-in Sustaining Costs | A$'M | (237) | (222)* | (258)* | (231) | (230) |
Ore Purchase Agreements1,2 | A$'M | — | (13) | (128) | (80) | (88) |
Mine Operating Cashflow | A$'M | 219 | 210* | 323* | 348 | 313 |
Growth Capital | A$'M | (27) | (44)* | (39)* | (55) | (79) |
Plant and Equipment | A$'M | (12) | (21) | (13) | (26) | (64) |
Exploration Spend | A$'M | (9) | (12) | (6) | (13) | (11) |
Net Mine Cashflow | A$'M | 171 | 133 | 265 | 254 | 159 |
Net Mine Cashflow | A$/oz | 1,937 | 1,583 | 2,373 | 2,729 | 1,608 |
*Q1 and Q2 FY26 AISC adjusted post Half-Year Financial Report for the period ended 31 December 2025 |
1. Processing physicals includes OPA ore processed. Third party ounces from OPAs are included in gold production but excluded from A$/oz calculations |
2. Mining costs exclude costs in relation to OPAs |
Murchison
Physical Summary | Units | Q4 FY25 | Q1 FY26 | Q2 FY26 | Q3 FY26 | Q4 FY26 |
ROM - Ore Mined | t | 767,751 | 687,951 | 706,987 | 772,877 | 879,967 |
Grade Mined | g/t | 2.3 | 2.3 | 2.5 | 2.2 | 2.2 |
Ore Processed1 | t | 940,810 | 906,500 | 1,084,704 | 1,023,484 | 1,060,799 |
Head Grade1 | g/t | 2.0 | 2.0 | 2.5 | 2.1 | 2.3 |
Recovery1 | % | 91 | 91 | 92 | 92 | 92 |
Gold Produced1 | oz | 54,811 | 53,140 | 80,934 | 64,132 | 74,096 |
Gold Produced - Excluding OPA | oz | 54,811 | 50,539 | 58,617 | 49,693 | 57,591 |
Gold Produced - OPA | oz | 0 | 2,601 | 22,317 | 14,439 | 16,505 |
Gold Sold | oz | 42,879 | 59,947 | 84,077 | 49,553 | 78,372 |
Achieved Gold Price | A$/oz | 5,174 | 5,296 | 6,356 | 7,080 | 6,391 |
Cost Summary | ||||||
Mining2 | A$'M | 84 | 80* | 71* | 82 | 71 |
Processing | A$'M | 34 | 41 | 40 | 34 | 38 |
Admin | A$'M | 10 | 8 | 8 | 9 | 8 |
Stockpile Movements | A$'M | (6) | (1) | 2 | (20) | 3 |
Royalties | A$'M | 7 | 7 | 16 | 14 | 13 |
Sustaining Capital | A$'M | 9 | 10 | 11 | 9 | 15 |
All-in Sustaining Costs | A$'M | 138 | 145* | 148* | 128 | 148 |
All-in Sustaining Costs | A$/oz | 2,503 | 2,865* | 2,532* | 2,584 | 2,567 |
Notional Cashflow Summary | ||||||
Notional Revenue (produced oz) | A$'M | 284 | 282 | 515 | 454 | 473 |
All-in Sustaining Costs | A$'M | (138) | (145)* | (148)* | (128) | (148) |
Ore Purchase Agreements1,2 | A$'M | — | (13) | (128) | (80) | (88) |
Mine Operating Cashflow | A$'M | 146 | 124* | 239* | 246 | 237 |
Growth Capital | A$'M | (25) | (35)* | (33)* | (47) | (65) |
Plant and Equipment | A$'M | (6) | (8) | (8) | (20) | (29) |
Exploration Spend | A$'M | (3) | (7) | (2) | (8) | (7) |
Net Mine Cashflow | A$'M | 112 | 74 | 196 | 171 | 136 |
Net Mine Cashflow | A$/oz | 2,045 | 1,392 | 2,421 | 2,669 | 1,825 |
*Q1 and Q2 FY26 AISC adjusted post Half-Year Financial Report for the period ended 31 December 2025 |
1. Processing physicals includes OPA ore processed. Third party ounces from OPAs are included in gold production but excluded from A$/oz calculations |
2. Mining costs exclude costs in relation to OPAs |
Southern Goldfields
Physical Summary | Units | Q4 FY25 | Q1 FY26 | Q2 FY26 | Q3 FY26 | Q4 FY26 |
ROM - Ore Mined | t | 496,305 | 537,380 | 481,127 | 375,545 | 453,924 |
Grade Mined | g/t | 2.3 | 2.1 | 2.4 | 2.1 | 2.0 |
Ore Processed | t | 467,310 | 448,692 | 444,722 | 457,532 | 406,873 |
Head Grade | g/t | 2.4 | 2.3 | 2.3 | 2.1 | 2.0 |
Recovery | % | 93 | 94 | 94 | 94 | 94 |
Gold Produced | oz | 33,211 | 30,797 | 30,484 | 29,013 | 24,758 |
Gold Sold | oz | 28,621 | 34,966 | 31,123 | 20,347 | 31,973 |
Achieved Gold Price | A$/oz | 5,174 | 5,296 | 6,356 | 7,080 | 6,391 |
Cost Summary | ||||||
Mining | A$'M | 68 | 58 | 60 | 55 | 65 |
Processing | A$'M | 20 | 17 | 18 | 18 | 11 |
Admin | A$'M | 5 | 9 | 9 | 9 | 8 |
Stockpile Movements | A$'M | (1) | (22) | 2 | 7 | (16) |
Royalties | A$'M | 5 | 13 | 19 | 12 | 11 |
Sustaining Capital | A$'M | 2 | 2 | 2 | 2 | 3 |
All-in Sustaining Costs | A$'M | 99 | 77 | 110 | 103 | 82 |
All-in Sustaining Costs | A$/oz | 2,992 | 2,516 | 3,614 | 3,546 | 3,331 |
Notional Cashflow Summary | ||||||
Notional Revenue (produced oz) | A$'M | 172 | 163 | 194 | 205 | 158 |
All-in Sustaining Costs | A$'M | (99) | (77) | (110) | (103) | (82) |
Ore Purchase Agreements | A$'M | — | — | — | — | — |
Mine Operating Cashflow | A$'M | 73 | 86 | 84 | 102 | 76 |
Growth Capital | A$'M | (2) | (9) | (6) | (8) | (14) |
Plant and Equipment | A$'M | (6) | (13) | (5) | (6) | (35) |
Exploration Spend | A$'M | (6) | (5) | (4) | (5) | (4) |
Net Mine Cashflow | A$'M | 59 | 59 | 69 | 83 | 23 |
Net Mine Cashflow | A$/oz | 1,759 | 1,919 | 2,247 | 2,861 | 981 |

SOURCE Westgold Resources Limited

 View original content to download multimedia: http://www.newswire.ca/en/releases/archive/July2026/21/c3139.html
News Provided by Canada Newswire via QuoteMedia