The Conversation (0)
- Highest first quarter net income in over 30 years of $1,173 million with Upstream income of $782 million and Downstream income of $389 million, driven primarily by strong market conditions
- Highest first quarter cash flow from operating activities in over 30 years of $1,914 million, with free cash flow¹ of $1,635 million
- Upstream production of 380,000 barrels per day, impacted by extreme cold weather and unplanned downtime at Kearl
- Downstream quarterly refinery capacity utilization of 93%, third consecutive quarter above 90%
- Completed construction of the Sarnia Products Pipeline providing enhanced access to the high-value Toronto market and reducing transportation costs
- Declared second quarter dividend of 34 cents per share
- Announced intention to initiate a substantial issuer bid to purchase up to $2.5 billion of its common shares
TMLImperial Oil Limited (TSE: IMO, NYSE American: IMO):
This press release features multimedia. View the full release here: https://www.businesswire.com/news/home/20220429005123/en/
(Graphic: Business Wire)
|
|
|
|
|
|
|
|
| First quarter | ||
| millions of Canadian dollars, unless noted |
| 2022 | 2021 | ∆ |
| Net Income (loss) (U.S. GAAP) | 1,173 | 392 | +781 | |
| Net Income (loss) per common share, assuming dilution (dollars) | 1.75 | 0.53 | +1.22 | |
| Capital and exploration expenditures |
| 296 | 163 | +133 |
|
|
|
|
|
|
Imperial reported estimated net income in the first quarter of $1,173 million up from $813 million in the fourth quarter of 2021, driven primarily by strong market conditions. Cash flow from operating activities was $1,914 million up from $1,632 million in the fourth quarter of 2021. Both net income and cash flow from operating activities represent the highest first quarter result in over 30 years.
"Imperial achieved strong financial results across all business lines in the first quarter as pandemic restrictions were lifted and commodity prices further strengthened," said Brad Corson, chairman, president and chief executive officer. "With strong margins across all our businesses, we are very well positioned to continue generating substantial free cash flow 1 this year."
Upstream production in the first quarter averaged 380,000 gross oil-equivalent barrels per day. At Kearl, quarterly total gross production averaged 186,000 barrels per day with operations impacted by extreme cold weather and unplanned downtime. Subsequent to the first quarter, Kearl's April month-to-date production increased to about 250,000 total gross barrels per day. At Cold Lake, the company's strategic focus on reliability and optimization continued to drive strong operating performance with quarterly production of 140,000 gross barrels per day.
In the Downstream, quarterly refining throughput averaged 399,000 barrels per day with capacity utilization of 93% representing the third consecutive quarter with utilization above 90%. Quarterly petroleum product sales averaged 447,000 barrels per day as pandemic restrictions began lifting late in the quarter.
| 1 | non-GAAP financial measure – see attachment VI for definition and reconciliation |
During the quarter, construction of the Sarnia Products Pipeline was completed ahead of schedule, with start-up and commissioning completed in April. The pipeline provides enhanced access into the high-value Toronto market and is expected to reduce annual transportation costs by $40 million.
Chemical first quarter net income was $56 million, compared to net income of $64 million in the fourth quarter of 2021, as margins eased from record highs.
During the quarter, Imperial returned $449 million to shareholders through the accelerated completion of the company's normal course issuer bid, with the program concluding on January 31, 2022. The company also paid $185 million in dividends, and declared a second quarter dividend of 34 cents per share. "Imperial has a long track record of returning surplus cash to shareholders and I am pleased to announce the company's plans to initiate a substantial issuer bid returning up to $2.5 billion to shareholders in the second quarter of 2022," said Corson.
Imperial continues to advance lower emission solutions in support of its sustainability goals, including its recently announced oil sands greenhouse gas intensity reduction goal of 30 percent by 2030 from 2016 levels. Imperial is a member of the Oil Sands Pathways to Net Zero alliance that is working with federal and provincial governments with a goal to achieve net zero greenhouse gas emissions from oil sands operations by 2050. The company also continues to progress plans for a world-class renewable diesel manufacturing facility at its Strathcona refinery, to provide Canada with a large new domestic source of renewable fuel to help reduce Scope 3 emissions.
"Imperial remains confident in our ability to reduce emissions and advance lower-emission technologies. We are also encouraged by recent steps taken by the federal government to support investment tax credits on large-scale carbon capture projects to help Canada achieve its climate goals," said Corson. "Continued collaboration and our long history of research and development will continue to serve us well on this journey."
First quarter highlights
- Net income of $1,173 million or $1.75 per share on a diluted basis, the highest first quarter in over 30 years, up from $392 million or $0.53 per share in the first quarter of 2021. Improved net income was primarily driven by strong market conditions.
- Cash flows from operating activities of $1,914 million, the highest first quarter in over 30 years, up from $1,045 million in the same period of 2021. Cash flows from operating activities excluding working capital¹ of $1,219 million, compared with $1,068 million in the same period of 2021. Changes in working capital of $695 million includes $459 million of income taxes payable in the first quarter of 2023.
- Capital and exploration expenditures totalled $296 million, up from $163 million in the first quarter of 2021.
- The company returned $634 million to shareholders in the first quarter of 2022, including $449 million from the accelerated completion of the company's normal course issuer bid program on January 31, 2022 and $185 million in dividends paid.
- Announced intention to initiate a substantial issuer bid to purchase for cancellation up to $2.5 billion of its common shares. The company anticipates that the terms and pricing will be determined and the offer will commence during the next two weeks.
- Production averaged 380,000 gross oil-equivalent barrels per day, compared to 432,000 barrels per day in the same period of 2021. Production was impacted by extreme cold weather and unplanned downtime at Kearl.
- Total gross bitumen production at Kearl averaged 186,000 barrels per day (132,000 barrels Imperial's share), compared to 251,000 barrels per day (178,000 barrels Imperial's share) in the first quarter of 2021. Production was impacted by extreme cold weather and unplanned downtime. April month-to-date production has since increased to about 250,000 total gross barrels per day.
- Gross bitumen production at Cold Lake averaged 140,000 barrels per day, consistent with the first quarter of 2021, driven by continued strong operating performance and efficiently offsetting production decline.
- The company's share of gross production from Syncrude averaged 77,000 barrels per day, compared to 79,000 barrels per day in the first quarter of 2021. Syncrude continues to leverage the interconnect pipeline to capture value, achieving record first quarter bitumen production.
- The previously announced marketing process for Imperial and ExxonMobil Canada's interests in XTO Energy Canada is on-going, with bids received now under evaluation. A definitive decision to sell the assets has not yet been made and operations will continue as normal throughout the marketing process and should the process not result in a sale.
- Refinery throughput averaged 399,000 barrels per day, up from 364,000 barrels per day in the first quarter of 2021. Capacity utilization was 93 percent, up from 85 percent in the first quarter of 2021, the third consecutive quarter with utilization above 90 percent. Higher throughput and utilization were driven primarily by increased demand.
- Petroleum product sales were 447,000 barrels per day, up from 414,000 barrels per day in the first quarter of 2021. Higher petroleum product sales were driven primarily by increased demand.
- Completed construction of the Sarnia Products Pipeline ahead of schedule, with commissioning and start-up completed in April. The pipeline provides enhanced access into the high-value Toronto market and is expected to reduce annual transportation costs by $40 million.
- Chemical net income of $56 million in the quarter, compared to $67 million in the first quarter of 2021 as margins eased from record highs.
- Announced expanded partnership with Loblaw's PC Optimum loyalty program, offering Canadians the opportunity to redeem PC Optimum points at more than 2,000 Esso stations across Canada.
Current business environment
During the COVID-19 pandemic, industry investment to maintain and increase production capacity was restrained to preserve capital, resulting in underinvestment and supply tightness as demand for petroleum and petrochemical products recovered. Across late 2021 and early 2022, this dynamic, along with supply chain constraints, and a continuation of demand recovery led to a steady increase in oil and natural gas prices. In the first quarter of 2022, tightness in the oil and natural gas markets was further exacerbated by Russia's invasion of Ukraine and subsequent sanctions imposed upon business and other activities in Russia. The price of crude oil and certain regional natural gas indicators increased to levels not seen for several years.
Operating results
First quarter 2022 vs. first quarter 2021
|
| First Quarter | |
| millions of Canadian dollars, unless noted | 2022 | 2021 |
| Net income (loss) (U.S. GAAP) | 1,173 | 392 |
| Net income (loss) per common share, assuming dilution (dollars) | 1.75 | 0.53 |
|
|
|
|
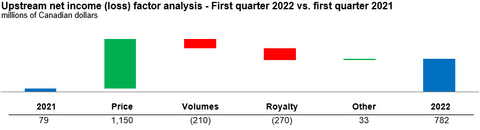
Upstream
Net income (loss) factor analysis
millions of Canadian dollars
| 2021 | Price | Volumes | Royalty | Other | 2022 |
| 79 | 1,150 | (210) | (270) | 33 | 782 |
Price – Higher realizations were generally in line with increases in marker prices, driven primarily by increased demand and supply chain constraints. Average bitumen realizations increased by $42.17 per barrel generally in line with WCS and synthetic crude oil realizations increased by $49.83 per barrel generally in line with WTI.
Volumes – Lower volumes primarily driven by extreme cold weather and unplanned downtime at Kearl.
Royalty – Higher royalties primarily driven by improved commodity prices.
| Marker prices and average realizations | ||
|
| First Quarter | |
| Canadian dollars, unless noted | 2022 | 2021 |
| West Texas Intermediate (US$) | 95.01 | 58.14 |
| Western Canada Select (US$) | 80.46 | 45.64 |
| WTI/WCS Spread (US$) | 14.55 | 12.50 |
| Bitumen (per barrel) | 89.36 | 47.19 |
| Synthetic crude oil (per barrel) | 117.24 | 67.41 |
| Average foreign exchange rate (US$) | 0.79 | 0.79 |
|
|
|
|
| Production | |||
|
| First Quarter | ||
| thousands of barrels per day | 2022 | 2021 | |
| Kearl (Imperial's share) | 132 | 178 | |
| Cold Lake | 140 | 140 | |
| Syncrude (Imperial's share) (a) | 77 | 79 | |
|
|
|
| |
| Kearl total gross production (thousands of barrels per day) | 186 | 251 | |
| (a) In the first quarter of 2022, Syncrude (Imperial's share) gross production included about 1 thousand barrels per day of bitumen (2021 - rounded to 0 thousand barrels per day) that was exported to the operator's facilities using an existing interconnect pipeline. | |||
|
|
|
| |
| Lower production at Kearl was primarily a result of extreme cold weather and unplanned downtime. | |||
Downstream
Net income (loss) factor analysis
millions of Canadian dollars
| 2021 | Margins | Other | 2022 |
| 292 | 70 | 27 | 389 |
Margins – Higher margins primarily reflect improved market conditions.
| Refinery utilization and petroleum product sales | ||
|
| First Quarter | |
| thousands of barrels per day, unless noted | 2022 | 2021 |
| Refinery throughput | 399 | 364 |
| Refinery capacity utilization (percent) | 93 | 85 |
| Petroleum product sales | 447 | 414 |
Improved refinery throughput in the first quarter of 2022 primarily reflects increased demand.
Improved petroleum product sales in the first quarter of 2022 were mainly due to increased demand.
Chemicals
Net income (loss) factor analysis
millions of Canadian dollars
| 2021 | Margins | Other | 2022 |
| 67 | (10) | (1) | 56 |
Corporate and other
|
| First Quarter | |
| millions of Canadian dollars | 2022 | 2021 |
| Net income (loss) (U.S. GAAP) | (54) | (46) |
Liquidity and capital resources
|
| First Quarter | |
| millions of Canadian dollars | 2022 | 2021 |
| Cash flow generated from (used in): |
|
|
| Operating activities | 1,914 | 1,045 |
| Investing activities | (279) | (147) |
| Financing activities | (639) | (202) |
| Increase (decrease) in cash and cash equivalents | 996 | 696 |
|
|
|
|
| Cash and cash equivalents at period end | 3,149 | 1,467 |
Cash flow generated from operating activities primarily reflects higher Upstream realizations, improved Downstream margins, and favourable working capital impacts.
Cash flow used in investing activities primarily reflects higher additions to property, plant and equipment.
Cash flow used in financing activities primarily reflects:
|
| First Quarter | |
| millions of Canadian dollars, unless noted | 2022 | 2021 |
| Dividends paid | 185 | 162 |
| Per share dividend paid (dollars) | 0.27 | 0.22 |
| Share repurchases (a) | 449 | - |
| Number of shares purchased (millions) (a) | 8.9 | - |
| (a) Share repurchases were made under the company's normal course issuer bid program, and include shares purchased from Exxon Mobil Corporation concurrent with, but outside of the normal course issuer bid. | ||
The company completed share repurchases under its normal course issuer bid on January 31, 2022. The company did not purchase shares during the first quarter of 2021.
On April 29, 2022 the company announced its intention to launch a substantial issuer bid pursuant to which the company will offer to purchase for cancellation up to $2,500,000,000 of its common shares. The substantial issuer bid will be made through a modified Dutch auction, with a tender price range to be determined by the company at the time of commencement of the offer. Shares may also be tendered by way of a proportionate tender, which will result in a shareholder maintaining their proportionate share ownership. ExxonMobil has advised Imperial that it intends to make a proportionate tender in connection with the offer in order to maintain its proportionate share ownership at approximately 69.6 percent following completion of the offer. Nothing in this report shall constitute an offer to purchase or a solicitation of an offer to sell any shares.
Key financial and operating data follow.
Additional information regarding the tender offer
The tender offer described in this communication (the "Offer") has not yet commenced. This communication is for informational purposes only. This communication is not a recommendation to buy or sell Imperial Oil Limited shares or any other securities, and it is neither an offer to purchase nor a solicitation of an offer to sell Imperial Oil Limited Shares or any other securities.
On the commencement date of the Offer, Imperial Oil Limited will file an offer to purchase, accompanying issuer bid circular and related letter of transmittal and notice of guaranteed delivery (the "Offering Documents") with Canadian securities regulatory authorities and mail these to the company's shareholders. The company will also file a tender offer statement on Schedule TO, including the Offering Documents, with the United States Securities and Exchange Commission (the "SEC"). The Offer will only be made pursuant to the Offering Documents filed with Canadian securities regulatory authorities and as a part of the Schedule TO. Shareholders should read carefully the Offering Documents because they contain important information, including the various terms of, and conditions to, the Offer. Once the Offer is commenced, shareholders will be able to obtain a free copy of the tender offer statement on Schedule TO, the Offering Documents and other documents that Imperial Oil Limited will be filing with the SEC at the SEC's website at www.sec.gov , with Canadian securities regulatory authorities at www.sedar.com , or from Imperial Oil Limited's website at www.imperialoil.ca .
Forward-looking statements
Statements of future events or conditions in this report, including projections, targets, expectations, estimates, and business plans are forward-looking statements. Forward-looking statements can be identified by words such as believe, anticipate, intend, propose, plan, goal, seek, project, predict, target, estimate, expect, strategy, outlook, schedule, future, continue, likely, may, should, will and similar references to future periods. Forward-looking statements in this report include, but are not limited to, references to the company's intention to initiate a substantial issuer bid, including the size, timing for determining the terms and pricing and commencement, structure and ExxonMobil's intent to make a proportionate tender; being well positioned to generate substantial free cash flow in 2022; anticipated cost reductions from the Sarnia Products Pipeline; continuing to advance lower emissions solutions in support of the company's sustainability goals, and benefit from collaboration and research and development; oil sands greenhouse gas intensity reduction goal of 30 percent by 2030; the Oil Sands Pathways to Net Zero alliance goal to achieve net zero greenhouse gas emissions from oil sands operations by 2050; continuing to progress the Strathcona renewal diesel manufacturing facility and its potential impact; the impact of leveraging the Syncrude interconnect pipeline; the marketing process for XTO Energy Canada, including evaluation of bids and operations continuing as normal throughout the marketing process; and the expanded partnership with Loblaw's PC Optimum program.
Forward-looking statements are based on the company's current expectations, estimates, projections and assumptions at the time the statements are made. Actual future financial and operating results, including expectations and assumptions concerning demand growth and energy source, supply and mix; production rates, growth and mix across various assets; project plans, timing, costs, technical evaluations and capacities and the company's ability to effectively execute on these plans and operate its assets, including factors influencing a final investment decision for the renewable diesel complex at Strathcona; the adoption and impact of new facilities or technologies on reductions to GHG emissions intensity, including but not limited to Strathcona renewable diesel, solvent technologies to replace energy intensive steam at Cold Lake, boiler flue gas technology at Kearl, and support for and advancement of carbon capture and storage, and any changes in the scope, terms, or costs of such projects; the amount and timing of emissions reductions; receipt of regulatory approvals; support from policymakers and other stakeholders for various new technologies such as carbon capture and storage; that the necessary exemptive relief to proceed with the substantial issuer bid under applicable securities laws will be received on the timeline anticipated; ExxonMobil making a proportionate tender in connection with the substantial issuer bid; applicable laws and government policies, including with respect to climate change and GHG emissions reductions; capital and environmental expenditures; progression of COVID-19 and its impacts on Imperial's ability to operate its assets; the company's ability to effectively execute on its business continuity plans and pandemic response activities; and commodity prices, foreign exchange rates and general market conditions could differ materially depending on a number of factors.
These factors include global, regional or local changes in supply and demand for oil, natural gas, and petroleum and petrochemical products and resulting price, differential and margin impacts, including foreign government action with respect to supply levels and prices, the impact of COVID-19 on demand and the occurrence of wars; availability and allocation of capital; the receipt, in a timely manner, of regulatory and third-party approvals; the results of research programs and new technologies, the ability to bring new technologies to commercial scale on a cost-competitive basis, and the competitiveness of alternative energy and other emission reduction technologies; lack of required support from governments and policymakers for adoption of new technologies for emissions reductions; unanticipated technical or operational difficulties; project management and schedules and timely completion of projects; availability and performance of third-party service providers, including in light of restrictions related to COVID-19; environmental risks inherent in oil and gas exploration and production activities; political or regulatory events, including changes in law or government policy, environmental regulation including climate change and greenhouse gas regulation, and actions in response to COVID-19; management effectiveness and disaster response preparedness, including business continuity plans in response to COVID-19; operational hazards and risks; cybersecurity incidents, including increased reliance on remote working arrangements; currency exchange rates; general economic conditions; and other factors discussed in Item 1A risk factors and Item 7 management's discussion and analysis of financial condition and results of operations of Imperial Oil Limited's most recent annual report on Form 10-K.
Forward-looking statements are not guarantees of future performance and involve a number of risks and uncertainties, some that are similar to other oil and gas companies and some that are unique to Imperial Oil Limited. Imperial's actual results may differ materially from those expressed or implied by its forward-looking statements and readers are cautioned not to place undue reliance on them. Imperial undertakes no obligation to update any forward-looking statements contained herein, except as required by applicable law.
In this release all dollar amounts are expressed in Canadian dollars unless otherwise stated. This release should be read in conjunction with Imperial's most recent Form 10-K. Note that numbers may not add due to rounding.
The term "project" as used in this release can refer to a variety of different activities and does not necessarily have the same meaning as in any government payment transparency reports.
|
|
|
|
|
|
|
|
|
|
| Attachment I | ||
|
|
|
|
|
|
|
|
|
|
| Three Months | ||
| millions of Canadian dollars, unless noted |
|
|
| 2022 | 2021 |
|
|
|
|
|
|
|
| Net Income (loss) (U.S. GAAP) |
|
|
|
|
|
| Total revenues and other income |
|
|
| 12,686 | 6,998 |
| Total expenses |
|
|
| 11,152 | 6,486 |
| Income (loss) before income taxes |
|
|
| 1,534 | 512 |
| Income taxes |
|
|
| 361 | 120 |
| Net income (loss) |
|
|
| 1,173 | 392 |
|
|
|
|
|
|
|
| Net income (loss) per common share (dollars) |
|
|
| 1.75 | 0.53 |
| Net income (loss) per common share - assuming dilution (dollars) |
|
|
| 1.75 | 0.53 |
|
|
|
|
|
|
|
| Other Financial Data |
|
|
|
|
|
| Gain (loss) on asset sales, after tax |
|
|
| 16 | 2 |
|
|
|
|
|
|
|
| Total assets at March 31 |
|
|
| 43,810 | 39,007 |
|
|
|
|
|
|
|
| Total debt at March 31 |
|
|
| 5,171 | 5,144 |
|
|
|
|
|
|
|
| Shareholders' equity at March 31 |
|
|
| 22,276 | 21,736 |
|
|
|
|
|
|
|
| Capital employed at March 31 |
|
|
| 27,471 | 26,906 |
|
|
|
|
|
|
|
| Dividends declared on common stock |
|
|
|
|
|
| Total |
|
|
| 228 | 161 |
| Per common share (dollars) |
|
|
| 0.34 | 0.22 |
|
|
|
|
|
|
|
| Millions of common shares outstanding |
|
|
|
|
|
| At March 31 |
|
|
| 669.1 | 734.1 |
| Average - assuming dilution |
|
|
| 671.9 | 735.7 |
|
|
|
|
|
|
|
|
|
|
|
|
|
|
|
|
|
| Attachment II | ||
|
|
|
|
|
|
|
|
|
|
| Three Months | ||
| millions of Canadian dollars |
|
|
| 2022 | 2021 |
|
|
|
|
|
|
|
| Total cash and cash equivalents at period end |
|
|
| 3,149 | 1,467 |
|
|
|
|
|
|
|
| Operating Activities |
|
|
|
|
|
| Net income (loss) |
|
|
| 1,173 | 392 |
| Adjustments for non-cash items: |
|
|
|
|
|
| Depreciation and depletion |
|
|
| 426 | 494 |
| (Gain) loss on asset sales |
|
|
| (20) | (3) |
| Deferred income taxes and other |
|
|
| (331) | 60 |
| Changes in operating assets and liabilities |
|
|
| 695 | (23) |
| All other items - net |
|
|
| (29) | 125 |
| Cash flows from (used in) operating activities |
|
|
| 1,914 | 1,045 |
|
|
|
|
|
|
|
| Investing Activities |
|
|
|
|
|
| Additions to property, plant and equipment |
|
|
| (304) | (167) |
| Proceeds from asset sales |
|
|
| 24 | 7 |
| Loans to equity companies - net |
|
|
| 1 | 13 |
| Cash flows from (used in) investing activities |
|
|
| (279) | (147) |
|
|
|
|
|
|
|
| Cash flows from (used in) financing activities |
|
|
| (639) | (202) |
|
|
|
|
|
|
|
|
|
|
|
|
|
|
|
|
|
| Attachment III | ||
|
|
|
|
|
|
|
|
|
|
| Three Months | ||
| millions of Canadian dollars |
|
|
| 2022 | 2021 |
|
|
|
|
|
|
|
| Net income (loss) (U.S. GAAP) |
|
|
|
|
|
| Upstream |
|
|
| 782 | 79 |
| Downstream |
|
|
| 389 | 292 |
| Chemical |
|
|
| 56 | 67 |
| Corporate and other |
|
|
| (54) | (46) |
| Net income (loss) |
|
|
| 1,173 | 392 |
|
|
|
|
|
|
|
| Revenues and other income |
|
|
|
|
|
| Upstream |
|
|
| 4,534 | 3,493 |
| Downstream |
|
|
| 14,045 | 5,305 |
| Chemical |
|
|
| 471 | 376 |
| Eliminations / Corporate and other |
|
|
| (6,364) | (2,176) |
| Revenues and other income |
|
|
| 12,686 | 6,998 |
|
|
|
|
|
|
|
| Purchases of crude oil and products |
|
|
|
|
|
| Upstream |
|
|
| 1,890 | 1,834 |
| Downstream |
|
|
| 12,512 | 4,020 |
| Chemical |
|
|
| 315 | 209 |
| Eliminations |
|
|
| (6,367) | (2,176) |
| Purchases of crude oil and products |
|
|
| 8,350 | 3,887 |
|
|
|
|
|
|
|
| Production and manufacturing |
|
|
|
|
|
| Upstream |
|
|
| 1,249 | 1,109 |
| Downstream |
|
|
| 356 | 326 |
| Chemical |
|
|
| 54 | 50 |
| Eliminations |
|
|
| - | - |
| Production and manufacturing |
|
|
| 1,659 | 1,485 |
|
|
|
|
|
|
|
| Selling and general |
|
|
|
|
|
| Upstream |
|
|
| - | - |
| Downstream |
|
|
| 147 | 133 |
| Chemical |
|
|
| 23 | 25 |
| Eliminations / Corporate and other |
|
|
| 55 | 31 |
| Selling and general |
|
|
| 225 | 189 |
|
|
|
|
|
|
|
| Capital and exploration expenditures |
|
|
|
|
|
| Upstream |
|
|
| 222 | 85 |
| Downstream |
|
|
| 68 | 68 |
| Chemical |
|
|
| 1 | 2 |
| Corporate and other |
|
|
| 5 | 8 |
| Capital and exploration expenditures |
|
|
| 296 | 163 |
|
|
|
|
|
|
|
| Exploration expenses charged to Upstream income included above |
|
|
| 2 | 2 |
|
|
|
|
|
|
|
|
|
|
|
|
|
|
|
|
| Attachment IV | |||
|
|
|
|
|
|
|
| Operating statistics |
|
| Three Months | ||
|
|
|
|
| 2022 | 2021 |
|
|
|
|
|
|
|
| Gross crude oil and natural gas liquids (NGL) production |
|
|
|
|
|
| (thousands of barrels per day) |
|
|
|
|
|
| Kearl |
|
|
| 132 | 178 |
| Cold Lake |
|
|
| 140 | 140 |
| Syncrude (a) |
|
|
| 77 | 79 |
| Conventional |
|
|
| 11 | 11 |
| Total crude oil production |
|
|
| 360 | 408 |
| NGLs available for sale |
|
|
| 2 | 2 |
| Total crude oil and NGL production |
|
|
| 362 | 410 |
|
|
|
|
|
|
|
| Gross natural gas production (millions of cubic feet per day) |
|
|
| 110 | 131 |
|
|
|
|
|
|
|
| Gross oil-equivalent production (b) |
|
|
| 380 | 432 |
| (thousands of oil-equivalent barrels per day) |
|
|
|
|
|
|
|
|
|
|
|
|
| Net crude oil and NGL production (thousands of barrels per day) |
|
|
|
|
|
| Kearl |
|
|
| 123 | 173 |
| Cold Lake |
|
|
| 107 | 112 |
| Syncrude (a) |
|
|
| 59 | 74 |
| Conventional |
|
|
| 11 | 11 |
| Total crude oil production |
|
|
| 300 | 370 |
| NGLs available for sale |
|
|
| 1 | 2 |
| Total crude oil and NGL production |
|
|
| 301 | 372 |
|
|
|
|
|
|
|
| Net natural gas production (millions of cubic feet per day) |
|
|
| 107 | 127 |
|
|
|
|
|
|
|
| Net oil-equivalent production (b) |
|
|
| 319 | 393 |
| (thousands of oil-equivalent barrels per day) |
|
|
|
|
|
|
|
|
|
|
|
|
| Kearl blend sales (thousands of barrels per day) |
|
|
| 189 | 248 |
| Cold Lake blend sales (thousands of barrels per day) |
|
|
| 187 | 182 |
| NGL sales (thousands of barrels per day) (c) |
|
|
| 1 | - |
|
|
|
|
|
|
|
| Average realizations (Canadian dollars) |
|
|
|
|
|
| Bitumen (per barrel) |
|
|
| 89.36 | 47.19 |
| Synthetic crude oil (per barrel) |
|
|
| 117.24 | 67.41 |
| Conventional crude oil (per barrel) |
|
|
| 98.38 | 49.54 |
| NGL (per barrel) |
|
|
| 59.27 | 31.16 |
| Natural gas (per thousand cubic feet) |
|
|
| 5.08 | 3.24 |
|
|
|
|
|
|
|
| Refinery throughput (thousands of barrels per day) |
|
|
| 399 | 364 |
| Refinery capacity utilization (percent) |
|
|
| 93 | 85 |
|
|
|
|
|
|
|
| Petroleum product sales (thousands of barrels per day) |
|
|
|
|
|
| Gasolines |
|
|
| 209 | 198 |
| Heating, diesel and jet fuels |
|
|
| 173 | 153 |
| Lube oils and other products |
|
|
| 48 | 43 |
| Heavy fuel oils |
|
|
| 17 | 20 |
| Net petroleum products sales |
|
|
| 447 | 414 |
|
|
|
|
|
|
|
| Petrochemical sales (thousands of tonnes) |
|
|
| 210 | 211 |
|
|
|
|
|
|
|
| (a) | In the first quarter of 2022, Syncrude (Imperial's share) gross and net production included about 1 thousand barrels per day of bitumen (2021 - rounded to 0 thousand barrels per day) that was exported to the operator's facilities using an existing interconnect pipeline. | |
| (b) | Gas converted to oil-equivalent at six million cubic feet per one thousand barrels. | |
| (c) | NGL sales round to 0 in 2021. |
|
|
|
|
|
|
|
|
|
|
|
|
|
| Attachment V | |||
|
|
|
|
|
|
|
|
|
|
|
|
|
|
| Net income (loss) per | ||
|
|
| Net income (loss) (U.S. GAAP) | common share - diluted (a) | ||||
|
|
| millions of Canadian dollars |
|
| Canadian dollars | ||
|
|
|
|
|
|
|
|
|
| 2018 |
|
|
|
|
| ||
| First Quarter | 516 |
|
|
| 0.62 | ||
| Second Quarter | 196 |
|
|
| 0.24 | ||
| Third Quarter | 749 |
|
|
| 0.94 | ||
| Fourth Quarter | 853 |
|
|
| 1.08 | ||
| Year | 2,314 |
|
|
| 2.86 | ||
|
|
|
|
|
|
|
|
|
| 2019 |
|
|
|
|
| ||
| First Quarter | 293 |
|
|
| 0.38 | ||
| Second Quarter | 1,212 |
|
|
| 1.57 | ||
| Third Quarter | 424 |
|
|
| 0.56 | ||
| Fourth Quarter | 271 |
|
|
| 0.36 | ||
| Year | 2,200 |
|
|
| 2.88 | ||
|
|
|
|
|
|
|
|
|
| 2020 |
|
|
|
|
| ||
| First Quarter | (188) |
|
|
| (0.25) | ||
| Second Quarter | (526) |
|
|
| (0.72) | ||
| Third Quarter | 3 |
|
|
| - | ||
| Fourth Quarter | (1,146) |
|
|
| (1.56) | ||
| Year | (1,857) |
|
|
| (2.53) | ||
|
|
|
|
|
|
|
|
|
| 2021 |
|
|
|
|
| ||
| First Quarter | 392 |
|
|
| 0.53 | ||
| Second Quarter | 366 |
|
|
| 0.50 | ||
| Third Quarter | 908 |
|
|
| 1.29 | ||
| Fourth Quarter | 813 |
|
|
| 1.18 | ||
| Year | 2,479 |
|
|
| 3.48 | ||
|
|
|
|
|
|
|
|
|
| 2022 |
|
|
|
|
| ||
| First Quarter | 1,173 |
|
|
| 1.75 | ||
| (a) | Computed using the average number of shares outstanding during each period. The sum of the quarters presented may not add to the year total. | ||||||
Attachment VI
Non-GAAP financial measures and other specified financial measures
Certain measures included in this document are not prescribed by U.S. Generally Accepted Accounting Principles (GAAP). These measures constitute "non-GAAP financial measures" under Securities and Exchange Commission Regulation G, and "specified financial measures" under National Instrument 52-112 Non-GAAP and Other Financial Measures Disclosure of the Canadian Securities Administrators.
Reconciliation of these non-GAAP financial measures to the most comparable GAAP measure, and other information required by these regulations have been provided. Non-GAAP financial measures and specified financial measures are not standardized financial measures under GAAP and do not have a standardized definition. As such, these measures may not be directly comparable to measures presented by other companies, and should not be considered a substitute for GAAP financial measures.
Cash flows from (used in) operating activities excluding working capital
Cash flows from (used in) operating activities excluding working capital is a non-GAAP financial measure that is the total cash flows from operating activities less the changes in operating assets and liabilities in the period. The most directly comparable financial measure that is disclosed in the financial statements is cash flows from (used in) operating activities within the company's Consolidated statement of cash flows. Management believes it is useful for investors to consider these numbers in comparing the underlying performance of the company's business across periods when there are significant period-to-period differences in the amount of changes in working capital. Changes in working capital is equal to "Changes in operating assets and liabilities" as disclosed in the company's Consolidated statement of cash flows and in Attachment II of this document. This measure assesses the cash flows at an operating level, and as such, does not include proceeds from asset sales as defined in Cash flows from operating activities and asset sales in the Frequently Used Terms section of the company's annual Form 10-K.
Reconciliation of cash flows from (used in) operating activities excluding working capital
|
|
|
|
|
| Three Months | |
| millions of Canadian dollars |
|
|
| 2022 | 2021 | |
| From Imperial's Consolidated statement of cash flows |
|
|
|
|
| |
| Cash flows from (used in) operating activities |
|
|
| 1,914 | 1,045 | |
|
|
|
|
|
|
|
|
| Less changes in working capital |
|
|
|
|
| |
| Changes in operating assets and liabilities |
|
|
| 695 | (23) | |
| Cash flows from (used in) operating activities excl. working capital |
|
|
| 1,219 | 1,068 | |
Free cash flow
Free cash flow is a non-GAAP financial measure that is cash flows from operating activities less additions to property, plant and equipment and equity company investments plus proceeds from asset sales. The most directly comparable financial measure that is disclosed in the financial statements is cash flows from (used in) operating activities within the company's Consolidated statement of cash flows. This measure is used to evaluate cash available for financing activities (including but not limited to dividends and share purchases) after investment in the business.
Reconciliation of free cash flow
|
|
|
|
| Three Months | |
| millions of Canadian dollars |
|
|
| 2022 | 2021 |
| From Imperial's Consolidated statement of cash flows |
|
|
|
|
|
| Cash flows from (used in) operating activities |
|
|
| 1,914 | 1,045 |
|
|
|
|
|
|
|
| Cash flows from (used in) investing activities |
|
|
|
|
|
| Additions to property, plant and equipment |
|
|
| (304) | (167) |
| Proceeds from asset sales |
|
|
| 24 | 7 |
| Loans to equity companies - net |
|
|
| 1 | 13 |
| Free cash flow |
|
|
| 1,635 | 898 |
Net income (loss) excluding identified items
Net income (loss) excluding identified items is a non-GAAP financial measure that is total net income (loss) excluding individually significant non-operational events with an absolute corporate total earnings impact of at least $100 million in a given quarter. The net income (loss) impact of an identified item for an individual segment in a given quarter may be less than $100 million when the item impacts several segments or several periods. The most directly comparable financial measure that is disclosed in the financial statements is net income (loss) within the company's Consolidated statement of income. Management uses these figures to improve comparability of the underlying business across multiple periods by isolating and removing significant non-operational events from business results. The company believes this view provides investors increased transparency into business results and trends, and provides investors with a view of the business as seen through the eyes of management. Net income (loss) excluding identified items is not meant to be viewed in isolation or as a substitute for net income (loss) as prepared in accordance with U.S. GAAP. All identified items are presented on an after-tax basis.
Reconciliation of net income (loss) excluding identified items
There were no identified items in the first quarter of 2022 and 2021.
Cash operating costs (cash costs)
Cash operating costs is a non-GAAP financial measure that consists of total expenses, less costs that are non-cash in nature, including, Purchases of crude oil and products, Federal excise taxes and fuel charge, Depreciation and depletion, Non-service pension and postretirement benefit, and Financing. The components of cash operating costs include (1) Production and manufacturing, (2) Selling and general and (3) Exploration, from the company's Consolidated statement of income, and as disclosed in Attachment III of this document. The sum of these income statement lines serve as an indication of cash operating costs and does not reflect the total cash expenditures of the company. The most directly comparable financial measure that is disclosed in the financial statements is total expenses within the company's Consolidated statement of income. This measure is useful for investors to understand the company's efforts to optimize cash through disciplined expense management.
| Reconciliation of cash operating costs |
|
|
|
|
|
|
|
|
|
| Three Months | |
| millions of Canadian dollars |
|
|
| 2022 | 2021 |
| From Imperial's Consolidated statement of Income |
|
|
|
|
|
| Total expenses |
|
|
| 11,152 | 6,486 |
| Less: |
|
|
|
|
|
| Purchases of crude oil and products |
|
|
| 8,350 | 3,887 |
| Federal excise taxes and fuel charge |
|
|
| 479 | 404 |
| Depreciation and depletion |
|
|
| 426 | 494 |
| Non-service pension and postretirement benefit |
|
|
| 4 | 11 |
| Financing |
|
|
| 7 | 14 |
| Total cash operating costs |
|
|
| 1,886 | 1,676 |
|
|
|
|
|
|
|
| Components of cash operating costs |
|
|
|
|
|
|
|
|
|
| Three Months | |
| millions of Canadian dollars |
|
|
| 2022 | 2021 |
| From Imperial's Consolidated statement of Income |
|
|
|
|
|
| Production and manufacturing |
|
|
| 1,659 | 1,485 |
| Selling and general |
|
|
| 225 | 189 |
| Exploration |
|
|
| 2 | 2 |
| Cash operating costs |
|
|
| 1,886 | 1,676 |
|
|
|
|
|
|
|
| Segment contributions to total cash operating costs |
|
|
|
|
|
|
|
|
|
| Three Months | |
| millions of Canadian dollars |
|
|
| 2022 | 2021 |
| Upstream |
|
|
| 1,251 | 1,111 |
| Downstream |
|
|
| 503 | 459 |
| Chemicals |
|
|
| 77 | 75 |
| Corporate/Eliminations |
|
|
| 55 | 31 |
| Cash operating costs |
|
|
| 1,886 | 1,676 |
Unit cash operating cost (unit cash costs)
Unit cash operating costs is a non-GAAP ratio. Unit cash operating costs (unit cash costs) is calculated by dividing cash operating costs by total gross oil-equivalent production, and is calculated for the Upstream segment, as well as the major Upstream assets. Cash operating costs is a non-GAAP financial measure and is disclosed and reconciled above. This measure is useful for investors to understand the expense management efforts of the company's major assets as a component of the overall Upstream segment. Unit cash operating cost, as used by management, does not directly align with the definition of "Average unit production costs" as set out by the U.S. Securities and Exchange Commission (SEC), and disclosed in the company's SEC Form 10-K.
Components of unit cash operating cost
|
| Three Months | ||||||||
|
| 2022 |
| 2021 | ||||||
| millions of Canadian dollars | Upstream (a) | Kearl | Cold Lake | Syncrude |
| Upstream (a) | Kearl | Cold Lake | Syncrude |
| Production and manufacturing | 1,249 | 521 | 322 | 348 |
| 1,109 | 455 | 260 | 333 |
| Selling and general | - | - | - | - |
| - | - | - | - |
| Exploration | 2 | - | - | - |
| 2 | - | - | - |
| Cash operating costs | 1,251 | 521 | 322 | 348 |
| 1,111 | 455 | 260 | 333 |
|
|
|
|
|
|
|
|
|
|
|
| Gross oil-equivalent production | 380 | 132 | 140 | 77 |
| 432 | 178 | 140 | 79 |
| (thousands of barrels per day) |
|
|
|
|
|
|
|
|
|
|
|
|
|
|
|
|
|
|
|
|
| Unit cash operating cost ($/oeb) | 36.58 | 43.86 | 25.56 | 50.22 |
| 28.58 | 28.40 | 20.63 | 46.84 |
| USD converted at the YTD average forex | 28.90 | 34.65 | 20.19 | 39.67 |
| 22.57 | 22.44 | 16.30 | 37.00 |
| 2022 US$0.79; 2021 US$0.79 |
|
|
|
|
|
|
|
|
|
|
|
|
|
|
|
|
|
|
|
|
| (a) Upstream includes Kearl, Cold Lake, Imperial's share of Syncrude and other. | |||||||||
After more than a century, Imperial continues to be an industry leader in applying technology and innovation to responsibly develop Canada's energy resources. As Canada's largest petroleum refiner, a major producer of crude oil, a key petrochemical producer and a leading fuels marketer from coast to coast, our company remains committed to high standards across all areas of our business.
Source: Imperial
View source version on businesswire.com: https://www.businesswire.com/news/home/20220429005123/en/
Investor relations
(587) 476-4743
Media relations
(587) 476-7010