Coelacanth Energy Inc. (TSXV: CEI,OTC:CEIEF) ("Coelacanth" or the "Company") has provided an Operations Update, Reserve Report, and Resource Report.
OPERATIONS UPDATE
Coelacanth Energy (TSXV:CEI) is a junior oil and natural gas exploration and development company exploring the prolific Montney region in northeastern British Columbia, Canada. Coelacanth is strategically positioned to harness the potential of one of the most resource-rich natural gas basins in North America with a substantial landholding of approximately 150 net sections in the Two Rivers area of Montney.
The company is in the process of deploying $ 80 million to facilitate the smooth transition from exploration to production. Coelacanth’s financial health is further evidenced by its $64.4 million in working capital as of Q2 2024.
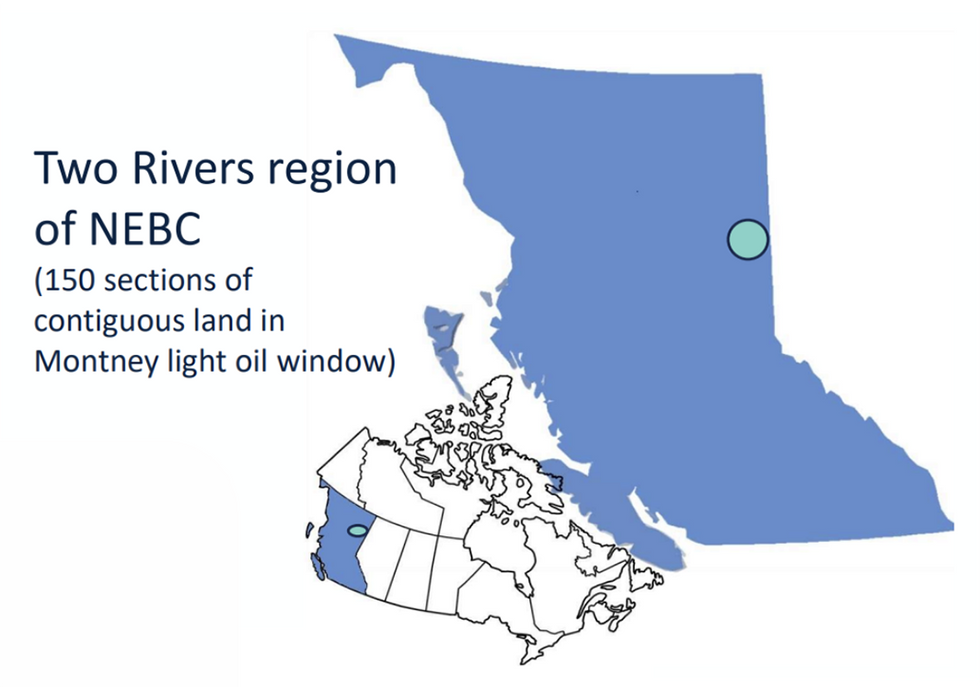
Coelacanth’s landholdings are strategically located in the Two Rivers area of Montney, giving it access to a highly productive portion of the basin. Unlike many junior exploration companies, Coelacanth is drill-ready, positioning it favorably among its peers. By securing significant infrastructure and landholdings, Coelacanth ensures its ability to tap into the natural gas and oil resources that lie beneath its properties, a key advantage in the competitive Montney region.
This Coelacanth Energy profile is part of a paid investor education campaign.*
Click here to connect with Coelacanth Energy (TSXV:CEI) to receive an Investor Presentation
Coelacanth Energy presents strong growth potential in the Canadian light oil and natural gas sector with encouraging well test results, a robust infrastructure buildout, and a management team with a track record of repeated success, making it a compelling growth story.
Coelacanth Energy (TSXV:CEI) is a junior oil and natural gas exploration and development company, focusing primarily on the prolific Montney region in northeastern British Columbia, Canada. With a substantial landholding of approximately 150 net sections in the Two Rivers area of Montney, Coelacanth is strategically positioned to harness the potential of one of the most resource-rich natural gas basins in North America.
Coelacanth distinguishes itself with a two-pronged strategy: near-term production growth and long-term resource development. Supported by advanced geological delineation and a robust infrastructure buildout, the company is poised to scale efficiently as it transitions from exploration to production.
Backed by a management team that has built and sold six successful oil and gas companies, Coelacanth is focused on delivering returns through disciplined capital deployment and operational execution.
The Montney Formation spans British Columbia and Alberta and is known for its high levels of recoverable natural gas and liquids. Montney has attracted numerous large oil and gas producers, including companies like Canadian Natural Resources (CNQ), Shell, ARC Resources (ARX), Tourmaline Oil Corp (TOU), and ConocoPhillips (COP). The presence of such large players highlights the importance of this region in contributing to both the Canadian and global energy markets.
Coelacanth’s landholdings are strategically located in the Two Rivers area of Montney, giving it access to a highly productive portion of the basin. Unlike many junior exploration companies, Coelacanth is drill-ready, positioning it favorably among its peers. By securing significant infrastructure and landholdings, Coelacanth ensures its ability to tap into the natural gas and oil resources that lie beneath its properties, a key advantage in the competitive Montney region.
The Two Rivers Montney development is the cornerstone of Coelacanth’s growth strategy. This multi-zone resource play features Lower, Upper, Basal and Middle Montney formations, offering significant running room for future development. The company has drilled and tested nine wells on the 5-19 pad (seven Lower Montney, one Upper, one Basal), yielding impressive flush production test rates totaling more than 11,000 boe/d, on a combined basis. Some wells tested at over 1,200 boepd with 50 percent light oil, highlighting strong liquids yields.
Two Rivers Asset Advantage
Two Rivers East started first production in June 2025, with production to be systematically ramped up over the summer. This production is supported by a new Phase 1 facility capable of processing 30 mmcf/d of gas and associated oil. Phase 2, planned for late 2025, will double capacity with added compression.
The Two Rivers West project, already in production, complements the East project with upside in the Upper Montney and delineation potential across additional benches. Test wells have demonstrated commercial deliverability and support long-term production sustainability.
Coelacanth has secured long-term gas takeaway for its growing production base. The company holds firm commitments for up to 100 mmcf/d of natural gas takeaway capacity and has secured processing capacity of up to 60 mmcf/d at a third-party facility. Oil and condensate produced from the Montney light oil window can be trucked to regional terminals or connected via infrastructure to major hubs including Fort Saskatchewan, Edmonton and Prince George.
On the gas side, Coelacanth has egress options through pipelines such as NGTL, Westcoast and Alliance, and is strategically positioned to benefit from future access to LNG Canada via the Coastal GasLink system.
Rob Zakresky has a significant background in the oil and gas sector, previously serving as the president and CEO of Leucrotta Exploration as well as five additional predecessor companies. He has been with Coelacanth Energy since its inception and is recognized for his strategic leadership and focus on enhancing shareholder value. His expertise in financial management and operations is reflected in his approach to driving the company's growth.
Bret Kimpton joined Coelacanth Energy in 2022, bringing a wealth of experience from his previous role as vice president of production at Storm Resources, where he contributed to significant production growth. He has a strong background in construction and operations, especially in the Montney region of British Columbia, managing various fields. His role at Coelacanth focuses on overseeing operational efficiency and implementing the company's growth strategies.
Nolan Chicoine has also been with Coelacanth Energy since its inception. His responsibilities encompass financial oversight, including financial planning, reporting, and analysis. He plays a crucial role in aligning the financial strategies with the company's operational goals. His background includes significant experience in financial management as CFO for Leucrotta Exploration, Crocotta Energy, and Chamaelo Energy.
Jody Denis is the former drilling, engineering & operations engineer at Leucrotta Exploration. Prior to that, he was senior operations advisor at Black Swan Energy, drilling manager at ARC Resources, and drilling and completions manager at Birchcliff Energy.
John Fur is the former manager, exploration of Leucrotta Exploration, and former senior geophysicist at Crocotta Energy, Chamaelo Energy, Chamaelo Exploration, Viracocha Energy, Canadian Natural Resources, Post Energy, Amber Energy and Husky Oil.
Light oil & Natural gas exploration and production in the prolific Montney region in British Columbia
Coelacanth Energy Inc. (TSXV: CEI,OTC:CEIEF) ("Coelacanth" or the "Company") has provided an Operations Update, Reserve Report, and Resource Report.
OPERATIONS UPDATE
Coelacanth completed and commissioned its new battery facility in early June and subsequently started to systematically place the 9 previously drilled Montney wells from the 5-19 pad on production. Although Coelacanth has chosen to moderate the pace of wells brought on-stream because of low natural gas prices at the Station 2 hub, the results to date have exceeded expectations.
Lower Montney
Three Lower Montney wells (D5-19, E5-19, F5-19) were placed on production this summer and have meaningful initial production data as follows:
The wells have exceeded initial production on a proved plus probable basis (2P) as booked by GLJ Ltd. ("GLJ") in its independent evaluation for Coelacanth.
GLJ RESERVE REPORT DATED EFFECTIVE JUNE 30, 2025
Coelacanth has updated its previously disclosed 2024 year-end reserves report as independently evaluated by GLJ. The new GLJ reserves report is effective June 30, 2025 and is a mechanical update to the prior report (the "Reserve Report"). The mechanical update does not change the production profiles provided in the 2024 year-end report but does provide the following:
The Report increases the overall reserve value by $40.4 million from the year-end report but more importantly increases the producing status reserves by $107.4 million (estimated future net revenues before taxes discounted at 10%). Coelacanth believes the July 1, 2025 updated GLJ Report better reflects the current status of the Company given the changes as noted above.
Congruent with the prior report, GLJ has placed reserves on less than 10 net sections of land and predominantly in the Lower Montney leaving room to expand the reserve base both aerially and vertically.
Reserves Summary
Coelacanth's June 30, 2025 reserves as prepared by GLJ effective June 30, 2025 and based on the GLJ (2025-07) future price forecast are as follows: (1)
Working Interest Reserves (2) | Tight Oil (Mbbl) | Shale Natural Gas (Mmcf) | NGLs (Mbbl) | Total Oil Equivalent (Mboe) (3) |
Proved | ||||
Producing | 2,017 | 45,129 | 836 | 10,374 |
Developed non-producing | - | - | - | - |
Undeveloped | 1,256 | 28,336 | 525 | 6,504 |
Total proved | 3,273 | 73,465 | 1,361 | 16,878 |
Probable | 2,157 | 44,640 | 827 | 10,424 |
Total proved & probable | 5,430 | 118,105 | 2,188 | 27,302 |
Notes: | |
(1) | Numbers may not add due to rounding. |
(2) | "Working Interest" or "Gross" reserves means Coelacanth's working interest (operating and non-operating) share before deduction of royalties and without including any royalty interest of Coelacanth. |
(3) | Oil equivalent amounts have been calculated using a conversion rate of six thousand cubic feet of natural gas to one barrel of oil. |
Reserves Values
The estimated future net revenues before taxes associated with Coelacanth's reserves effective June 30, 2025 and based on the GLJ (2025-07) future price forecast are summarized in the following table: (1,2,3)
Discount factor per year | |||||
($000s) | 0% | 5% | 10% | 15% | 20% |
Proved | |||||
Producing | 176,441 | 144,557 | 122,202 | 105,937 | 93,680 |
Developed non-producing | - | - | - | - | - |
Undeveloped | 97,882 | 68,628 | 49,981 | 37,384 | 28,424 |
Total proved | 274,323 | 213,185 | 172,183 | 143,321 | 122,104 |
Probable | 214,074 | 146,438 | 107,868 | 83,914 | 67,902 |
Total proved & probable | 488,397 | 359,623 | 280,051 | 227,235 | 190,006 |
Notes: | |
(1) | Numbers may not add due to rounding. |
(2) | The estimated future net revenues are stated prior to provision for interest, debt service charges or general and administrative expenses and after deduction of royalties, operating costs, estimated well abandonment and reclamation costs and estimated future capital expenditures. |
(3) | The estimated future net revenue contained in the table does not necessarily represent the fair market value of the reserves. There is no assurance that the forecast price and cost assumptions contained in the GLJ Report will be attained and variations could be material. The recovery and reserve estimates described herein are estimates only. Actual reserves may be greater or less than those calculated. |
Price Forecast
The GLJ (2025-07) price forecast is as follows:
Year | WTI Oil @ Cushing ($US / Bbl) | Edmonton Light Oil ($Cdn / Bbl) | AECO Natural Gas ($Cdn / Mmbtu) | Chicago Natural Gas ($US / Mmbtu) | Foreign Exchange (Cdn$/US$) |
2025 Q3-Q4 | 65.00 | 84.93 | 2.20 | 3.55 | 0.7300 |
2026 | 70.00 | 90.54 | 3.46 | 4.35 | 0.7400 |
2027 | 73.50 | 94.00 | 3.50 | 4.01 | 0.7500 |
2028 | 76.41 | 96.99 | 3.85 | 4.10 | 0.7500 |
2029 | 77.94 | 98.92 | 3.92 | 4.18 | 0.7500 |
2030 | 79.49 | 100.89 | 4.00 | 4.27 | 0.7500 |
2031 | 81.08 | 102.91 | 4.08 | 4.35 | 0.7500 |
2032 | 82.71 | 104.99 | 4.16 | 4.45 | 0.7500 |
2033 | 84.36 | 107.08 | 4.25 | 4.54 | 0.7500 |
2034 | 86.05 | 109.21 | 4.33 | 4.63 | 0.7500 |
Escalate thereafter (1) | 2.0% per year | 2.0% per year | 2.0% per year | 2.0% per year |
(1) | Escalated at two per cent per year starting in 2035 in the July 1, 2025 GLJ price forecast with the exception of foreign exchange, which remains flat. |
GLJ RESOURCE REPORT
GLJ has provided a Resource Report effective June 30, 2025 on Coelacanth's Two Rivers Montney lands encompassing approximately 150 net sections over 4 identified Montney zones (the "Resource Report"). As displayed below, Coelacanth has an estimated 6.9 billion barrels of Discovered Petroleum Initially-In-Place (PIIP) and 5.9 trillion cubic feet of Discovered Gas PIIP. The Resource Report also estimates 8.3 billion barrels of Undiscovered Petroleum PIIP and 7.1 trillion cubic feet of Undiscovered Gas PIIP in place on its lands.
To date, Coelacanth has focused to varying degrees on 3 of the 4 Montney zones (Upper, Lower, Basal) with extensive mapping, core work, and placement of horizontal wells in all 3 zones to help determine economics and ultimate recoveries of the resource. The Middle Montney has had minimal work performed on it to date and is listed as undiscovered at this point. Coelacanth will perform additional work on the middle Montney in the future to better understand its commerciality.
The Resource Report not only portrays how large the Coelacanth's Montney resource in place is, but will be used as a tool in determining well spacing, frac design and ultimate well recoveries to aid in the overall development of Coelacanth's Two Rivers project.
Zone | Discovered Oil PIIP (Billion Bbls) | Undiscovered Oil PIIP (Billion Bbls) |
Upper Montney | 2.5 | 0.2 |
Middle Montney | - | 5.0 |
Lower Montney | 3.0 | 0.2 |
Basal Montney | 1.3 | 2.9 |
Total Montney(1) | 6.9 | 8.3 |
(1) | Numbers may not add due to rounding |
Zone | Discovered Gas PIIP (Trillion cubic feet) | Undiscovered Gas PIIP (Trillion cubic feet) |
Upper Montney | 2.1 | 0.1 |
Middle Montney | - | 4.2 |
Lower Montney | 2.6 | 0.2 |
Basal Montney | 1.1 | 2.5 |
Total Montney(1) | 5.9 | 7.1 |
(1) | Numbers may not add due to rounding |
Overall, Coelacanth is very pleased with its well results to date and is looking forward to establishing the ultimate recoverable reserves while increasing booked reserves and on its large Two Rivers Montney Resource for the benefit of its stakeholders.
Oil and Gas Terms
The Company uses the following frequently recurring oil and gas industry terms in the news release:
Liquids | |
Bbls | Barrels |
Bbls/d | Barrels per day |
NGLs | Natural gas liquids (includes condensate, pentane, butane, propane, and ethane) |
WTI | West Texas Intermediate at Cushing, Oklahoma |
Natural Gas | |
Mcf | Thousands of cubic feet |
Mcf/d | Thousands of cubic feet per day |
MMcf/d | Millions of cubic feet per day |
MMbtu | Millions of British thermal units |
Oil Equivalent | |
Boe | Barrels of oil equivalent |
Boe/d | Barrels of oil equivalent per day |
Disclosure provided herein in respect of a boe may be misleading, particularly if used in isolation. A boe conversion rate of six thousand cubic feet of natural gas to one barrel of oil equivalent has been used for the calculation of boe amounts in the news release. This boe conversion rate is based on an energy equivalency conversion method primarily applicable at the burner tip and does not represent a value equivalency at the wellhead.
Product Types
The Company uses the following references to sales volumes in the news release:
Natural gas (and gas) refers to shale gas
Oil refers to tight oil
NGLs refers to butane, propane and pentanes combined
Liquids refers to tight oil and NGLs combined
Oil equivalent refers to the total oil equivalent of shale gas, tight oil, and NGLs combined, using the conversion rate of six thousand cubic feet of shale gas to one barrel of oil equivalent as described above.
Forward-Looking Information
This news release contains forward-looking statements and forward-looking information within the meaning of applicable securities laws. The use of any of the words "expect", "anticipate", "continue", "estimate", "may", "will", "should", "believe", "intends", "forecast", "plans", "guidance" and similar expressions are intended to identify forward-looking statements or information.
More particularly and without limitation, this document contains forward-looking statements and information relating to the Company's oil, NGLs and natural gas production and reserves and reserves values, oil and natural gas resources, capital programs, and oil, NGLs, and natural gas commodity prices. The forward-looking statements and information are based on certain key expectations and assumptions made by the Company, including expectations and assumptions relating to prevailing commodity prices and exchange rates, applicable royalty rates and tax laws, future well production rates, the performance of existing wells, the success of drilling new wells, the availability of capital to undertake planned activities and the availability and cost of labor and services.
Although the Company believes that the expectations reflected in such forward-looking statements and information are reasonable, it can give no assurance that such expectations will prove to be correct. Since forward-looking statements and information address future events and conditions, by their very nature they involve inherent risks and uncertainties. Actual results may differ materially from those currently anticipated due to a number of factors and risks. These include, but are not limited to, the risks associated with the oil and gas industry in general such as operational risks in development, exploration and production, delays or changes in plans with respect to exploration or development projects or capital expenditures, the uncertainty of estimates and projections relating to production rates, costs and expenses, commodity price and exchange rate fluctuations, marketing and transportation, environmental risks, competition, the ability to access sufficient capital from internal and external sources and changes in tax, royalty and environmental legislation. The forward-looking statements and information contained in this document are made as of the date hereof for the purpose of providing the readers with the Company's expectations for the coming year. The forward-looking statements and information may not be appropriate for other purposes. The Company undertakes no obligation to update publicly or revise any forward-looking statements or information, whether as a result of new information, future events or otherwise, unless so required by applicable securities laws.
Resources Data
Total Petroleum Initially-In-Place (PIIP) is that quantity of petroleum that is estimated to exist originally in naturally occurring accumulations. It includes that quantity of petroleum that is estimated, as of a given date, to be contained in known accumulations, prior to production, plus those estimated quantities in accumulations yet to be discovered (equivalent to "total resources").
Discovered Petroleum Initially-In-Place (equivalent to discovered resources) is that quantity of petroleum that is estimated, as of a given date, to be contained in known accumulations prior to production. The recoverable portion of discovered petroleum initially in place includes production, reserves, and contingent resources; the remainder is unrecoverable.
Reserves are estimated remaining quantities of oil and natural gas and related substances anticipated to be recoverable from known accumulations, as of a given date, based on the analysis of drilling, geological, geophysical, and engineering data; the use of established technology; and specified economic conditions, which are generally accepted as being reasonable. Reserves are further classified according to the level of certainty associated with the estimates and may be subclassified based on development and production status. [Reserves are further defined below].
Contingent Resources are those quantities of petroleum estimated, as of a given date, to be potentially recoverable from known accumulations using established technology or technology under development, but which are not currently considered to be commercially recoverable due to one or more contingencies. Contingencies may include factors such as economic, legal, environmental, political, and regulatory matters, or a lack of markets. It is also appropriate to classify as contingent resources the estimated discovered recoverable quantities associated with a project in the early evaluation stage. Contingent Resources are further classified in accordance with the level of certainty associated with the estimates and may be subclassified based on project maturity and/or characterized by their economic status.
Undiscovered Petroleum Initially-In-Place (equivalent to undiscovered resources) is that quantity of petroleum that is estimated, on a given date, to be contained in accumulations yet to be discovered. The recoverable portion of undiscovered petroleum initially in place is referred to as "prospective resources," the remainder as "unrecoverable."
Prospective Resources are those quantities of petroleum estimated, as of a given date, to be potentially recoverable from undiscovered accumulations by application of future development projects. Prospective resources have both an associated chance of discovery and a chance of development. Prospective Resources are further subdivided in accordance with the level of certainty associated with recoverable estimates assuming their discovery and development and may be subclassified based on project maturity.
There is no certainty that any portion of the resources will be discovered. If discovered, there is no certainty that it will be commercially viable to produce any portion of the resources. The key variables relevant to the evaluation are porosity, reservoir thickness, pressure, water saturation and gas composition which have increasing uncertainty, both positive and negative, with distance from existing wells.
Reserves Data
There are numerous uncertainties inherent in estimating quantities of tight oil, shale gas, and NGLs reserves and the future cash flows attributed to such reserves. The reserve and associated cash flow information set forth above are estimates only. In general, estimates of economically recoverable tight oil, shale gas, and NGLs reserves and the future net cash flows therefrom are based upon a number of variable factors and assumptions, such as historical production from the properties, production rates, ultimate reserve recovery, timing and amount of capital expenditures, marketability of oil and natural gas, royalty rates, the assumed effects of regulation by governmental agencies and future operating costs, all of which may vary materially.
Individual properties may not reflect the same confidence level as estimates of reserves for all properties due to the effects of aggregation.
This news release contains estimates of the net present value of the Company's future net revenue from its reserves. Such amounts do not represent the fair market value of the Company's reserves.
The reserves data contained in this news release has been prepared in accordance with National Instrument 51-101 ("NI 51-101").
Reserves are estimated remaining quantities of oil and natural gas and related substances anticipated to be recoverable from known accumulations, as of a given date, based on the analysis of drilling, geological, geophysical and engineering data; the use of established technology, and specified economic conditions, which are generally accepted as being reasonable. Reserves are classified according to the degree of certainty associated with the estimates as follows:
Proved Reserves are those reserves that can be estimated with a high degree of certainty to be recoverable. It is likely that the actual remaining quantities recovered will exceed the estimated proved reserves.
Probable Reserves are those additional reserves that are less certain to be recovered than proved reserves. It is equally likely that the actual remaining quantities recovered will be greater or less than the sum of the estimated proved plus probable reserves.
Initial Production Rates
The D5-19 Lower Montney well was tied into the 16-03 facility, and produced an average rate of 546 bbl/d oil, 2,659 mcf/d natural gas, and 48 bbl/d NGLs, for a total average rate of 1,037 boe/d, on a sales basis, over the first 30 days of in-line production (IP30)
The E5-19 Lower Montney well was tied into the 16-03 facility, and produced an average rate of 854 bbl/d oil, 2,660 mcf/d natural gas, and 49 bbl/d NGLs, for a total average rate of 1,346 boe/d, on a sales basis, over the first 30 days of in-line production (IP30)
The F5-19 Lower Montney well was tied into the 16-03 facility, and produced an average rate of 745 bbl/d oil, 3,121 mcf/d natural gas, and 58 bbl/d NGLs, for a total average rate of 1,037 boe/d, on a sales basis, over the first 22 days of in-line production
Any references to peak rates, test rates, IP30, IP90, IP180 or initial production rates or declines are useful for confirming the presence of hydrocarbons, however, such rates and declines are not determinative of the rates at which such wells will continue production and decline thereafter and are not indicative of long-term performance or ultimate recovery. IP30 is defined as an average production rate over 30 consecutive days, IP90 is defined as an average production rate over 90 consecutive days and IP180 is defined as an average production rate over 180 consecutive days. Readers are cautioned not to place reliance on such rates in calculating aggregate production for the Company.
FOR FURTHER INFORMATION PLEASE CONTACT:
Coelacanth Energy Inc.
2110, 530 - 8th Ave SW
Calgary, Alberta T2P 3S8
Phone: 403-705-4525
www.coelacanth.ca
Mr. Robert J. Zakresky
President and Chief Executive Officer
Mr. Nolan Chicoine
Vice President, Finance and Chief Financial Officer
NEITHER THE TSX VENTURE EXCHANGE NOR ITS REGULATION SERVICES PROVIDER (AS THAT TERM IS DEFINED IN THE POLICIES OF THE TSX VENTURE EXCHANGE) ACCEPTS RESPONSIBILITY FOR THE ADEQUACY OR ACCURACY OF THIS RELEASE.
To view the source version of this press release, please visit https://www.newsfilecorp.com/release/264014
News Provided by Newsfile via QuoteMedia
Coelacanth Energy Inc. (TSXV: CEI,OTC:CEIEF) ("Coelacanth" or the "Company") is pleased to announce its financial and operating results for the three and six months ended June 30, 2025. All dollar figures are Canadian dollars unless otherwise noted.
FINANCIAL RESULTS | Three Months Ended | Six Months Ended | ||||||||||||||||
June 30 | June 30 | |||||||||||||||||
($000s, except per share amounts) | 2025 | 2024 | % Change | 2025 | 2024 | % Change | ||||||||||||
Oil and natural gas sales | 4,828 | 3,164 | 53 | 7,494 | 6,830 | 10 | ||||||||||||
Cash flow from (used in) operating activities | (1,826 | ) | (480 | ) | 280 | (845 | ) | 2,776 | (130 | ) | ||||||||
Per share - basic and diluted (1) | (-) | (-) | - | (-) | 0.01 | (100 | ) | |||||||||||
Adjusted funds flow (used) (1) | (600 | ) | 262 | (329 | ) | (2,040 | ) | 1,340 | (252 | ) | ||||||||
Per share - basic and diluted | (-) | - | (-) | (-) | - | (-) | ||||||||||||
Net loss | (3,464 | ) | (2,329 | ) | 49 | (7,081 | ) | (3,530 | ) | 101 | ||||||||
Per share - basic and diluted | (0.01 | ) | (-) | 100 | (0.01 | ) | (0.01 | ) | - | |||||||||
Capital expenditures (1) | 14,273 | 2,522 | 466 | 39,974 | 3,785 | 956 | ||||||||||||
Adjusted working capital (deficiency) (1) | (41,901 | ) | 64,386 | (165 | ) | |||||||||||||
Common shares outstanding (000s) | ||||||||||||||||||
Weighted average - basic and diluted | 532,274 | 529,400 | 1 | 531,862 | 529,298 | - | ||||||||||||
End of period - basic | 532,866 | 530,126 | 1 | |||||||||||||||
End of period - fully diluted | 591,544 | 617,804 | (4 | ) |
(1) See "Non-GAAP and Other Financial Measures" section.
Three Months Ended | Six Months Ended | |||||||||||||||||
OPERATING RESULTS (1) | June 30 | June 30 | ||||||||||||||||
2025 | 2024 | % Change | 2025 | 2024 | % Change | |||||||||||||
Daily production (2) | ||||||||||||||||||
Oil and condensate (bbls/d) | 539 | 284 | 90 | 362 | 292 | 24 | ||||||||||||
Other NGLs (bbls/d) | 27 | 39 | (31 | ) | 26 | 38 | (32 | ) | ||||||||||
Oil and NGLs (bbls/d) | 566 | 323 | 75 | 388 | 330 | 18 | ||||||||||||
Natural gas (mcf/d) | 3,861 | 3,724 | 4 | 3,588 | 3,829 | (6 | ) | |||||||||||
Oil equivalent (boe/d) | 1,210 | 944 | 28 | 986 | 968 | 2 | ||||||||||||
Oil and natural gas sales | ||||||||||||||||||
Oil and condensate ($/bbl) | 82.58 | 97.76 | (16 | ) | 84.51 | 91.34 | (7 | ) | ||||||||||
Other NGLs ($/bbl) | 26.96 | 33.26 | (19 | ) | 32.19 | 33.99 | (5 | ) | ||||||||||
Oil and NGLs ($/bbl) | 79.91 | 89.86 | (11 | ) | 81.01 | 84.73 | (4 | ) | ||||||||||
Natural gas ($/mcf) | 2.02 | 1.55 | 30 | 2.77 | 2.50 | 11 | ||||||||||||
Oil equivalent ($/boe) | 43.86 | 36.85 | 19 | 41.97 | 38.76 | 8 | ||||||||||||
Royalties | ||||||||||||||||||
Oil and NGLs ($/bbl) | 17.65 | 21.97 | (20 | ) | 17.20 | 21.36 | (19 | ) | ||||||||||
Natural gas ($/mcf) | - | 0.09 | (100 | ) | 0.30 | 0.30 | - | |||||||||||
Oil equivalent ($/boe) | 8.26 | 7.86 | 5 | 7.85 | 8.48 | (7 | ) | |||||||||||
Operating expenses | ||||||||||||||||||
Oil and NGLs ($/bbl) | 10.82 | 10.34 | 5 | 10.77 | 10.11 | 7 | ||||||||||||
Natural gas ($/mcf) | 1.81 | 1.72 | 5 | 1.80 | 1.69 | 7 | ||||||||||||
Oil equivalent ($/boe) | 10.86 | 10.34 | 5 | 10.77 | 10.11 | 7 | ||||||||||||
Net transportation expenses (3) | ||||||||||||||||||
Oil and NGLs ($/bbl) | 4.43 | 2.10 | 111 | 3.86 | 2.28 | 69 | ||||||||||||
Natural gas ($/mcf) | 0.70 | 0.72 | (3 | ) | 0.74 | 0.70 | 6 | |||||||||||
Oil equivalent ($/boe) | 4.33 | 3.55 | 22 | 4.20 | 3.54 | 19 | ||||||||||||
Operating netback (loss) (3) | ||||||||||||||||||
Oil and NGLs ($/bbl) | 47.01 | 55.45 | (15 | ) | 49.18 | 50.98 | (4 | ) | ||||||||||
Natural gas ($/mcf) | (0.49 | ) | (0.98 | ) | (50 | ) | (0.07 | ) | (0.19 | ) | (63 | ) | ||||||
Oil equivalent ($/boe) | 20.41 | 15.10 | 35 | 19.15 | 16.63 | 15 | ||||||||||||
Depletion and depreciation ($/boe) | (12.76 | ) | (14.85 | ) | (14 | ) | (13.35 | ) | (14.63 | ) | (9 | ) | ||||||
General and administrative expenses ($/boe) | (13.69 | ) | (15.17 | ) | (10 | ) | (16.78 | ) | (14.50 | ) | 16 | |||||||
Stock based compensation ($/boe) | (10.31 | ) | (14.50 | ) | (29 | ) | (13.43 | ) | (12.25 | ) | 10 | |||||||
Finance expense ($/boe) | (13.02 | ) | (1.53 | ) | 751 | (12.96 | ) | (1.29 | ) | 905 | ||||||||
Finance income ($/boe) | 0.64 | 9.89 | (94 | ) | 0.96 | 10.25 | (91 | ) | ||||||||||
Unutilized transportation ($/boe) | (2.75 | ) | (6.07 | ) | (55 | ) | (3.25 | ) | (4.24 | ) | (23 | ) | ||||||
Net loss ($/boe) | (31.48 | ) | (27.13 | ) | 16 | (39.66 | ) | (20.03 | ) | 98 |
(1) See "Oil and Gas Terms" section.
(2) See "Product Types" section.
(3) See "Non-GAAP and Other Financial Measures" section.
Selected financial and operational information outlined in this news release should be read in conjunction with Coelacanth's unaudited condensed interim financial statements and related Management's Discussion and Analysis ("MD&A") for the three and six months ended June 30, 2025, which are available for review under the Company's profile on SEDAR+ at www.sedarplus.ca.
OPERATIONS UPDATE
Coelacanth has surpassed many milestones over its initial three years including:
Wells recently placed on production from our 5-19 pad have exceeded expectations and we look forward to placing all our wells on production by October 1, 2025 once all planned third party outages and /or major pipeline maintenance is completed in September. Coelacanth will calibrate production to the type curves in our independent reserve report and recently released resource report to determine ultimate recoveries and provide insights into potential drilling and completion optimizations.
Over the next few years, Coelacanth will continue with its business plan that incorporates:
Coelacanth has licensed additional locations on the 5-19 pad, is in the process of licensing additional development pads, delineation locations and additional infrastructure to grow beyond current plant capacity. While commodity prices and available capital will dictate the pace of execution of the business plan, we are very pleased with the results to date and look forward to reporting on new developments as they arise.
OIL AND GAS TERMS
The Company uses the following frequently recurring oil and gas industry terms in the news release:
Liquids | |
Bbls | Barrels |
Bbls/d | Barrels per day |
NGLs | Natural gas liquids (includes condensate, pentane, butane, propane, and ethane) |
Condensate | Pentane and heavier hydrocarbons |
Natural Gas | |
Mcf | Thousands of cubic feet |
Mcf/d | Thousands of cubic feet per day |
MMcf/d | Millions of cubic feet per day |
MMbtu | Million of British thermal units |
MMbtu/d | Million of British thermal units per day |
Oil Equivalent | |
Boe | Barrels of oil equivalent |
Boe/d | Barrels of oil equivalent per day |
Disclosure provided herein in respect of a boe may be misleading, particularly if used in isolation. A boe conversion rate of six thousand cubic feet of natural gas to one barrel of oil equivalent has been used for the calculation of boe amounts in the news release. This boe conversion rate is based on an energy equivalency conversion method primarily applicable at the burner tip and does not represent a value equivalency at the wellhead.
NON-GAAP AND OTHER FINANCIAL MEASURES
This news release refers to certain measures that are not determined in accordance with IFRS (or "GAAP"). These non-GAAP and other financial measures do not have any standardized meaning prescribed under IFRS and therefore may not be comparable to similar measures presented by other entities. The non-GAAP and other financial measures should not be considered alternatives to, or more meaningful than, financial measures that are determined in accordance with IFRS as indicators of the Company's performance. Management believes that the presentation of these non-GAAP and other financial measures provides useful information to shareholders and investors in understanding and evaluating the Company's ongoing operating performance, and the measures provide increased transparency to better analyze the Company's performance against prior periods on a comparable basis.
Non-GAAP Financial Measures
Adjusted funds flow (used)
Management uses adjusted funds flow (used) to analyze performance and considers it a key measure as it demonstrates the Company's ability to generate the cash necessary to fund future capital investments and abandonment obligations and to repay debt, if any. Adjusted funds flow (used) is a non-GAAP financial measure and has been defined by the Company as cash flow from (used in) operating activities excluding the change in non-cash working capital related to operating activities, movements in restricted cash deposits and expenditures on decommissioning obligations. Management believes the timing of collection, payment or incurrence of these items involves a high degree of discretion and as such may not be useful for evaluating the Company's cash flows. Adjusted funds flow (used) is reconciled from cash flow from (used in) operating activities as follows:
Three Months Ended | Six Months Ended | |||||||||||
June 30 | June 30 | |||||||||||
($000s) | 2025 | 2024 | 2025 | 2024 | ||||||||
Cash flow from (used in) operating activities | (1,826 | ) | (480 | ) | (845 | ) | 2,776 | |||||
Add (deduct): | ||||||||||||
Decommissioning expenditures | 48 | 328 | 187 | 476 | ||||||||
Change in restricted cash deposits | - | 422 | - | 846 | ||||||||
Change in non-cash working capital | 1,178 | (8 | ) | (1,382 | ) | (2,758 | ) | |||||
Adjusted funds flow (used) (non-GAAP) | (600 | ) | 262 | (2,040 | ) | 1,340 |
Net transportation expenses
Management considers net transportation expenses an important measure as it demonstrates the cost of utilized transportation related to the Company's production. Net transportation expenses is calculated as transportation expenses less unutilized transportation and is calculated as follows:
Three Months Ended | Six Months Ended | |||||||||||
June 30 | June 30 | |||||||||||
($000s) | 2025 | 2024 | 2025 | 2024 | ||||||||
Transportation expenses | 779 | 826 | 1,330 | 1,371 | ||||||||
Unutilized transportation | (303 | ) | (522 | ) | (580 | ) | (747 | ) | ||||
Net transportation expenses (non-GAAP) | 476 | 304 | 750 | 624 |
Operating netback
Management considers operating netback an important measure as it demonstrates its profitability relative to current commodity prices. Operating netback is calculated as oil and natural gas sales less royalties, operating expenses, and net transportation expenses and is calculated as follows:
Three Months Ended | Six Months Ended | |||||||||||
June 30 | June 30 | |||||||||||
($000s) | 2025 | 2024 | 2025 | 2024 | ||||||||
Oil and natural gas sales | 4,828 | 3,164 | 7,494 | 6,830 | ||||||||
Royalties | (910 | ) | (674 | ) | (1,401 | ) | (1,495 | ) | ||||
Operating expenses | (1,195 | ) | (888 | ) | (1,923 | ) | (1,782 | ) | ||||
Net transportation expenses | (476 | ) | (304 | ) | (750 | ) | (624 | ) | ||||
Operating netback (non-GAAP) | 2,247 | 1,298 | 3,420 | 2,929 |
Capital expenditures
Coelacanth utilizes capital expenditures as a measure of capital investment on property, plant, and equipment, exploration and evaluation assets and property acquisitions compared to its annual budgeted capital expenditures. Capital expenditures are calculated as follows: hello
Three Months Ended | Six Months Ended | |||||||||||
June 30 | June 30 | |||||||||||
($000s) | 2025 | 2024 | 2025 | 2024 | ||||||||
Capital expenditures – property, plant, and equipment | 370 | 184 | 1,038 | 577 | ||||||||
Capital expenditures – exploration and evaluation assets | 13,903 | 2,338 | 38,936 | 3,208 | ||||||||
Capital expenditures (non-GAAP) | 14,273 | 2,522 | 39,974 | 3,785 |
Capital Management Measures
Adjusted working capital (deficiency)
Management uses adjusted working capital (deficiency) as a measure to assess the Company's financial position. Adjusted working capital (deficiency) is calculated as current assets and restricted cash deposits less current liabilities, excluding the current portion of decommissioning obligations.
($000s) | June 30, 2025 | December 31, 2024 | ||||
Current assets | 6,439 | 11,579 | ||||
Less: | ||||||
Current liabilities | (53,926 | ) | (37,234 | ) | ||
Working capital deficiency | (47,487 | ) | (25,655 | ) | ||
Add: | ||||||
Restricted cash deposits | 4,900 | 4,900 | ||||
Current portion of decommissioning obligations | 686 | 2,118 | ||||
Adjusted working capital deficiency (Capital management measure) | (41,901 | ) | (18,637 | ) |
Non-GAAP Financial Ratios
Adjusted Funds Flow (Used) per Share
Adjusted funds flow (used) per share is a non-GAAP financial ratio, calculated using adjusted funds flow (used) and the same weighted average basic and diluted shares used in calculating net loss per share.
Net transportation expenses per boe
The Company utilizes net transportation expenses per boe to assess the per unit cost of utilized transportation related to the Company's production. Net transportation expenses per boe is calculated as net transportation expenses divided by total production for the applicable period.
Operating netback per boe
The Company utilizes operating netback per boe to assess the operating performance of its petroleum and natural gas assets on a per unit of production basis. Operating netback per boe is calculated as operating netback divided by total production for the applicable period.
Supplementary Financial Measures
The supplementary financial measures used in this news release (primarily average sales price per product type and certain per boe and per share figures) are either a per unit disclosure of a corresponding GAAP measure, or a component of a corresponding GAAP measure, presented in the financial statements. Supplementary financial measures that are disclosed on a per unit basis are calculated by dividing the aggregate GAAP measure (or component thereof) by the applicable unit for the period. Supplementary financial measures that are disclosed on a component basis of a corresponding GAAP measure are a granular representation of a financial statement line item and are determined in accordance with GAAP.
PRODUCT TYPES
The Company uses the following references to sales volumes in the news release:
Natural gas refers to shale gas
Oil and condensate refers to condensate and tight oil combined
Other NGLs refers to butane, propane and ethane combined
Oil and NGLs refers to tight oil and NGLs combined
Oil equivalent refers to the total oil equivalent of shale gas, tight oil, and NGLs combined, using the conversion rate of six thousand cubic feet of shale gas to one barrel of oil equivalent.
The following is a complete breakdown of sales volumes for applicable periods by specific product types of shale gas, tight oil, and NGLs:
Three Months Ended | Six Months Ended | |||
June 30 | June 30 | |||
Sales Volumes by Product Type | 2025 | 2024 | 2025 | 2024 |
Condensate (bbls/d) | 17 | 56 | 17 | 38 |
Other NGLs (bbls/d) | 27 | 39 | 26 | 38 |
NGLs (bbls/d) | 44 | 95 | 43 | 76 |
Tight oil (bbls/d) | 522 | 228 | 345 | 254 |
Condensate (bbls/d) | 17 | 56 | 17 | 38 |
Oil and condensate (bbls/d) | 539 | 284 | 362 | 292 |
Other NGLs (bbls/d) | 27 | 39 | 26 | 38 |
Oil and NGLs (bbls/d) | 566 | 323 | 388 | 330 |
Shale gas (mcf/d) | 3,861 | 3,724 | 3,588 | 3,829 |
Natural gas (mcf/d) | 3,861 | 3,724 | 3,588 | 3,829 |
Oil equivalent (boe/d) | 1,210 | 944 | 986 | 968 |
FORWARD-LOOKING INFORMATION
This document contains forward-looking statements and forward-looking information within the meaning of applicable securities laws. The use of any of the words "expect", "anticipate", "continue", "estimate", "may", "will", "should", "believe", "intends", "forecast", "plans", "guidance" and similar expressions are intended to identify forward-looking statements or information.
More particularly and without limitation, this news release contains forward-looking statements and information relating to the Company's oil and condensate, other NGLs, and natural gas production, capital programs, and adjusted working capital. The forward-looking statements and information are based on certain key expectations and assumptions made by the Company, including expectations and assumptions relating to prevailing commodity prices and exchange rates, applicable royalty rates and tax laws, future well production rates, the performance of existing wells, the success of drilling new wells, the availability of capital to undertake planned activities, and the availability and cost of labour and services.
Although the Company believes that the expectations reflected in such forward-looking statements and information are reasonable, it can give no assurance that such expectations will prove to be correct. Since forward-looking statements and information address future events and conditions, by their very nature they involve inherent risks and uncertainties. Actual results may differ materially from those currently anticipated due to a number of factors and risks. These include, but are not limited to, the risks associated with the oil and gas industry in general such as operational risks in development, exploration and production, delays or changes in plans with respect to exploration or development projects or capital expenditures, the uncertainty of estimates and projections relating to production rates, costs, and expenses, commodity price and exchange rate fluctuations, marketing and transportation, environmental risks, competition, the ability to access sufficient capital from internal and external sources and changes in tax, royalty, and environmental legislation. The forward-looking statements and information contained in this document are made as of the date hereof for the purpose of providing the readers with the Company's expectations for the coming year. The forward-looking statements and information may not be appropriate for other purposes. The Company undertakes no obligation to update publicly or revise any forward-looking statements or information, whether as a result of new information, future events or otherwise, unless so required by applicable securities laws.
Coelacanth is an oil and natural gas company, actively engaged in the acquisition, development, exploration, and production of oil and natural gas reserves in northeastern British Columbia, Canada.
Further Information
For additional information, please contact:
Coelacanth Energy Inc.
Suite 2110, 530 - 8th Avenue SW
Calgary, Alberta T2P 3S8
Phone: (403) 705-4525
www.coelacanth.ca
Mr. Robert J. Zakresky
President and Chief Executive Officer
Mr. Nolan Chicoine
Vice President, Finance and Chief Financial Officer
Neither the TSX Venture Exchange nor its Regulation Services Provider (as that term is defined in the policies of the TSX Venture Exchange) accepts responsibility for the adequacy or accuracy of this release.
To view the source version of this press release, please visit https://www.newsfilecorp.com/release/264010
News Provided by Newsfile via QuoteMedia
Coelacanth Energy Inc. (TSXV: CEI) ("Coelacanth" or the "Company") is pleased to announce its financial and operating results for the three months ended March 30, 2025. All dollar figures are Canadian dollars unless otherwise noted.
FINANCIAL RESULTS | Three Months Ended | ||||||||
March 31 | |||||||||
($000s, except per share amounts) | 2025 | 2024 | % Change | ||||||
Oil and natural gas sales | 2,666 | 3,666 | (27 | ) | |||||
Cash flow from operating activities | 981 | 3,256 | (70 | ) | |||||
Per share - basic and diluted (1) | - | 0.01 | (100 | ) | |||||
Adjusted funds flow (used) (1) | (1,440 | ) | 1,078 | (234 | ) | ||||
Per share - basic and diluted | (- | ) | - | (- | ) | ||||
Net loss | (3,617 | ) | (1,201 | ) | 201 | ||||
Per share - basic and diluted | (0.01 | ) | (- | ) | 100 | ||||
Capital expenditures (1) | 25,701 | 1,263 | 1,935 | ||||||
Adjusted working capital (deficiency) (1) | (25,710 | ) | 67,139 | (138 | ) | ||||
Common shares outstanding (000s) | |||||||||
Weighted average - basic and diluted | 531,445 | 529,196 | - | ||||||
End of period - basic | 532,202 | 529,392 | 1 | ||||||
End of period - fully diluted | 624,877 | 618,165 | 1 |
(1) See "Non-GAAP and Other Financial Measures" section.
Three Months Ended | |||||||||
OPERATING RESULTS (1) | March 31 | ||||||||
2025 | 2024 | % Change | |||||||
Daily production (2) | |||||||||
Oil and condensate (bbls/d) | 184 | 300 | (39 | ) | |||||
Other NGLs (bbls/d) | 25 | 37 | (32 | ) | |||||
Oil and NGLs (bbls/d) | 209 | 337 | (38 | ) | |||||
Natural gas (mcf/d) | 3,311 | 3,934 | (16 | ) | |||||
Oil equivalent (boe/d) | 761 | 993 | (23 | ) | |||||
Oil and natural gas sales | |||||||||
Oil and condensate ($/bbl) | 90.21 | 85.30 | 6 | ||||||
Other NGLs ($/bbl) | 38.01 | 34.79 | 9 | ||||||
Oil and NGLs ($/bbl) | 84.03 | 79.82 | 5 | ||||||
Natural gas ($/mcf) | 3.65 | 3.40 | 7 | ||||||
Oil equivalent ($/boe) | 38.94 | 40.57 | (4 | ) | |||||
Royalties | |||||||||
Oil and NGLs ($/bbl) | 15.95 | 20.77 | (23 | ) | |||||
Natural gas ($/mcf) | 0.64 | 0.51 | 25 | ||||||
Oil equivalent ($/boe) | 7.18 | 9.08 | (21 | ) | |||||
Operating expenses | |||||||||
Oil and NGLs ($/bbl) | 10.63 | 9.89 | 7 | ||||||
Natural gas ($/mcf) | 1.77 | 1.65 | 7 | ||||||
Oil equivalent ($/boe) | 10.63 | 9.89 | 7 | ||||||
Net transportation expenses (3) | |||||||||
Oil and NGLs ($/bbl) | 2.27 | 2.45 | (7 | ) | |||||
Natural gas ($/mcf) | 0.78 | 0.68 | 15 | ||||||
Oil equivalent ($/boe) | 4.00 | 3.54 | 13 | ||||||
Operating netback (3) | |||||||||
Oil and NGLs ($/bbl) | 55.18 | 46.71 | 18 | ||||||
Natural gas ($/mcf) | 0.46 | 0.56 | (18 | ) | |||||
Oil equivalent ($/boe) | 17.13 | 18.06 | (5 | ) | |||||
Depletion and depreciation ($/boe) | (14.30 | ) | (14.42 | ) | (1 | ) | |||
General and administrative expenses ($/boe) | (21.76 | ) | (13.86 | ) | 57 | ||||
Share based compensation ($/boe) | (18.46 | ) | (10.11 | ) | 83 | ||||
Finance expense ($/boe) | (12.86 | ) | (1.06 | ) | 1,113 | ||||
Finance income ($/boe) | 1.46 | 10.60 | (86 | ) | |||||
Unutilized transportation ($/boe) | (4.05 | ) | (2.49 | ) | 63 | ||||
Net loss ($/boe) | (52.84 | ) | (13.28 | ) | 298 |
(1) See "Oil and Gas Terms" section.
(2) See "Product Types" section.
(3) See "Non-GAAP and Other Financial Measures" section.
Selected financial and operational information outlined in this news release should be read in conjunction with Coelacanth's unaudited condensed interim financial statements and related Management's Discussion and Analysis ("MD&A") for the three months ended March 31, 2025, which are available for review under the Company's profile on SEDAR+ at www.sedarplus.ca.
OPERATIONS UPDATE
Coelacanth has reached a major milestone in its development with the completion of the Two Rivers East facility (the "Facility"). The Facility was completed on budget and has moved to the testing and start-up phase. The capacity of the Facility is currently 8,000 boe/d but will be expanded in Q4 2025 to 16,000 boe/d with added compression. We expect production to start flowing imminently from the 5-19 pad and ramp up through the summer. As previously released, the 5-19 pad has 9 wells that tested over 11,000 boe/d (1) that will be brought on systematically to approach the phase I capacity of the plant prior to further drilling.
Over the next few years, Coelacanth will continue with its business plan that incorporates:
Coelacanth has licensed additional locations on the 5-19 pad, is in the process of licensing additional development pads, delineation locations and additional infrastructure to grow beyond current plant capacity. While commodity prices and available capital will dictate the pace of execution of the business plan, we are very pleased with the results to date and look forward to reporting on new developments as they arise.
(1) See "Test Results and Initial Production Rates" section for more details.
OIL AND GAS TERMS
The Company uses the following frequently recurring oil and gas industry terms in the news release:
Liquids
Bbls | Barrels |
Bbls/d | Barrels per day |
NGLs | Natural gas liquids (includes condensate, pentane, butane, propane, and ethane) |
Condensate | Pentane and heavier hydrocarbons |
Natural Gas
Mcf | Thousands of cubic feet |
Mcf/d | Thousands of cubic feet per day |
MMcf/d | Millions of cubic feet per day |
MMbtu | Million of British thermal units |
MMbtu/d | Million of British thermal units per day |
Oil Equivalent
Boe | Barrels of oil equivalent |
Boe/d | Barrels of oil equivalent per day |
Disclosure provided herein in respect of a boe may be misleading, particularly if used in isolation. A boe conversion rate of six thousand cubic feet of natural gas to one barrel of oil equivalent has been used for the calculation of boe amounts in the news release. This boe conversion rate is based on an energy equivalency conversion method primarily applicable at the burner tip and does not represent a value equivalency at the wellhead.
NON-GAAP AND OTHER FINANCIAL MEASURES
This news release refers to certain measures that are not determined in accordance with IFRS (or "GAAP"). These non-GAAP and other financial measures do not have any standardized meaning prescribed under IFRS and therefore may not be comparable to similar measures presented by other entities. The non-GAAP and other financial measures should not be considered alternatives to, or more meaningful than, financial measures that are determined in accordance with IFRS as indicators of the Company's performance. Management believes that the presentation of these non-GAAP and other financial measures provides useful information to shareholders and investors in understanding and evaluating the Company's ongoing operating performance, and the measures provide increased transparency to better analyze the Company's performance against prior periods on a comparable basis.
Non-GAAP Financial Measures
Adjusted funds flow (used)
Management uses adjusted funds flow (used) to analyze performance and considers it a key measure as it demonstrates the Company's ability to generate the cash necessary to fund future capital investments and abandonment obligations and to repay debt, if any. Adjusted funds flow (used) is a non-GAAP financial measure and has been defined by the Company as cash flow from operating activities excluding the change in non-cash working capital related to operating activities, movements in restricted cash deposits and expenditures on decommissioning obligations. Management believes the timing of collection, payment or incurrence of these items involves a high degree of discretion and as such may not be useful for evaluating the Company's cash flows. Adjusted funds flow (used) is reconciled from cash flow from operating activities as follows:
Three Months Ended | |||||||||
March 31 | |||||||||
($000s) | 2025 | 2024 | % Change | ||||||
Cash flow from operating activities | 981 | 3,256 | (70 | ) | |||||
Add (deduct): | |||||||||
Decommissioning expenditures | 139 | 148 | (6 | ) | |||||
Change in restricted cash deposits | - | 424 | (100 | ) | |||||
Change in non-cash working capital | (2,560 | ) | (2,750 | ) | (7 | ) | |||
Adjusted funds flow (used) (non-GAAP) | (1,440 | ) | 1,078 | (234 | ) |
Net transportation expenses
Management considers net transportation expenses an important measure as it demonstrates the cost of utilized transportation related to the Company's production. Net transportation expenses is calculated as transportation expenses less unutilized transportation and is calculated as follows:
Three Months Ended | ||||||
March 31 | ||||||
($000s) | 2025 | 2024 | ||||
Transportation expenses | 551 | 545 | ||||
Unutilized transportation | (277 | ) | (225 | ) | ||
Net transportation expenses (non-GAAP) | 274 | 320 |
Operating netback
Management considers operating netback an important measure as it demonstrates its profitability relative to current commodity prices. Operating netback is calculated as oil and natural gas sales less royalties, operating expenses, and net transportation expenses and is calculated as follows:
Three Months Ended | ||||||
March 31 | ||||||
($000s) | 2025 | 2024 | ||||
Oil and natural gas sales | 2,666 | 3,666 | ||||
Royalties | (491 | ) | (821 | ) | ||
Operating expenses | (728 | ) | (894 | ) | ||
Net transportation expenses | (274 | ) | (320 | ) | ||
Operating netback (non-GAAP) | 1,173 | 1,631 |
Capital expenditures
Coelacanth utilizes capital expenditures as a measure of capital investment on property, plant, and equipment, exploration and evaluation assets and property acquisitions compared to its annual budgeted capital expenditures. Capital expenditures are calculated as follows:
Three Months Ended | ||||||
March 31 | ||||||
($000s) | 2025 | 2024 | ||||
Capital expenditures – property, plant, and equipment | 668 | 393 | ||||
Capital expenditures – exploration and evaluation assets | 25,033 | 870 | ||||
Capital expenditures (non-GAAP) | 25,701 | 1,263 |
Capital Management Measures
Adjusted working capital
Management uses adjusted working capital (deficiency) as a measure to assess the Company's financial position. Adjusted working capital is calculated as current assets and restricted cash deposits less current liabilities, excluding the current portion of decommissioning obligations.
($000s) | March 31, 2025 | December 31, 2024 | ||||
Current assets | 3,431 | 11,579 | ||||
Less: | ||||||
Current liabilities | (36,009 | ) | (37,234 | ) | ||
Working capital deficiency | (32,578 | ) | (25,655 | ) | ||
Add: | ||||||
Restricted cash deposits | 4,900 | 4,900 | ||||
Current portion of decommissioning obligations | 1,968 | 2,118 | ||||
Adjusted working capital deficiency (Capital management measure) | (25,710 | ) | (18,637 | ) |
Non-GAAP Financial Ratios
Adjusted Funds Flow (Used) per Share
Adjusted funds flow (used) per share is a non-GAAP financial ratio, calculated using adjusted funds flow (used) and the same weighted average basic and diluted shares used in calculating net loss per share.
Net transportation expenses per boe
The Company utilizes net transportation expenses per boe to assess the per unit cost of utilized transportation related to the Company's production. Net transportation expenses per boe is calculated as net transportation expenses divided by total production for the applicable period.
Operating netback per boe
The Company utilizes operating netback per boe to assess the operating performance of its petroleum and natural gas assets on a per unit of production basis. Operating netback per boe is calculated as operating netback divided by total production for the applicable period.
Supplementary Financial Measures
The supplementary financial measures used in this news release (primarily average sales price per product type and certain per boe and per share figures) are either a per unit disclosure of a corresponding GAAP measure, or a component of a corresponding GAAP measure, presented in the financial statements. Supplementary financial measures that are disclosed on a per unit basis are calculated by dividing the aggregate GAAP measure (or component thereof) by the applicable unit for the period. Supplementary financial measures that are disclosed on a component basis of a corresponding GAAP measure are a granular representation of a financial statement line item and are determined in accordance with GAAP.
PRODUCT TYPES
The Company uses the following references to sales volumes in the news release:
Natural gas refers to shale gas
Oil and condensate refers to condensate and tight oil combined
Other NGLs refers to butane, propane and ethane combined
Oil and NGLs refers to tight oil and NGLs combined
Oil equivalent refers to the total oil equivalent of shale gas, tight oil, and NGLs combined, using the conversion rate of six thousand cubic feet of shale gas to one barrel of oil equivalent.
The following is a complete breakdown of sales volumes for applicable periods by specific product types of shale gas, tight oil, and NGLs:
Three Months Ended | ||
March 31 | ||
Sales Volumes by Product Type | 2025 | 2024 |
Condensate (bbls/d) | 18 | 19 |
Other NGLs (bbls/d) | 25 | 37 |
NGLs (bbls/d) | 43 | 56 |
Tight oil (bbls/d) | 166 | 281 |
Condensate (bbls/d) | 18 | 19 |
Oil and condensate (bbls/d) | 184 | 300 |
Other NGLs (bbls/d) | 25 | 37 |
Oil and NGLs (bbls/d) | 209 | 337 |
Shale gas (mcf/d) | 3,311 | 3,934 |
Natural gas (mcf/d) | 3,311 | 3,934 |
Oil equivalent (boe/d) | 761 | 993 |
TEST RESULTS AND INITIAL PRODUCTION RATES
The 5-19 Lower Montney well was production tested for 9.4 days and produced at an average rate of 377 bbl/d oil and 2,202 mcf/d gas (net of load fluid and energizing fluid) over that period which includes the initial cleanup where only load water was being recovered. At the end of the test, flowing wellhead pressure and production rates were stable.
The A5-19 Basal Montney well was production tested for 5.9 days and produced at an average rate of 117 bbl/d oil and 630 mcf/d gas (net of load fluid and energizing fluid) over that period which includes the initial cleanup where only load water was being recovered. At the end of the test, flowing wellhead pressure and production rates were stable.
The B5-19 Upper Montney well was production tested for 6.3 days and produced at an average rate of 92 bbl/d oil and 2,100 mcf/d gas (net of load fluid and energizing fluid) over that period which includes the initial cleanup where only load water was being recovered. At the end of the test, flowing wellhead pressure and production rates were stable.
The C5-19 Lower Montney well was production tested for 5.8 days and produced at an average rate of 736 bbl/d oil and 2,660 mcf/d gas (net of load fluid and energizing fluid) over that period which includes the initial cleanup where only load water was being recovered. At the end of the test, flowing wellhead pressure and production rates were stable.
The D5-19 Lower Montney well was production tested for 12.6 days and produced at an average rate of 170 bbl/d oil and 580 mcf/d gas (net of load fluid and energizing fluid) over that period which includes the initial cleanup where only load water was being recovered. At the end of the test, flowing wellhead pressure and production rates were stable.
The E5-19 Lower Montney well was production tested for 11.4 days and produced at an average rate of 312 bbl/d oil and 890 mcf/d gas (net of load fluid and energizing fluid) over that period which includes the initial cleanup where only load water was being recovered. At the end of the test, flowing wellhead pressure was stable, and production was starting to decline.
The F5-19 Lower Montney well was production tested for 4.9 days and produced at an average rate of 728 bbl/d oil and 1,607 mcf/d gas (net of load fluid and energizing fluid) over that period which includes the initial cleanup where only load water was being recovered. At the end of the test, flowing wellhead pressure and production rates were stable.
The G5-19 Lower Montney well was production tested for 7.1 days and produced at an average rate of 415 bbl/d oil and 1,489 mcf/d gas (net of load fluid and energizing fluid) over that period which includes the initial cleanup where only load water was being recovered. At the end of the test, flowing wellhead pressure and production rates were stable.
The H5-19 Lower Montney well was production tested for 8.1 days and produced at an average rate of 411 bbl/d oil and 1,166 mcf/d gas (net of load fluid and energizing fluid) over that period which includes the initial cleanup where only load water was being recovered. At the end of the test, flowing wellhead pressure was stable and production was starting to decline.
A pressure transient analysis or well-test interpretation has not been carried out on these nine wells and thus certain of the test results provided herein should be considered to be preliminary until such analysis or interpretation has been completed. Test results and initial production rates disclosed herein, particularly those short in duration, may not necessarily be indicative of long-term performance or of ultimate recovery.
Any references to peak rates, test rates, IP30, IP90, IP180 or initial production rates or declines are useful for confirming the presence of hydrocarbons, however, such rates and declines are not determinative of the rates at which such wells will continue production and decline thereafter and are not indicative of long-term performance or ultimate recovery. IP30 is defined as an average production rate over 30 consecutive days, IP90 is defined as an average production rate over 90 consecutive days and IP180 is defined as an average production rate over 180 consecutive days. Readers are cautioned not to place reliance on such rates in calculating aggregate production for the Company.
FORWARD-LOOKING INFORMATION
This document contains forward-looking statements and forward-looking information within the meaning of applicable securities laws. The use of any of the words "expect", "anticipate", "continue", "estimate", "may", "will", "should", "believe", "intends", "forecast", "plans", "guidance" and similar expressions are intended to identify forward-looking statements or information.
More particularly and without limitation, this news release contains forward-looking statements and information relating to the Company's oil and condensate, other NGLs, and natural gas production, capital programs, and adjusted working capital. The forward-looking statements and information are based on certain key expectations and assumptions made by the Company, including expectations and assumptions relating to prevailing commodity prices and exchange rates, applicable royalty rates and tax laws, future well production rates, the performance of existing wells, the success of drilling new wells, the availability of capital to undertake planned activities, and the availability and cost of labour and services.
Although the Company believes that the expectations reflected in such forward-looking statements and information are reasonable, it can give no assurance that such expectations will prove to be correct. Since forward-looking statements and information address future events and conditions, by their very nature they involve inherent risks and uncertainties. Actual results may differ materially from those currently anticipated due to a number of factors and risks. These include, but are not limited to, the risks associated with the oil and gas industry in general such as operational risks in development, exploration and production, delays or changes in plans with respect to exploration or development projects or capital expenditures, the uncertainty of estimates and projections relating to production rates, costs, and expenses, commodity price and exchange rate fluctuations, marketing and transportation, environmental risks, competition, the ability to access sufficient capital from internal and external sources and changes in tax, royalty, and environmental legislation. The forward-looking statements and information contained in this document are made as of the date hereof for the purpose of providing the readers with the Company's expectations for the coming year. The forward-looking statements and information may not be appropriate for other purposes. The Company undertakes no obligation to update publicly or revise any forward-looking statements or information, whether as a result of new information, future events or otherwise, unless so required by applicable securities laws.
Coelacanth is an oil and natural gas company, actively engaged in the acquisition, development, exploration, and production of oil and natural gas reserves in northeastern British Columbia, Canada.
Further Information
For additional information, please contact:
Coelacanth Energy Inc.
Suite 2110, 530 - 8th Avenue SW
Calgary, Alberta T2P 3S8
Phone: (403) 705-4525
www.coelacanth.ca
Mr. Robert J. Zakresky
President and Chief Executive Officer
Mr. Nolan Chicoine
Vice President, Finance and Chief Financial Officer
Neither the TSX Venture Exchange nor its Regulation Services Provider (as that term is defined in the policies of the TSX Venture Exchange) accepts responsibility for the adequacy or accuracy of this release.
To view the source version of this press release, please visit https://www.newsfilecorp.com/release/253761
News Provided by Newsfile via QuoteMedia
Coelacanth Energy Inc. (TSXV: CEI) ("Coelacanth" or the "Company") is pleased to announce its financial and operating results for the three months and year ended December 31, 2024. All dollar figures are Canadian dollars unless otherwise noted.
2024 HIGHLIGHTS
FINANCIAL RESULTS | Three Months Ended | Year Ended | ||||||||||||||||
December 31 | December 31 | |||||||||||||||||
($000s, except per share amounts) | 2024 | 2023 | % Change | 2024 | 2023 | % Change | ||||||||||||
Oil and natural gas sales | 4,544 | 4,204 | 8 | 13,736 | 6,663 | 106 | ||||||||||||
Cash flow from (used in) operating activities | 3,157 | (404 | ) | (881 | ) | 2,203 | (4,234 | ) | (152 | ) | ||||||||
Per share - basic and diluted (1) | 0.01 | (-) | (100 | ) | - | (0.01 | ) | (100 | ) | |||||||||
Adjusted funds flow (used) (1) | 382 | 1,750 | (78 | ) | 1,515 | (333 | ) | (555 | ) | |||||||||
Per share - basic and diluted | - | - | - | - | (-) | (-) | ||||||||||||
Net loss | (2,903 | ) | (750 | ) | 287 | (8,897 | ) | (6,573 | ) | 35 | ||||||||
Per share - basic and diluted | (0.01 | ) | (-) | 100 | (0.02 | ) | (0.01 | ) | 100 | |||||||||
Capital expenditures (1) | 64,952 | 34,656 | 87 | 84,497 | 74,613 | 13 | ||||||||||||
Adjusted working capital (deficiency) (1) | (18,637 | ) | 67,589 | (128 | ) | |||||||||||||
Common shares outstanding (000s) | ||||||||||||||||||
Weighted average - basic and diluted | 530,398 | 478,731 | 11 | 529,804 | 439,055 | 21 | ||||||||||||
End of period - basic | 530,670 | 528,650 | - | |||||||||||||||
End of period - fully diluted | 615,930 | 609,989 | 1 |
(1) See "Non-GAAP and Other Financial Measures" section.
(2) See "Test Results and Initial Production Rates" section.
Three Months Ended | Year Ended | |||||||||||||||||
OPERATING RESULTS (1) | December 31 | December 31 | ||||||||||||||||
2024 | 2023 | % Change | 2024 | 2023 | % Change | |||||||||||||
Daily production (2) | ||||||||||||||||||
Oil and condensate (bbls/d) | 473 | 419 | 13 | 320 | 139 | 130 | ||||||||||||
Other NGLs (bbls/d) | 29 | 28 | 4 | 34 | 16 | 113 | ||||||||||||
Oil and NGLs (bbls/d) | 502 | 447 | 12 | 354 | 155 | 128 | ||||||||||||
Natural gas (mcf/d) | 3,490 | 2,858 | 22 | 3,648 | 1,624 | 125 | ||||||||||||
Oil equivalent (boe/d) | 1,084 | 923 | 17 | 962 | 426 | 126 | ||||||||||||
Oil and natural gas sales | ||||||||||||||||||
Oil and condensate ($/bbl) | 87.06 | 87.38 | (-) | 89.46 | 88.94 | 1 | ||||||||||||
Other NGLs ($/bbl) | 33.28 | 32.32 | 3 | 33.22 | 33.22 | - | ||||||||||||
Oil and NGLs ($/bbl) | 83.97 | 83.88 | - | 83.99 | 83.28 | 1 | ||||||||||||
Natural gas ($/mcf) | 2.07 | 2.86 | (28 | ) | 2.14 | 3.26 | (34 | ) | ||||||||||
Oil equivalent ($/boe) | 45.57 | 49.47 | (8 | ) | 39.01 | 42.82 | (9 | ) | ||||||||||
Royalties | ||||||||||||||||||
Oil and NGLs ($/bbl) | 16.86 | 19.38 | (13 | ) | 18.70 | 20.24 | (8 | ) | ||||||||||
Natural gas ($/mcf) | 0.13 | 0.26 | (50 | ) | 0.21 | 0.57 | (63 | ) | ||||||||||
Oil equivalent ($/boe) | 8.22 | 10.20 | (19 | ) | 7.66 | 9.57 | (20 | ) | ||||||||||
Operating expenses | ||||||||||||||||||
Oil and NGLs ($/bbl) | 8.34 | 11.57 | (28 | ) | 9.47 | 13.25 | (29 | ) | ||||||||||
Natural gas ($/mcf) | 1.25 | 1.28 | (2 | ) | 1.58 | 2.21 | (29 | ) | ||||||||||
Oil equivalent ($/boe) | 7.88 | 9.57 | (18 | ) | 9.47 | 13.25 | (29 | ) | ||||||||||
Net transportation expenses (3) | ||||||||||||||||||
Oil and NGLs ($/bbl) | 5.54 | 4.95 | 12 | 3.46 | 4.10 | (16 | ) | |||||||||||
Natural gas ($/mcf) | 0.76 | 0.81 | (6 | ) | 0.73 | 1.12 | (35 | ) | ||||||||||
Oil equivalent ($/boe) | 5.01 | 4.92 | 2 | 4.04 | 5.75 | (30 | ) | |||||||||||
Operating netback (loss) (3) | ||||||||||||||||||
Oil and NGLs ($/bbl) | 53.23 | 47.98 | 11 | 52.36 | 45.69 | 15 | ||||||||||||
Natural gas ($/mcf) | (0.07 | ) | 0.51 | (114 | ) | (0.38 | ) | (0.64 | ) | (41 | ) | |||||||
Oil equivalent ($/boe) | 24.46 | 24.78 | (1 | ) | 17.84 | 14.25 | 25 | |||||||||||
Depletion and depreciation ($/boe) | (10.76 | ) | (12.18 | ) | (12 | ) | (13.59 | ) | (14.93 | ) | (9 | ) | ||||||
General and administrative expenses ($/boe) | (15.46 | ) | (10.77 | ) | 44 | (14.34 | ) | (27.08 | ) | (47 | ) | |||||||
Share based compensation ($/boe) | (7.08 | ) | (16.31 | ) | (57 | ) | (11.12 | ) | (23.49 | ) | (53 | ) | ||||||
Loss on lease termination ($/boe) | (2.02 | ) | - | 100 | (0.57 | ) | - | 100 | ||||||||||
Finance expense ($/boe) | (18.02 | ) | (1.28 | ) | 1,308 | (6.33 | ) | (3.09 | ) | 105 | ||||||||
Finance income ($/boe) | 3.65 | 10.01 | (64 | ) | 8.23 | 18.75 | (56 | ) | ||||||||||
Unutilized transportation ($/boe) | (3.88 | ) | (3.08 | ) | 26 | (5.37 | ) | (6.65 | ) | (19 | ) | |||||||
Net loss ($/boe) | (29.11 | ) | (8.83 | ) | 230 | (25.25 | ) | (42.24 | ) | (40 | ) |
(1) See "Oil and Gas Terms" section.
(2) See "Product Types" section.
(3) See "Non-GAAP and Other Financial Measures" section.
Selected financial and operational information outlined in this news release should be read in conjunction with Coelacanth's audited financial statements and related Management's Discussion and Analysis ("MD&A") for the year ended December 31, 2024, which are available for review under the Company's profile on SEDAR+ at www.sedarplus.ca.
OPERATIONS UPDATE
In Q4 2024, Coelacanth achieved two more significant milestones in its vision of moving the Two Rivers Montney Project from a large Montney land block to a proven resource with decades of inventory.
In 2022 and 2023, Coelacanth was able to prove productivity in the Lower Montney over a significant portion of lands at Two Rivers that allowed for the decision to build-out infrastructure and to continue pad drilling at Two Rivers East. During 2024, Coelacanth completed the licensing phase of the infrastructure and started construction while also continuing to develop the Montney resource.
In Q4 2024, Coelacanth was able to substantially complete all pipelines required for its 5-19 pad that connected it from the pad to the future facility and then on to a midstream gathering system. Concurrently, Coelacanth completed a successful Upper Montney well at Two Rivers East and changed the completion design in the Lower Montney on the 5-19 pad. The Upper Montney completion proved significant productivity (previously announced test rate of 1,136 boe/d) (1) in a zone that can be mapped over a significant portion of Coelacanth's lands and should materially increase drilling inventory. The new Lower Montney completions yielded increased overall test rates as well as increasing the oil percentage (3-well average test rates previously announced at 1,624 boe/d with 61% light oil) (1) pointing to potentially higher per-well recoveries of oil and gas and corresponding per-well values than previously estimated.
Construction of the facility continued throughout Q1 2025 and is now substantially complete. With 9 wells and over 11,000 boe/d (1) of test production waiting on completion of the facility, we anticipate yet another major milestone will be reached imminently. We look forward to reporting updates on the Two Rivers East project as new developments arise.
(1) See "Test Results and Initial Production Rates" section for more details.
OIL AND GAS TERMS
The Company uses the following frequently recurring oil and gas industry terms in the news release:
Liquids | |
Bbls | Barrels |
Bbls/d | Barrels per day |
NGLs | Natural gas liquids (includes condensate, pentane, butane, propane, and ethane) |
Condensat | Pentane and heavier hydrocarbons |
Natural Gas | |
Mcf | Thousands of cubic feet |
Mcf/d | Thousands of cubic feet per day |
MMcf/d | Millions of cubic feet per day |
MMbtu | Million of British thermal units |
MMbtu/d | Million of British thermal units per day |
Oil Equivalent | |
Boe | Barrels of oil equivalent |
Boe/d | Barrels of oil equivalent per day |
Disclosure provided herein in respect of a boe may be misleading, particularly if used in isolation. A boe conversion rate of six thousand cubic feet of natural gas to one barrel of oil equivalent has been used for the calculation of boe amounts in the news release. This boe conversion rate is based on an energy equivalency conversion method primarily applicable at the burner tip and does not represent a value equivalency at the wellhead.
NON-GAAP AND OTHER FINANCIAL MEASURES
This news release refers to certain measures that are not determined in accordance with IFRS (or "GAAP"). These non-GAAP and other financial measures do not have any standardized meaning prescribed under IFRS and therefore may not be comparable to similar measures presented by other entities. The non-GAAP and other financial measures should not be considered alternatives to, or more meaningful than, financial measures that are determined in accordance with IFRS as indicators of the Company's performance. Management believes that the presentation of these non-GAAP and other financial measures provides useful information to shareholders and investors in understanding and evaluating the Company's ongoing operating performance, and the measures provide increased transparency to better analyze the Company's performance against prior periods on a comparable basis.
Non-GAAP Financial Measures
Adjusted funds flow (used)
Management uses adjusted funds flow (used) to analyze performance and considers it a key measure as it demonstrates the Company's ability to generate the cash necessary to fund future capital investments and abandonment obligations and to repay debt, if any. Adjusted funds flow (used) is a non-GAAP financial measure and has been defined by the Company as cash flow from (used in) operating activities excluding the change in non-cash working capital related to operating activities, movements in restricted cash deposits and expenditures on decommissioning obligations. Management believes the timing of collection, payment or incurrence of these items involves a high degree of discretion and as such may not be useful for evaluating the Company's cash flows. Adjusted funds flow (used) is reconciled from cash flow from (used) in operating activities as follows:
Three Months Ended | Year Ended | |||||||||||
December 31 | December 31 | |||||||||||
($000s) | 2024 | 2023 | 2024 | 2023 | ||||||||
Cash flow from (used in) operating activities | 3,157 | (404 | ) | 2,203 | (4,234 | ) | ||||||
Add (deduct): | ||||||||||||
Decommissioning expenditures | 161 | 206 | 1,427 | 1,883 | ||||||||
Change in restricted cash deposits | (5,361 | ) | - | (2,376 | ) | (784 | ) | |||||
Change in non-cash working capital | 2,425 | 1,948 | 261 | 2,802 | ||||||||
Adjusted funds flow (used) (non-GAAP) | 382 | 1,750 | 1,515 | (333 | ) |
Net transportation expenses
Management considers net transportation expenses an important measure as it demonstrates the cost of utilized transportation related to the Company's production. Net transportation expenses is calculated as transportation expenses less unutilized transportation and is calculated as follows:
Three Months Ended | Year Ended | |||||||||||
December 31 | December 31 | |||||||||||
($000s) | 2024 | 2023 | 2024 | 2023 | ||||||||
Transportation expenses | 887 | 680 | 3,313 | 1,930 | ||||||||
Unutilized transportation | (387 | ) | (262 | ) | (1,891 | ) | (1,035 | ) | ||||
Net transportation expenses (non-GAAP) | 500 | 418 | 1,422 | 895 |
Operating netback
Management considers operating netback an important measure as it demonstrates its profitability relative to current commodity prices. Operating netback is calculated as oil and natural gas sales less royalties, operating expenses, and net transportation expenses and is calculated as follows:
Three Months Ended | Year Ended | |||||||||||
December 31 | December 31 | |||||||||||
($000s) | 2024 | 2023 | 2024 | 2023 | ||||||||
Oil and natural gas sales | 4,544 | 4,204 | 13,736 | 6,663 | ||||||||
Royalties | (820 | ) | (866 | ) | (2,698 | ) | (1,489 | ) | ||||
Operating expenses | (786 | ) | (813 | ) | (3,335 | ) | (2,062 | ) | ||||
Net transportation expenses | (500 | ) | (418 | ) | (1,422 | ) | (895 | ) | ||||
Operating netback (non-GAAP) | 2,438 | 2,107 | 6,281 | 2,217 |
Capital expenditures
Coelacanth utilizes capital expenditures as a measure of capital investment on property, plant, and equipment, exploration and evaluation assets and property acquisitions compared to its annual budgeted capital expenditures. Capital expenditures are calculated as follows:
Three Months Ended | Year Ended | |||||||||||
December 31 | December 31 | |||||||||||
($000s) | 2024 | 2023 | 2024 | 2023 | ||||||||
Capital expenditures – property, plant, and equipment | 233 | 4,584 | 1,206 | 26,928 | ||||||||
Capital expenditures – exploration and evaluation assets | 64,719 | 30,072 | 83,291 | 47,685 | ||||||||
Capital expenditures (non-GAAP) | 64,952 | 34,656 | 84,497 | 74,613 |
Capital Management Measures
Adjusted working capital (deficiency)
Management uses adjusted working capital (deficiency) as a measure to assess the Company's financial position. Adjusted working capital is calculated as current assets and restricted cash deposits less current liabilities, excluding the current portion of decommissioning obligations.
($000s) | December 31, 2024 | December 31, 2023 | ||||
Current assets | 11,579 | 87,616 | ||||
Less: | ||||||
Current liabilities | (37,234 | ) | (28,754 | ) | ||
Working capital (deficiency) | (25,655 | ) | 58,862 | |||
Add: | ||||||
Restricted cash deposits | 4,900 | 6,784 | ||||
Current portion of decommissioning obligations | 2,118 | 1,943 | ||||
Adjusted working capital (deficiency) (Capital management measure) | (18,637 | ) | 67,589 |
Non-GAAP Financial Ratios
Adjusted Funds Flow (Used) per share
Adjusted funds flow (used) per share is a non-GAAP financial ratio, calculated using adjusted funds flow (used) and the same weighted average basic and diluted shares used in calculating net loss per share.
Net transportation expenses per boe
The Company utilizes net transportation expenses per boe to assess the per unit cost of utilized transportation related to the Company's production. Net transportation expenses per boe is calculated as net transportation expenses divided by total production for the applicable period.
Operating netback per boe
The Company utilizes operating netback per boe to assess the operating performance of its petroleum and natural gas assets on a per unit of production basis. Operating netback per boe is calculated as operating netback divided by total production for the applicable period.
Supplementary Financial Measures
The supplementary financial measures used in this news release (primarily average sales price per product type and certain per boe and per share figures) are either a per unit disclosure of a corresponding GAAP measure, or a component of a corresponding GAAP measure, presented in the financial statements. Supplementary financial measures that are disclosed on a per unit basis are calculated by dividing the aggregate GAAP measure (or component thereof) by the applicable unit for the period. Supplementary financial measures that are disclosed on a component basis of a corresponding GAAP measure are a granular representation of a financial statement line item and are determined in accordance with GAAP.
PRODUCT TYPES
The Company uses the following references to sales volumes in the news release:
Natural gas refers to shale gas.
Oil and condensate refers to condensate and tight oil combined.
Other NGLs refers to butane, propane and ethane combined.
Oil and NGLs refers to tight oil and NGLs combined.
Oil equivalent refers to the total oil equivalent of shale gas, tight oil, and NGLs combined, using the conversion rate of six thousand cubic feet of shale gas to one barrel of oil equivalent as described above.
The following is a complete breakdown of sales volumes for applicable periods by specific product types of shale gas, tight oil, and NGLs:
Three Months Ended | Year Ended | |||||||||||
December 31 | December 31 | |||||||||||
Sales Volumes by Product Type | 2024 | 2023 | 2024 | 2023 | ||||||||
Condensate (bbls/d) | 22 | 12 | 32 | 7 | ||||||||
Other NGLs (bbls/d) | 29 | 28 | 35 | 16 | ||||||||
NGLs (bbls/d) | 51 | 40 | 67 | 23 | ||||||||
Tight oil (bbls/d) | 451 | 407 | 287 | 132 | ||||||||
Condensate (bbls/d) | 22 | 12 | 32 | 7 | ||||||||
Oil and condensate (bbls/d) | 473 | 419 | 319 | 139 | ||||||||
Other NGLs (bbls/d) | 29 | 28 | 35 | 16 | ||||||||
Oil and NGLs (bbls/d) | 502 | 447 | 354 | 155 | ||||||||
Shale gas (mcf/d) | 3,490 | 2,858 | 3,648 | 1,624 | ||||||||
Natural gas (mcf/d) | 3,490 | 2,858 | 3,648 | 1,624 | ||||||||
Oil equivalent (boe/d) | 1,084 | 923 | 962 | 426 |
TEST RESULTS AND INITIAL PRODUCTION RATES
The 5-19 Lower Montney well was production tested for 9.4 days and produced at an average rate of 377 bbl/d oil and 2,202 mcf/d gas (net of load fluid and energizing fluid) over that period which includes the initial cleanup where only load water was being recovered. At the end of the test, flowing wellhead pressure and production rates were stable.
The A5-19 Basal Montney well was production tested for 5.9 days and produced at an average rate of 117 bbl/d oil and 630 mcf/d gas (net of load fluid and energizing fluid) over that period which includes the initial cleanup where only load water was being recovered. At the end of the test, flowing wellhead pressure and production rates were stable.
The B5-19 Upper Montney well was production tested for 6.3 days and produced at an average rate of 92 bbl/d oil and 2,100 mcf/d gas (net of load fluid and energizing fluid) over that period which includes the initial cleanup where only load water was being recovered. At the end of the test, flowing wellhead pressure and production rates were stable.
The C5-19 Lower Montney well was production tested for 5.8 days and produced at an average rate of 736 bbl/d oil and 2,660 mcf/d gas (net of load fluid and energizing fluid) over that period which includes the initial cleanup where only load water was being recovered. At the end of the test, flowing wellhead pressure and production rates were stable.
The D5-19 Lower Montney well was production tested for 12.6 days and produced at an average rate of 170 bbl/d oil and 580 mcf/d gas (net of load fluid and energizing fluid) over that period which includes the initial cleanup where only load water was being recovered. At the end of the test, flowing wellhead pressure and production rates were stable.
The E5-19 Lower Montney well was production tested for 11.4 days and produced at an average rate of 312 bbl/d oil and 890 mcf/d gas (net of load fluid and energizing fluid) over that period which includes the initial cleanup where only load water was being recovered. At the end of the test, flowing wellhead pressure was stable, and production was starting to decline.
The F5-19 Lower Montney well was production tested for 4.9 days and produced at an average rate of 728 bbl/d oil and 1,607 mcf/d gas (net of load fluid and energizing fluid) over that period which includes the initial cleanup where only load water was being recovered. At the end of the test, flowing wellhead pressure and production rates were stable.
The G5-19 Lower Montney well was production tested for 7.1 days and produced at an average rate of 415 bbl/d oil and 1,489 mcf/d gas (net of load fluid and energizing fluid) over that period which includes the initial cleanup where only load water was being recovered. At the end of the test, flowing wellhead pressure and production rates were stable.
The H5-19 Lower Montney well was production tested for 8.1 days and produced at an average rate of 411 bbl/d oil and 1,166 mcf/d gas (net of load fluid and energizing fluid) over that period which includes the initial cleanup where only load water was being recovered. At the end of the test, flowing wellhead pressure was stable and production was starting to decline.
A pressure transient analysis or well-test interpretation has not been carried out on these nine wells and thus certain of the test results provided herein should be considered to be preliminary until such analysis or interpretation has been completed. Test results and initial production rates disclosed herein, particularly those short in duration, may not necessarily be indicative of long-term performance or of ultimate recovery.
Any references to peak rates, test rates, IP30, IP90, IP180 or initial production rates or declines are useful for confirming the presence of hydrocarbons, however, such rates and declines are not determinative of the rates at which such wells will continue production and decline thereafter and are not indicative of long-term performance or ultimate recovery. IP30 is defined as an average production rate over 30 consecutive days, IP90 is defined as an average production rate over 90 consecutive days and IP180 is defined as an average production rate over 180 consecutive days. Readers are cautioned not to place reliance on such rates in calculating aggregate production for the Company.
FORWARD-LOOKING INFORMATION
This document contains forward-looking statements and forward-looking information within the meaning of applicable securities laws. The use of any of the words "expect", "anticipate", "continue", "estimate", "may", "will", "should", "believe", "intends", "forecast", "plans", "guidance" and similar expressions are intended to identify forward-looking statements or information.
More particularly and without limitation, this news release contains forward-looking statements and information relating to the Company's oil and condensate, other NGLs, and natural gas production, capital programs, and adjusted working capital (deficiency). The forward-looking statements and information are based on certain key expectations and assumptions made by the Company, including expectations and assumptions relating to prevailing commodity prices and exchange rates, applicable royalty rates and tax laws, future well production rates, the performance of existing wells, the success of drilling new wells, the availability of capital to undertake planned activities, and the availability and cost of labour and services.
Although the Company believes that the expectations reflected in such forward-looking statements and information are reasonable, it can give no assurance that such expectations will prove to be correct. Since forward-looking statements and information address future events and conditions, by their very nature they involve inherent risks and uncertainties. Actual results may differ materially from those currently anticipated due to a number of factors and risks. These include, but are not limited to, the risks associated with the oil and gas industry in general such as operational risks in development, exploration and production, delays or changes in plans with respect to exploration or development projects or capital expenditures, the uncertainty of estimates and projections relating to production rates, costs, and expenses, commodity price and exchange rate fluctuations, marketing and transportation, environmental risks, competition, the ability to access sufficient capital from internal and external sources and changes in tax, royalty, and environmental legislation. The forward-looking statements and information contained in this document are made as of the date hereof for the purpose of providing the readers with the Company's expectations for the coming year. The forward-looking statements and information may not be appropriate for other purposes. The Company undertakes no obligation to update publicly or revise any forward-looking statements or information, whether as a result of new information, future events or otherwise, unless so required by applicable securities laws.
Coelacanth is an oil and natural gas company, actively engaged in the acquisition, development, exploration, and production of oil and natural gas reserves in northeastern British Columbia, Canada.
Further Information
For additional information, please contact:
Coelacanth Energy Inc.
Suite 2110, 530 - 8th Avenue SW
Calgary, Alberta T2P 3S8
Phone: (403) 705-4525
www.coelacanth.ca
Mr. Robert J. Zakresky
President and Chief Executive Officer
Mr. Nolan Chicoine
Vice President, Finance and Chief Financial Officer
Neither the TSX Venture Exchange nor its Regulation Services Provider (as that term is defined in the policies of the TSX Venture Exchange) accepts responsibility for the adequacy or accuracy of this release.
To view the source version of this press release, please visit https://www.newsfilecorp.com/release/249584
News Provided by Newsfile via QuoteMedia
Coelacanth Energy Inc. (TSXV: CEI) ("Coelacanth" or the "Company") is pleased to announce its 2024 year-end reserves as independently evaluated by GLJ Ltd. ("GLJ") effective December 31, 2024 (the "GLJ Report" or the "Report"), in accordance with National Instrument 51-101 ("NI 51-101") and the Canadian Oil and Gas Evaluation ("COGE") Handbook. All dollar figures are Canadian dollars unless otherwise noted.
Introduction
During 2024, Coelacanth drilled an additional 3 Lower Montney wells on its 5-19 pad and started the construction of pipelines and facilities to allow for the production of all 9 wells on the 5-19 pad to come on production in Q2 2025. The 9 wells consist of 7 Lower Montney wells, 1 Upper Montney well and 1 Basal Montney well that have tested over 11,000 boe/d (flush production) (1). On completion of phase 1 of the facility in May 2025, Coelacanth will have capacity to produce 30.0 mmcf/d of gas plus the concurrent oil production for a combined capacity of approximately 7,500-8,000 boe/d. Phase 2 (adding compression) is scheduled for Q4 2025 and will double capacity.
Coelacanth almost doubled its reserves from 2023 while still only having recognized reserves on less than 10% of its 150 section Montney land block at Two Rivers. A total of 23 combined wells and locations are included in the Report comprised of 13 drilled and completed Montney wells plus 10 Montney undeveloped locations. The 13 existing wells include 8 Lower Montney wells, 4 Upper Montney wells, and 1 Basal Montney well. All 10 undeveloped locations booked were Lower Montney leaving potential to book additional Upper and Basal Montney wells on the same lands. Coelacanth believes it has been conservative in its bookings and, over time, will be able to expand the current reserve base to cover a greater portion of the land base.
The Report includes a total of $148.3 million of future development capital ("FDC") of which $33.5 million is in Jan-May of 2025 for phase 1 of the facility. By the end of May, the capital for phase 1 of the facility will have been spent and all of the proved developed non-producing and probable developed non-producing reserves will change to producing status. These adjustments will have a material effect on the Report given the FDC for phase 1 of the facility will be removed (thereby increasing the overall value) and the producing portion of the Report will increase dramatically with wells coming on production. Coelacanth is planning to engage GLJ to provide a mid-year update of the Report to better illustrate the magnitude of the changes.
Coelacanth's business plan for the Two Rivers Montney Project includes:
Coelacanth is currently:
Coelacanth is excited to initiate its business plan to systematically develop the property, establish the ultimate reserve recoveries and move the established recoverable resource from land to its established producing reserve base.
Reserve Highlights
Coelacanth is pleased to report material increases in both reserves and value:
Notes:
(1) See "Test Results and Initial Production Rates".
Reserves Summary
Coelacanth's December 31, 2024 reserves as prepared by GLJ effective December 31, 2024 and based on the GLJ (2025-01) future price forecast are as follows: (1,4)
Working Interest Reserves (2) | Tight Oil (Mbbl) | Shale Natural Gas (Mmcf) | NGLs (Mbbl) | Total Oil Equivalent (Mboe) (3) |
Proved | ||||
Producing | 344 | 8,097 | 150 | 1,843 |
Developed non-producing | 1,874 | 38,862 | 720 | 9,071 |
Undeveloped | 1,137 | 27,324 | 506 | 6,197 |
Total proved | 3,355 | 74,283 | 1,376 | 17,111 |
Probable | 2,154 | 44,543 | 825 | 10,403 |
Total proved & probable | 5,509 | 118,826 | 2,201 | 27,515 |
Notes:
(1) Numbers may not add due to rounding.
(2) "Working Interest" or "Gross" reserves means Coelacanth's working interest (operating and non-operating) share before deduction of royalties and without including any royalty interest of Coelacanth.
(3) Oil equivalent amounts have been calculated using a conversion rate of six thousand cubic feet of natural gas to one barrel of oil.
(4) Disclosure of Net reserves are included in Company's Annual Information Form ("AIF") dated April 23, 2025 filed on SEDAR+ at www.sedarplus.ca. "Net" reserves means Coelacanth's working interest (operated and non-operated) share after deduction of royalties, plus Coelacanth's royalty interest in reserves.
Reserves Values
The estimated future net revenues before taxes associated with Coelacanth's reserves effective December 31, 2024 and based on the GLJ (2025-01) future price forecast are summarized in the following table: (1,2,3,4)
Discount factor per year | |||||
($000s) | 0% | 5% | 10% | 15% | 20% |
Proved | |||||
Producing | 21,615 | 17,655 | 14,827 | 12,765 | 11,220 |
Developed non-producing | 131,346 | 97,179 | 74,105 | 57,825 | 45,878 |
Undeveloped | 93,068 | 63,389 | 44,903 | 32,689 | 24,196 |
Total proved | 246,030 | 178,224 | 133,834 | 103,279 | 81,294 |
Probable | 221,362 | 147,285 | 105,806 | 80,431 | 63,701 |
Total proved & probable | 467,391 | 325,509 | 239,640 | 183,710 | 144,995 |
Notes:
(1) Numbers may not add due to rounding.
(2) The estimated future net revenues are stated prior to provision for interest, debt service charges or general administrative expenses and after deduction of royalties, operating costs, estimated well abandonment and reclamation costs and estimated future capital expenditures.
(3) The estimated future net revenue contained in the table does not necessarily represent the fair market value of the reserves. There is no assurance that the forecast price and cost assumptions contained in the GLJ Report will be attained and variations could be material. The recovery and reserve estimates described herein are estimates only. Actual reserves may be greater or less than those calculated.
(4) The after-tax present values of future net revenue attributed to Coelacanth's reserves are included in Company's AIF dated April 23, 2025 filed on SEDAR+ at www.sedarplus.ca.
Price Forecast
The GLJ (2025-01) price forecast is as follows:
Year | WTI Oil @ Cushing ($US / Bbl) | Edmonton Light Oil ($Cdn / Bbl) | AECO Natural Gas ($Cdn / Mmbtu) | Chicago Natural Gas ($US / Mmbtu) | Foreign Exchange (Cdn$/US$) |
2025 | 71.25 | 91.33 | 2.05 | 2.79 | 0.7050 |
2026 | 73.50 | 93.32 | 3.00 | 3.70 | 0.7300 |
2027 | 76.00 | 96.45 | 3.50 | 4.01 | 0.7500 |
2028 | 78.53 | 99.82 | 4.00 | 4.10 | 0.7500 |
2029 | 80.10 | 101.80 | 4.08 | 4.18 | 0.7500 |
2030 | 81.70 | 103.84 | 4.16 | 4.27 | 0.7500 |
2031 | 83.34 | 105.92 | 4.24 | 4.35 | 0.7500 |
2032 | 85.00 | 108.04 | 4.33 | 4.45 | 0.7500 |
2033 | 86.70 | 110.20 | 4.41 | 4.54 | 0.7500 |
2034 | 88.44 | 112.40 | 4.50 | 4.63 | 0.7500 |
Escalate thereafter (1) | 2.0% per year | 2.0% per year | 2.0% per year | 2.0% per year |
Note:
(1) Escalated at two per cent per year starting in 2034 in the January 1, 2025 GLJ price forecast with the exception of foreign exchange, which remains flat.
Reserve Life Index ("RLI")
Coelacanth's RLI presented below is based on estimated Q4 2024 average production of 1,084 boe per day.
Reserve Category | RLI |
Proved plus Probable Reserves | 69.0 |
Proved Reserves | 42.9 |
Reserves Reconciliation
The following summary reconciliation of Coelacanth's working interest reserves compares changes in the Company's reserves as at December 31, 2024 to the reserves as at December 31, 2023 based on the GLJ (2025-01) future price forecast: (1,2)
Total Proved | Tight Oil | Shale Natural Gas | NGLs | Total Oil Equivalent |
(Mbbl) | (Mmcf) | (Mbbl) | (Mboe) (3) | |
Opening balance | 2,291 | 44,784 | 720 | 10,475 |
Discoveries | - | - | - | - |
Extensions and improved recovery | 1,212 | 27,468 | 509 | 6,298 |
Technical revisions | (28) | 3,663 | 173 | 756 |
Acquisitions | - | - | - | - |
Dispositions | - | - | - | - |
Economic factors | (15) | (297) | (1) | (66) |
Production | (105) | (1,335) | (24) | (352) |
Closing balance | 3,355 | 74,283 | 1,376 | 17,111 |
Proved plus Probable | Tight Oil | Shale Natural Gas | NGLs | Total Oil Equivalent |
(Mbbl) | (Mmcf) | (Mbbl) | (Mboe) (3) | |
Opening balance | 3,038 | 60,432 | 970 | 14,080 |
Discoveries | - | - | - | - |
Extensions and improved recovery | 2,599 | 56,330 | 1,043 | 13,031 |
Technical revisions | (9) | 3,734 | 213 | 825 |
Acquisitions | - | - | - | - |
Dispositions | - | - | - | - |
Economic factors | (13) | (334) | - | (69) |
Production | (105) | (1,335) | (24) | (352) |
Closing balance | 5,509 | 118,826 | 2,201 | 27,515 |
Notes:
(1) Numbers may not add due to rounding.
(2) "Working Interest" or "Gross" reserves means Coelacanth's working interest (operating and non-operating) share before deduction of royalties and without including any royalty interest of Coelacanth.
(3) Oil equivalent amounts have been calculated using a conversion rate of six thousand cubic feet of natural gas to one barrel of oil.
Capital Expenditures
Capital allocation by category is as follows:
($000s) | 2024 | 2023 | 2022 |
Undeveloped land | 765 | 1,006 | 1,164 |
Acquisitions | 765 | 1,006 | 1,164 |
Drilling and completion | 38,353 | 61,274 | 9,009 |
Facilities and related infrastructure | 44,935 | 12,094 | 3,689 |
Geological, geophysical and other | 444 | 239 | 42 |
Exploration and development expenditures | 83,732 | 73,607 | 12,740 |
Total capital expenditures | 84,497 | 74,613 | 13,904 |
Finding and Development Costs ("F&D") and Finding, Development and Acquisition Costs ("FD&A")
Coelacanth has presented FD&A and F&D costs below:
2024 | 2023 | 2022 | 3 Year Cumulative | |||||
Proved & | Proved & | Proved & | Proved & | |||||
($000's, except where noted) | Proved | Probable | Proved | Probable | Proved | Probable | Proved | Probable |
Exploration and development expenditures | 83,732 | 83,732 | 73,607 | 73,607 | 12,740 | 12,740 | 170,079 | 170,079 |
Change in FDC (1) | (1,713) | 30,469 | 90,598 | 77,759 | 11,400 | 33,748 | 100,285 | 141,976 |
F&D costs | 82,019 | 114,201 | 164,205 | 151,366 | 24,140 | 46,488 | 270,364 | 312,055 |
Acquisitions | 765 | 765 | 1,006 | 1,006 | 1,164 | 1,164 | 2,935 | 2,935 |
FD&A costs | 82,784 | 114,966 | 165,211 | 152,372 | 25,304 | 47,652 | 273,299 | 314,990 |
Reserve Additions (Mboe) (2) | ||||||||
Exploration and development | 6,989 | 13,789 | 8,637 | 9,784 | 1,169 | 3,400 | 16,795 | 26,973 |
Acquisitions | - | - | - | - | - | - | - | - |
6,989 | 13,789 | 8,637 | 9,784 | 1,169 | 3,400 | 16,795 | 26,973 | |
F&D costs ($/boe) | 11.74 | 8.28 | 19.01 | 15.47 | 20.65 | 13.67 | 16.10 | 11.57 |
FD&A costs ($/boe) | 11.84 | 8.34 | 19.13 | 15.57 | 21.65 | 14.02 | 16.27 | 11.68 |
Notes:
(1) Future development capital ("FDC") expenditures required to recover reserves estimated by GLJ. The aggregate of the exploration and development costs incurred in the most recent financial period and the change during that period in estimated future development costs generally may not reflect total finding and development costs related to reserve additions for that period.
(2) Sum of extensions and improved recovery, technical revisions and economic factors in the reserves reconciliation included above.
For Coelacanth's full NI 51-101 disclosure related to its 2024 year-end reserves please refer to the Company's AIF dated April 23, 2025 filed on SEDAR+ at www.sedarplus.ca.
Forward-Looking Information
This news release contains forward-looking statements and forward-looking information within the meaning of applicable securities laws. The use of any of the words "expect", "anticipate", "continue", "estimate", "may", "will", "should", "believe", "intends", "forecast", "plans", "guidance" and similar expressions are intended to identify forward-looking statements or information.
More particularly and without limitation, this document contains forward-looking statements and information relating to the Company's oil, NGLs and natural gas production and reserves and reserves values, capital programs, and oil, NGLs, and natural gas commodity prices. The forward-looking statements and information are based on certain key expectations and assumptions made by the Company, including expectations and assumptions relating to prevailing commodity prices and exchange rates, applicable royalty rates and tax laws, future well production rates, the performance of existing wells, the success of drilling new wells, the availability of capital to undertake planned activities and the availability and cost of labor and services.
Although the Company believes that the expectations reflected in such forward-looking statements and information are reasonable, it can give no assurance that such expectations will prove to be correct. Since forward-looking statements and information address future events and conditions, by their very nature they involve inherent risks and uncertainties. Actual results may differ materially from those currently anticipated due to a number of factors and risks. These include, but are not limited to, the risks associated with the oil and gas industry in general such as operational risks in development, exploration and production, delays or changes in plans with respect to exploration or development projects or capital expenditures, the uncertainty of estimates and projections relating to production rates, costs and expenses, commodity price and exchange rate fluctuations, marketing and transportation, environmental risks, competition, the ability to access sufficient capital from internal and external sources and changes in tax, royalty and environmental legislation. The forward-looking statements and information contained in this document are made as of the date hereof for the purpose of providing the readers with the Company's expectations for the coming year. The forward-looking statements and information may not be appropriate for other purposes. The Company undertakes no obligation to update publicly or revise any forward-looking statements or information, whether as a result of new information, future events or otherwise, unless so required by applicable securities laws.
Reserves Data
There are numerous uncertainties inherent in estimating quantities of tight oil, shale gas, and NGLs reserves and the future cash flows attributed to such reserves. The reserve and associated cash flow information set forth above are estimates only. In general, estimates of economically recoverable tight oil, shale gas, and NGLs reserves and the future net cash flows therefrom are based upon a number of variable factors and assumptions, such as historical production from the properties, production rates, ultimate reserve recovery, timing and amount of capital expenditures, marketability of oil and natural gas, royalty rates, the assumed effects of regulation by governmental agencies and future operating costs, all of which may vary materially.
Individual properties may not reflect the same confidence level as estimates of reserves for all properties due to the effects of aggregation.
This news release contains estimates of the net present value of the Company's future net revenue from its reserves. Such amounts do not represent the fair market value of the Company's reserves.
The reserves data contained in this news release has been prepared in accordance with National Instrument 51-101 ("NI 51-101"). The reserve data provided in this news release presents only a portion of the disclosure required under NI 51-101. All of the required information will be contained in the Company's Annual Information Form for the year ended December 31, 2024, filed on SEDAR+ at www.sedarplus.ca.
Reserves are estimated remaining quantities of oil and natural gas and related substances anticipated to be recoverable from known accumulations, as of a given date, based on the analysis of drilling, geological, geophysical and engineering data; the use of established technology, and specified economic conditions, which are generally accepted as being reasonable. Reserves are classified according to the degree of certainty associated with the estimates as follows:
Proved Reserves are those reserves that can be estimated with a high degree of certainty to be recoverable. It is likely that the actual remaining quantities recovered will exceed the estimated proved reserves.
Probable Reserves are those additional reserves that are less certain to be recovered than proved reserves. It is equally likely that the actual remaining quantities recovered will be greater or less than the sum of the estimated proved plus probable reserves.
Industry Metrics
This news release contains metrics commonly used in the oil and natural gas industry. Each of these metrics is determined by the Company as set out below or elsewhere in this news release. These metrics are "F&D costs", "FD&A costs", and "reserve-life index". These metrics do not have standardized meanings and may not be comparable to similar measures presented by other companies. As such, they should not be used to make comparisons.
Management uses these oil and gas metrics for its own performance measurements and to provide shareholders with measures to compare the Company's performance over time, however, such measures are not reliable indicators of the Company's future performance and future performance may not compare to the performance in previous periods.
"F&D costs" are calculated by dividing the sum of the total capital expenditures for the year (in dollars) by the change in reserves within the applicable reserves category (in boe). F&D costs, including FDC, includes all capital expenditures in the year as well as the change in FDC required to bring the reserves within the specified reserves category on production.
"FD&A costs" are calculated by dividing the sum of the total capital expenditures for the year inclusive of the net acquisition costs and disposition proceeds (in dollars) by the change in reserves within the applicable reserves category inclusive of changes due to acquisitions and dispositions (in boe). FD&A costs, including FDC, includes all capital expenditures in the year inclusive of the net acquisition costs and disposition proceeds as well as the change in FDC required to bring the reserves within the specified reserves category on production.
The Company uses F&D and FD&A as a measure of the efficiency of its overall capital program including the effect of acquisitions and dispositions. The aggregate of the exploration and development costs incurred in the most recent financial year and the change during that year in estimated future development costs generally will not reflect total finding and development costs related to reserves additions for that year.
"Reserve life index" or "RLI" is calculated by dividing the reserves (in boe) in the referenced category by the latest quarter of production (in boe) annualized. The Company uses this measure to determine how long the booked reserves will last at current production rates if no further reserves were added.
BOE Conversions
BOE's may be misleading, particularly if used in isolation. A BOE conversion ratio of 6 Mcf: 1 Bbl is based on an energy equivalency conversion method primarily applicable at the burner tip and does not represent a value equivalency at the wellhead.
Abbreviations
Bbl | barrel |
Mbbl | thousands of barrels |
MMbtu | millions of British thermal units |
Mcf | thousand cubic feet |
MMcf | million cubic feet |
NGLs | natural gas liquids |
BOE | barrel of oil equivalent |
MBOE | thousands of barrels of oil equivalent |
WTI | West Texas Intermediate at Cushing, Oklahoma |
Test Results and Initial Production Rates
The 5-19 Lower Montney well was production tested for 9.4 days and produced at an average rate of 377 bbl/d oil and 2,202 mcf/d gas (net of load fluid and energizing fluid) over that period which includes the initial cleanup where only load water was being recovered. At the end of the test, flowing wellhead pressure and production rates were stable.
The A5-19 Basal Montney well was production tested for 5.9 days and produced at an average rate of 117 bbl/d oil and 630 mcf/d gas (net of load fluid and energizing fluid) over that period which includes the initial cleanup where only load water was being recovered. At the end of the test, flowing wellhead pressure and production rates were stable.
The B5-19 Upper Montney well was production tested for 6.3 days and produced at an average rate of 92 bbl/d oil and 2,100 mcf/d gas (net of load fluid and energizing fluid) over that period which includes the initial cleanup where only load water was being recovered. At the end of the test, flowing wellhead pressure and production rates were stable.
The C5-19 Lower Montney well was production tested for 5.8 days and produced at an average rate of 736 bbl/d oil and 2,660 mcf/d gas (net of load fluid and energizing fluid) over that period which includes the initial cleanup where only load water was being recovered. At the end of the test, flowing wellhead pressure and production rates were stable.
The D5-19 Lower Montney well was production tested for 12.6 days and produced at an average rate of 170 bbl/d oil and 580 mcf/d gas (net of load fluid and energizing fluid) over that period which includes the initial cleanup where only load water was being recovered. At the end of the test, flowing wellhead pressure and production rates were stable.
The E5-19 Lower Montney well was production tested for 11.4 days and produced at an average rate of 312 bbl/d oil and 890 mcf/d gas (net of load fluid and energizing fluid) over that period which includes the initial cleanup where only load water was being recovered. At the end of the test, flowing wellhead pressure was stable, and production was starting to decline.
The F5-19 Lower Montney well was production tested for 4.9 days and produced at an average rate of 728 bbl/d oil and 1,607 mcf/d gas (net of load fluid and energizing fluid) over that period which includes the initial cleanup where only load water was being recovered. At the end of the test, flowing wellhead pressure and production rates were stable.
The G5-19 Lower Montney well was production tested for 7.1 days and produced at an average rate of 415 bbl/d oil and 1,489 mcf/d gas (net of load fluid and energizing fluid) over that period which includes the initial cleanup where only load water was being recovered. At the end of the test, flowing wellhead pressure and production rates were stable.
The H5-19 Lower Montney well was production tested for 8.1 days and produced at an average rate of 411 bbl/d oil and 1,166 mcf/d gas (net of load fluid and energizing fluid) over that period which includes the initial cleanup where only load water was being recovered. At the end of the test, flowing wellhead pressure was stable and production was starting to decline.
A pressure transient analysis or well-test interpretation has not been carried out on these nine wells and thus certain of the test results provided herein should be considered to be preliminary until such analysis or interpretation has been completed. Test results and initial production rates disclosed herein, particularly those short in duration, may not necessarily be indicative of long-term performance or of ultimate recovery.
Any references to peak rates, test rates, IP30, IP90, IP180 or initial production rates or declines are useful for confirming the presence of hydrocarbons, however, such rates and declines are not determinative of the rates at which such wells will continue production and decline thereafter and are not indicative of long-term performance or ultimate recovery. IP30 is defined as an average production rate over 30 consecutive days, IP90 is defined as an average production rate over 90 consecutive days and IP180 is defined as an average production rate over 180 consecutive days. Readers are cautioned not to place reliance on such rates in calculating aggregate production for the Company.
For further information, please contact:
Coelacanth Energy Inc.
2110, 530 - 8th Ave SW
Calgary, Alberta T2P 3S8
Phone: (403) 705-4525
www.coelacanth.ca
Robert Zakresky
President and Chief Executive Officer
Nolan Chicoine
Vice President, Finance and Chief Financial Officer
Neither the TSX Venture Exchange nor its Regulation Services Provider (as that term is defined in the policies of the TSX Venture Exchange) accepts responsibility for the adequacy or accuracy of this release.
To view the source version of this press release, please visit https://www.newsfilecorp.com/release/249585
News Provided by Newsfile via QuoteMedia
Canadian Prime Minister Mark Carney has announced the country's first five nation-building projects.
In March and April, the Build Canada Strong platform was a cornerstone of Carney’s election campaign, which came amid increasing trade tensions between Canada and the US. Among his promises was to create a Major Projects Office (MPO) that would review projects deemed to be in the national interest.
That office was established over the summer, with a release saying it would be headquartered in Calgary and overseen by former TransAlta (TSX:TA,NYSE:TSE) and Trans Mountain CEO Dawn Farrell.
The MPO was created as part of a shift in the regulatory framework for approving infrastructure and resource projects in Canada. Part of that will involve streamlining reviews and assessments, as well as reducing duplication between the federal and provincial governments, an issue that has hindered investment in Canada over the last 20 years.
“One of many studies has shown that the regulatory requirements in Canada have increased by more than 40 percent since 2006 and that’s been suppressing investment growth by 9 percent,” Carney said on Thursday (September 11).
In his statement, the prime minister introduced the first tranche of projects, and suggested the second will be announced before the Canadian Football League’s Grey Cup match, scheduled for November 16.
He also outlined criteria for projects to be covered by the MPO. They must be in the national interest, and must strengthen Canada’s autonomy, resilience and security; they must also have clear benefits for Canadians.
The first group of projects selected by the MPO has already seen significant development.
The prime minister noted that they have already been through extensive consultation with Indigenous communities, and have worked with provincial and territorial governments to meet necessary regulatory standards.
For these, Carney said the goal is for the MPO to get them across the finish line.
“In some cases, they are in the last stages of regulatory approvals. In most cases, there is some aspect of the financing or support packages for the projects that remain to be determined,” he said.
Among the first five projects featured are three involving Canada's mining and energy sectors:
Additionally, the MPO has committed to supporting the Darlington New Nuclear Project in Clarington, Ontario. This project aims to develop the first small modular reactor in a G7 country.
The MPO will also help speed up the expansion of the Contrecour Terminal container project at the Port of Montreal. This expansion is expected to boost shipping volumes along the St. Lawrence Seaway.
A project that could be included in a future announcement is the Pathways Plus carbon capture project, which the prime minister said will eventually lead to further oil sands development and the construction of a pipeline to reach markets beyond the US. Additionally, Carney said the MPO is looking at upgrades to the Port of Churchill, as well as an Arctic economic and security corridor, a high-speed rail corridor between Toronto and Québec City and Wind West Atlantic Energy, which would provide wind power to the provinces on the Atlantic coast.
Don’t forget to follow us @INN_Resource for real-time updates!
Securities Disclosure: I, Dean Belder, hold no direct investment interest in any company mentioned in this article.
Hydrogen stocks are benefiting from cleantech sector momentum as the world moves closer to a green energy future.
The most abundant element on Earth, hydrogen is a colorless gas. It can be produced in liquid form and burned to generate electricity, or combined with oxygen atoms in fuel cells. In this way, hydrogen — which produces no carbon emissions — can replace fossil fuels in household heating, transportation and industrial processes such as steel manufacturing.
Rising demand for carbon-free energy sources alongside significant new government policies are driving growth in the hydrogen market.
It's worth noting that the downside to hydrogen as a clean energy source is that 99 percent of the hydrogen fuel currently in production is derived from power generated by coal or gas.
To combat this problem, some companies are pursuing green hydrogen, which is produced by splitting hydrogen atoms from oxygen using electrolyzers powered by renewable energy. This segment is projected to see massive growth over the next two decades led by increased output from China.
According to an August 2025 Commodity Insights report from S&P Global, in 2050 China is forecasted to produce 33.4 million metric tons of zero-emission electrolytic hydrogen, while the European Union will produce 20 million metric tons, and the US, 4.7 million. The firm's 2050 forecast for China tripled compared to last year's report as the country rapidly raises its production capacity and signs offtake agreements with green hydrogen projects globally.
Below the Investing News Network profiles the biggest hydrogen companies by market cap on US, Canadian and Australian stock exchanges. Data was gathered on September 2, 2025, using TradingView’s stock screener.
The US hydrogen market is well established, accounting for “more than half the world’s fuel cell vehicles, 25,000 fuel cell material handling vehicles, more than 8,000 small scale fuel systems in 40 states, and more than 550 MW of large-scale fuel cell power installed or planned,” according to the Fuel Cell and Hydrogen Energy Association.
The US was also the top exporter of hydrogen in 2023 with US$2.15 billion in exports based on data from the Observatory of Economic Complexity (OEC).
Looking at the medium to long term, the picture has become a little more opaque after the new Trump administration targeted some of the strong government incentives.
In July 2025, Congress cut the window for Section 45V hydrogen tax credits by five years, requiring green hydrogen projects to begin construction before 2028 to be eligible. The move comes alongside the Trump administration’s decision to delay hydrogen loans and cancel emissions-reduction grants.
These changes prompted Commodity Insights analysts to halve their forecast for 2050 US green hydrogen production to 4.7 million metric tons compared to their 2024 prediction of 9.3 million. The firm also reduced its 2030 forecast for US electrolyzer installations by 60 percent to 2.5 million gigawatts.
While green hydrogen faces setbacks, blue hydrogen remains supported by Section 45Q carbon capture credits and demand from Japan and South Korea.
Market cap: US$222.58 billion
Share price: US$474.69
Leading global industrial gases and engineering company Linde has been producing hydrogen for more than a century and is a pioneer in new hydrogen production technologies. Linde’s operations cover each step of the hydrogen value chain, from production and processing through distribution and storage. The company also uses its gases for industrial and consumer applications.
Globally, the company has more than 500 hydrogen production plants. Through its ITM Linde Electrolysis joint venture, Linde has become one of the world’s leading suppliers of green hydrogen produced using proton exchange membrane (PEM) electrolyzer technologies. This also makes it one of the few green hydrogen stocks.
In August 2024, Linde signed a US$2 billion long-term supply agreement to supply clean hydrogen to Dow (NYSE:DOW) subsidiary Dow Canada's Path2Zero project in Fort Saskatchewan, Alberta.
In response to the regulatory uncertainties under the Trump Administration, Linde announced in its Q4 2024 earnings call that 90 percent of its US clean hydrogen projects will be focused on blue hydrogen, which is created by reforming natural gas with carbon capture storage. Blue hydrogen is more cost effective to produce, and although it is not zero emission like green hydrogen, it is more environmentally friendly than grey hydrogen produced with coal.
While Linde does not report separated data for its hydrogen segment, the company's Q2 2025 results reported a 3 percent year-over-year uptick in overall sales to US$8.5 billion.
Market cap: US$64.83 billion
Share price: US$291.32
Founded in 1940, Air Products & Chemicals sells industrial gases and chemicals and provides related equipment and expertise to a wide range of industries, including the refining, chemical, metals, electronics, manufacturing, and food and beverage segments.
In addition to producing oxygen, nitrogen, argon and helium, the company operates more than 100 hydrogen plants and maintains the world’s largest hydrogen distribution network. Air Products has an extensive hydrogen-dispensing technology patent portfolio and has been involved in more than 250 hydrogen-fueling projects worldwide.
Air Products also has a joint venture project now under construction with ACWA Power (SR:2082) and NEOM Company in Saudi Arabia. Called the NEOM Green Hydrogen Complex, the operation will be powered by 4 gigawatts of renewable power from solar and wind to produce 600 metric tons per day of carbon-free hydrogen, which it says will be delivered in the form of green ammonia. Once production begins at the complex in 2026, Air Products will be the sole off-taker and plans to deliver the green ammonia to Europe's transport sector.
Air Products' Louisiana Clean Energy Complex, its largest US investment, is also making headway, with first production expected in 2028. The complex will produce blue hydrogen for power mobility and industrial markets in the Gulf Coast region and other markets.
In August 2025, Air Products completed the first fill of NASA’s new liquid hydrogen sphere, the largest of its kind in the world, delivering over 730,000 gallons of hydrogen. Standing 90 feet tall and 83 feet wide, the sphere will supply fuel for NASA’s Artemis missions, which aim to return humans to the Moon and establish a sustained lunar presence. The company has been working with NASA since 1957.
Market cap: US$53.97 billion
Share price: US$391.69
Indianapolis-based Cummins designs, manufactures and distributes engines, filtration and power-generation products with a specialization in diesel and alternative fuel engines and generators.
In March 2023, the company announced the launch of a new brand, Accelera, which features “a diverse portfolio of zero-emissions solutions, includ(ing) battery systems, fuel cells, ePowertrain systems and electrolyzers.” The brand encompasses Cummins' established battery electric and hydrogen fuel cell systems, as well as electrolyzers for hydrogen refueling stations. Shortly after, Accelera began production at its first US electrolyzer facility, located in the state of Minnesota.
The hydrogen fuel cell company showcased its next generation B6.7H hydrogen engine at the April 2024 Intermat Sustainable Construction Solutions and Technology Exhibition in Paris. The following month heralded the launch of Accelera's next-gen hydrogen fuel cell technology for commercial vehicles, specifically the FCE300 and FCE150 fuel cell engines.
Accelera inked a deal in February 2025 to supply a 100 megawatt PEM electrolyzer system for BP's (LSE:BP,NYSE:BP) Lingen green hydrogen project in Germany. The system is Accelera's largest to date and uses its HyLYZER PEM electrolyzer technology.
In March 2025, Cummins joined academics, energy leaders and transportation experts as a founding member of the Hydrogen Engine Alliance of North America, which aims to advance hydrogen internal combustion engines (H2-ICE) alongside zero-emission technologies to support sectors where electrification isn't possible yet. Cummins is preparing to launch its X15H hydrogen engine under its HELM platform.
Like its neighbor to the south, Canada is a world leader in hydrogen and fuel cell technologies, especially when it comes to innovation, research and development. The country reportedly generates C$200 million in hydrogen technology exports according to data from January 2023. In terms of the global hydrogen market, the country exported $385 million worth of hydrogen in 2023, ranking ninth overall according to the OEC.
The federal government is heavily invested in the sector both in terms of funding and the implementation of clean energy policies. “The Hydrogen Strategy for Canada laid out a framework that focuses low-carbon hydrogen as a tool to achieve our goal of net-zero emissions by 2050, while creating jobs, growing our economy, expanding exports and protecting our environment," Natural Resources Canada states.
In British Columbia, the Government of Canada invested C$9.4 billion to launch a new Clean Hydrogen Hub that will use electrolyzer technology and hydroelectricity to generate hydrogen that can be sold to industry users.
On the global stage, Canada and its trading partner Germany have agreed to each commit C$300 million for a total of C$600 million to launch Atlantic Canada's hydrogen export industry, which will send hydrogen to Germany. However, delays due to factors including high hydrogen prices and inflation as well as lack of infrastructure have pushed the expected start of exports back from 2025.
Market cap: C$775.49 million
Share price: C$2.64
Ballard Power Systems is a global leader in hydrogen fuel cell technology and is working to accelerate the adoption of this technology. The company develops and manufactures PEM fuel cell products that create electrical energy from the combination of hydrogen and air. Ballard's products are designed for heavy-duty trucks, buses, trains and marine applications, as well as backup power storage.
Two of Ballard’s 200 kilowatt fuel cell modules are located on the world’s first hydrogen-powered ferry, operated by Norwegian company Norled. The company also supplied its FCmove-HD hydrogen fuel cell modules to global carbon-reduction company First Mode, now owned by Cummins, which used them to power retrofits for several hybrid hydrogen and battery ultra-class mining haul trucks.
In early 2024, Ballard struck a deal to supply 100 FCmove-HD+ modules to NFI Group, which the pair raised to 200 in November. The fuel cells will be used in the latter's New Flyer next generation Xcelsior CHARGE FC hydrogen fuel cell buses, which will be deployed across the US and Canada. The company also announced in April of that year that it had secured its largest order ever — 1,000 hydrogen fuel cell engines to be supplied to European bus manufacturer Solaris between 2024 and 2027.
Ballard signed another multi-year supply agreement with an Egypt-based company named Manufacturing Commercial Vehicles, in which Ballard will supply 50 FCmove-HD+ fuel cell engines to support projects in the European Union with deliveries expected between 2025 and 2026.
In July 2025, the company initiated a restructuring strategy to reduce operating costs by 30 percent and achieve positive cash flow by the end of 2027. Ballard also penned a deal with eCap Marine to supply 6.4 MW fuel cells to be installed on two Samskip marine vessels.
During its Q2 2025 period, Ballard reported total revenue of US$17.8 million, up 11 percent year-on-year, while revenue from its heavy-duty mobility segment increased by 22 percent to US$16.1 million.
Market cap: C$126.35 million
Share price: C$3.55
Tidewater Renewables produces renewable diesel and hydrogen at its facilities located near Prince George in British Columbia, Canada. The plant has a nameplate capacity of 3,000 barrels per day of renewable diesel and 23.7 metric tons per day of hydrogen. It began production during Q4 2023 using feedstock that included soybean and canola oil.
Tidewater is now focused on expanding operations at the site to produce sustainable aviation fuel, targeting 2028 for first production.
For Q2 2025, Tidewater reported that its renewable diesel and renewable hydrogen (HDRD) complex operated at 72 percent capacity, down from 98 percent a year earlier, after a minor April 1 fire temporarily halted production. Operations resumed mid-April, with utilization improving steadily.
The company secured offtake contracts for more than 70 percent of its H2 2025 production in, planning to sell the remainder on the spot market.
Market cap: C$66.28 million
Share price: C$3.80
Headquartered in Vancouver, British Columbia, Westport Fuel Systems supplies advanced alternative fuel delivery components and systems to the transportation industry worldwide. This includes its high pressure direct injection (HPDI) fuel system for commercial vehicles, which can run on biogas, liquified natural gas (LNG), hydrogen and other alternative fuel products.
The company has operations in partnership with leading global transportation brands across more than 70 countries across Europe, Asia, North America and South America.
One of those partners is Swedish automaker Volvo Group (STO:VOLV-B). Under the Cespira joint venture, the pair has commercialized Westport’s HPDI fuel system technology for long-haul and off-road applications. As of mid-2025, the company reported there were 9,000 trucks on the road using the platform fueled by LNG.
In March 2025, Westport announced a binding deal to sell its Italian light-duty business, Westport Fuel Systems Italia, to Netherlands-based Heliaca Investments for US$73.1 million, with potential earnouts of up to US$6.5 million. The deal closed in July.
With a leaner focus, Westport announced its plans going forward, including opening a Hydrogen Innovation Center and manufacturing facility in China in late 2025, aiming to tap into the country’s rapidly growing hydrogen market. The site will focus on research, development and collaboration to support local demand and advance clean transportation solutions.
The company will also move its European manufacturing operations to its existing technology center in Canada, uniting its manufacturing capacity with its North American innovation hub. It also plans to increase its focus on expanding Cespira's market presence to North America.
Australia is another important hotspot for investing in hydrogen. The Australian Government says that "over AU$200 billion is currently in the investment pipeline for hydrogen and derivatives," accounting for 20 percent of announced renewable hydrogen projects worldwide.
The Australian government’s National Hydrogen Strategy, which it updated in 2023, highlights its intention to position the country as a “major player” in the global hydrogen market by 2030. To this end, Australia has partnered with a number of other nations on hydrogen technology.
Australia and Germany are working together on a hydrogen technology development program that will help Australia build out its capacity to export hydrogen to Germany as it seeks to reduce its reliance on fossil fuels. Through a partnership with Japan, Australia is developing new hydrogen fuel cell technology and looking to establish the world's first clean liquefied hydrogen export pilot project, and its government has invested more than AU$500 million in the development of regional hydrogen hubs across the country.
In May 2024, the Australian government announced an AU$22.7 billion package to bolster the country's domestic manufacturing and renewable energy sector, including AU$6.7 billion for renewable hydrogen production starting in mid-year 2028 through the 2039/2040 fiscal year.
Market cap: AU$91.62 million
Share price: AU$0.34
Technology development company Hazer Group is working to commercialize the HAZER Process, a low-emission hydrogen and graphite production process initially developed at the University of Western Australia. It uses iron ore as a process catalyst to convert natural gas and similar feedstocks into hydrogen for use as an industrial chemical and in fuel cells, as well as into high-quality synthetic graphite for use in lithium-ion batteries.
Hazer started operations at its commercial demonstration plant in early 2024 and it is now producing hydrogen and graphitic carbon.
In May 2024, the company inked an agreement with Canadian utility company FortisBC for the development of a hydrogen production facility in British Columbia that will use Hazer’s proprietary technology. The proposed commercial production facility will have a design capacity of up to 2,500 metric tons per year of clean hydrogen and approximately 9,500 metric tons per year of Hazer graphite.
The company announced in March 2025 that it had successfully completed its commercial reactor test program, validating a commercial scale-up reactor design. "The equipment was designed to mimic key aspects of the Hazer Process for producing hydrogen and graphite at commercial scale, and the completion of this testing is a major milestone for the government support from CleanBC," the press release states.
In June, Hazer entered a non-binding MOU with UK-based EnergyPathways to explore a hydrogen production facility within the Marram energy storage hub in Northwest England. The proposed plant would produce up to 20,000 metric tons of hydrogen annually, alongside ammonia and graphite using feedstock from Marram. Both parties plan to move toward a binding agreement following concept engineering studies.
In a July update, Hazer Group said its strategic alliance with Kellogg Brown and Root (NYSE:KBR) is advancing the global commercial rollout of the Hazer Process. Now in full execution, the partnership has deployed teams across Australia, the UK and the US.
Market cap: AU$82.11 million
Share price: AU$0.45
Gold Hydrogen is a natural hydrogen exploration and development company with a focus on making new hydrogen and helium discoveries in South Australia using recorded government data with modern exploration techniques.
Through exploration at its wholly owned Ramsay project in 2024, Gold Hydrogen has demonstrated air-corrected hydrogen purity levels of up to 95.8 percent, as well as helium purity levels of 20 to 25 percent in groundwater and up to 36.9 percent at surface.
“To have an initial world first to see Hydrogen and Helium to surface is very exciting for our further ongoing exploration and drilling programs in even better locations,” Gold Hydrogen Managing Director Neil McDonald stated in an August 2024 interview.
Gold Hydrogen announced in February 2025 that it had received a AU$6.45 million research and development tax refund associated with its natural hydrogen and helium exploration activities for the fiscal year ended June 30, 2024. The refund will help fund the company's 2025 work to delineate the hydrogen and helium accumulation at Ramsay with further drilling at its Ramsay-1 and Ramsay-2 wells.
In July, Gold Hydrogen received binding commitments for a AU$14.5 million strategic investment from Toyota Motor (NYSE:TM,TSE:7203), Mitsubishi Gas Chemical (TSE:4182) and ENEOS Xplora. The proceeds will support its Q4 drill program, and also be used towards advancing commercialization opportunities through the strategic collaboration.
Market cap: AU$36.23 million
Share price: AU$0.09
Pure Hydrogen is focused on becoming a leading producer and supplier of hydrogen and hydrogen-fuel-cell-powered vehicles such as buses and waste collection vehicles. The company has several partnerships with companies for its technology. Pure Hydrogen’s hydrogen-fuel-cell-powered Prime Mover truck was displayed at the Brisbane Truck Show in 2023.
Pure Hydrogen has a 40 percent stake in the Turquoise Group, an Australian clean energy company, as well as exclusive long-term acquisition rights for the company's future hydrogen production. Turquoise Group announced in May 2024 that it had produced the first graphene powder and hydrogen during testing at its commercial demonstration plant in Brisbane, Queensland.
In August 2024, Pure Hydrogen registered Australia's first hydrogen-powered semi-truck, the Hydrogen Fuel Cell 110kW 6x4 Prime Mover.
Pure Hydrogen's majority-owned subsidiary HDrive confirmed in January 2025 that it had sold two Taurus 70 metric ton hydrogen fuel cell prime movers to Australian logistics services provider TOLL Transport as part of a broader AU$2 million package. The vehicles are slated for delivery in the fourth quarter of the calendar year.
In April, Pure Hydrogen executed a commercial agreement with hydrogen technology provider Hydrexia, granting access to Hydrexia's mobile hydrogen refueling stations and related service support through a phased delivery. Hydrexia specializes in hydrogen solutions for production, storage, transport and end-use applications.
As noted in the statement, the rollout marks the first stage of broader cooperation between the companies to support hydrogen development in Australia and internationally.
Pure Hydrogen signed a strategic distribution deal for the South American market with an Argentinian renewable energy company in July.
The company has also made multiple significant sales of its hydrogen fuel cell trucks in Q3, including its first North American sale of a hydrogen cell refuse truck as part of a term sheet with California-based Riverview International Trucks. In the Australian market, it sold two Prime Mover trucks to one company and a second concrete agitator truck to another, worth over AU$3 million combined.
Pure Hydrogen proposed a rebranding and company name change to Pure One in July, which shareholders will vote on at its annual general meeting later this year.
According to research from TWI Global, there are pros and cons to both electric vehicles (EVs) and hydrogen vehicles. In terms of range and charging time, hydrogen beats electric hands down. However, while a hydrogen-powered vehicle doesn’t need much time to refuel compared to an EV, there is still much more EV charging infrastructure currently available compared to hydrogen fueling stations. EVs are also cheaper to purchase than hydrogen vehicles. As far as safety and emissions are concerned, it's a draw between the two.
Elon Musk’s SpaceX has used hydrogen to fuel its rockets, and in 2023 Musk talked about hydrogen playing an important role in industrial applications, such as steelmaking. However, he has balked at the idea of hydrogen fueling vehicles, calling fuel cells “fool sells.” Speaking at a Financial Times conference in May 2022, Musk said, “It’s important to understand that if you want a means of energy storage, hydrogen is a bad choice.”
Starting in 2024, rumors began spreading that Tesla (NASDAQ:TSLA) was planning to launch a Tesla Model H powered by hydrogen, but they have been proven false.
Toyota first invested in hydrogen fuel cell technology in 1992 as its executives saw clean energy as the future of transport. However, with EVs dominating the clean car space, the automaker began to shift its focus to compete with its peers. Toyota brought its newest hydrogen-powered vehicle to market in the fall of 2023 — a revamped Crown sedan that also has a hybrid-electric version. The following year, the auto maker introduced the first prototype of its Toyota Hilux trucks with a hydrogen fuel cell powertrain.
In 2025, Toyota shared its long-term strategy for developing hydrogen passenger vehicles as well as hydrogen technologies for long-haul freight.
Some countries leading in green and blue hydrogen production are the US, Germany and Canada. Many countries around the world have released clean hydrogen strategies, including the US, Canada and many countries in the Europe Union. However, clean hydrogen production is still in the early phases as countries develop infrastructure.
Don't forget to follow us @INN_Resource for real-time news updates!
Securities Disclosure: I, Georgia Williams, hold no direct investment interest in any company mentioned in this article.
Editorial Disclosure: Westport Fuel Systems is a client of the Investing News Network. This article is not paid-for content.
(TheNewswire)
Brossard (Québec) TheNewswire - le 5 septembre 2025 - CORPORATION CHARBONE HYDROGÈNE (TSXV: CH,OTC:CHHYF OTCQB: CHHYF, FSE: K47 ) (« Charbone » ou la « Société »), une compagnie spécialisée dans la production et la distribution d'hydrogène vert, est heureuse d'annoncer la signature, le 4 septembre 2025, d'une convention d'achat d'actifs visant l'acquisition d'équipements opérationnels de production et de ravitaillement en hydrogène au Québec. Cette acquisition stratégique permettra à Charbone d'accélérer la mise en service de la phase 1 de son usine phare de Sorel-Tracy et de produire et livrer ses premières ventes d'hydrogène industriel de haute pureté (UHP) au cours du prochain trimestre.
Les équipements, seront démantelés, convertis et relocalisés à Sorel-Tracy.
Cette transaction fait suite à la signature par Charbone d' une facilité de capital de construction non dilutive de 50 millions USD annoncée le 1er mai et 4 juin 2025. Bien que cette facilité soit destinée à un financement de projet plus large plutôt qu'à cet achat d'équipements, elle démontre la position de capital renforcée de Charbone et sa capacité à étendre son plan de développement global.
Points saillants pour les investisseurs clés
Échéancier accéléré : La réutilisation des équipements en opération réduit les coûts d'installation des nouveaux équipements — permettant une production d'ici le début du T4 2025
Processus de sélection : Charbone a été sélectionné comme acheteur de l'équipement en échange de 1 M$ en actions de Charbone dans le cadre d'une partie du prix d'achat à un prix d'émission égal au cours du marché des actions de Charbone à la Bourse de croissance TSX à la date effective, plus la balance en espèces payable en 3 tranches, avec un tiers du paiement à la date effective et le reste payé sur deux ans — préservant la trésorerie pour la croissance.
Progrès opérationnels : Le raccordement au réseau est complété; Hydro-Québec a installé le compteur d'énergie le 22 juillet et complété l'interconnexion le 13 août, tandis que la Ville de Sorel-Tracy a complété le raccordement d'eau à son réseau principal, fournissant ainsi au site les deux éléments nécessaires à la production d'hydrogène.
Détails du placement privé
Par ailleurs, Charbone est heureuse d'annoncer la clôture séquentielle de son placement privé sans intermédiaire de 1 M$ (le « placement d'actions »). La Société a déjà obtenu 0,5 M$ pour accélérer l'achèvement de son usine phare de production d'hydrogène vert à Sorel-Tracy, au Québec.
La première tranche comprenait l'émission de 7 699 666 unités. Une deuxième tranche, portant sur les 0,5 M$ restants, devrait être clôturée d'ici le 15 octobre 2025.
Le produit de l'émission d'actions sera principalement affecté à l'achat par la Société des équipements d'hydrogène, à la réinstallation sur le site de Sorel-Tracy, au développement des infrastructures et aux besoins généraux en fonds de roulement.
Chacune des unités offertes (chacune une « unit »), au prix de 0,06 $ l'unité, était composée d'une action ordinaire de la Société (chacune une « action unitaire ») et d'un bon de souscription d'action ordinaire (chacun un « bon de souscription »). Chaque bon de souscription donne droit à son porteur d'acheter une action ordinaire supplémentaire de la Société au prix d'exercice de 0,08 $ pendant une période de 24 mois suivant la date de clôture du placement (la « date de clôture »). À la date de clôture, la Société a payé des commissions d'intermédiaires de 17 222 $ et a émis 287 040 bons de souscription à des intermédiaires inscrits dans le cadre de la vente de certaines unités à des souscripteurs qualifiés qu'ils ont présentés à la Société. Les Unités sont offertes aux termes des dispenses d'« investisseur qualifié » et d'« investissement d'une somme minimale » prévues au èglement 45-106 sur les dispenses de prospectus . Toutefois, la Société se réserve le droit de ne pas accepter des montants de souscription inférieurs à 5 000 $ (83 333 unités) afin d'éviter des frais administratifs disproportionnés
La clôture de l'offre d'actions demeure soumise à l'approbation de la Bourse de croissance TSX et à d'autres conditions de clôture habituelles. La Société pourrait clôturer une deuxième tranche dans les prochains jours, mais au plus tard le 15 octobre 2025. Tous les titres émis dans le cadre de l'offre sont assujettis à une période de détention légale de quatre mois et un jour au Canada après la date de clôture
Ce communiqué de presse ne constitue pas une offre de vente ni une sollicitation d'une offre d'achat, et aucune valeur mobilière ne peut être vendue dans une juridiction dans laquelle une telle offre, sollicitation ou vente serait illégale, y compris l'intégralité des valeurs mobilières aux États-Unis d'Amérique. Les valeurs mobilières n'ont pas été et ne seront pas enregistrées en vertu du United States Securities Act de 1933, tel que modifié (la « Loi de 1933 »), ou de toute autre loi sur les valeurs mobilières, et ne peuvent être offertes ou vendues aux États Unis ou à des, ou pour le compte ou au profit de, "U.S. Persons" (telles que définies dans la « Regulation S » de la Loi de 1933), à moins qu'elles ne soient enregistrées en vertu de la Loi de 1933 et des lois applicables sur les valeurs mobilières, ou qu'une dispense de telles exigences d'enregistrement ne soit disponible. Le texte du communiqué issu d'une traduction ne doit d'aucune manière être considéré comme officiel. La seule version du communiqué qui fasse foi est celle du communiqué dans sa langue d'origine. La traduction devra toujours être confrontée au texte source, qui fera jurisprudence.
Commentaire du PDG
"Les investisseurs ont attendu que Sorel-Tracy passe du développement à la production de revenus," a déclaré Dave Gagnon, Président et Chef de la direction de Charbone. " En réutilisant des équipements éprouvés — et ce à moindre coût que de nouvelles installations — et en structurant l'opération pour préserver la trésorerie, nous entrons en mode d'exécution avec un soutien en capital solide et une dilution minimale. Il continue; Cette acquisition nous permet de fournir de l'hydrogène vert et de haute pureté (UHP) à nos clients industriels plus rapidement et avec de bons équipements d'exploitation dans leurs catégories. "
Pourquoi c'est important
Cette acquisition marque un tournant pour Charbone : après des années de développement, l'entreprise est en mesure de générer ses premiers revenus liés à l'hydrogène, de tirer parti d'un capital non dilutif pour évoluer et de saisir les avantages d'être pionnier sur le marché nord-américain de l'hydrogène vert.
À propos de Corporation Charbone Hydrogène
Charbone est une entreprise intégrée spécialisée dans l'hydrogène ultrapur (UHP) et la distribution stratégique de gaz industriels en Amérique du Nord et en Asie-Pacifique. Elle développe un réseau modulaire de production d'hydrogène vert tout en s'associant à des partenaires de l'industrie pour offrir de l'hélium et d'autres gaz spécialisés sans avoir à construire de nouvelles usines coûteuses. Cette stratégie disciplinée diversifie les revenus, réduit les risques et augmente sa flexibilité. Le groupe Charbone est coté en bourse en Amérique du Nord et en Europe sur la bourse de croissance TSX (TSXV: CH,OTC:CHHYF); sur les marchés OTC (OTCQB: CHHYF); et à la Bourse de Francfort (FSE: K47). Pour plus d'informations, visiter www.charbone.com .
Énoncés prospectifs
Le présent communiqué de presse contient des énoncés qui constituent de « l'information prospective » au sens des lois canadiennes sur les valeurs mobilières (« déclarations prospectives »). Ces déclarations prospectives sont souvent identifiées par des mots tels que « a l'intention », « anticipe », « s'attend à », « croit », « planifie », « probable », ou des mots similaires. Les déclarations prospectives reflètent les attentes, estimations ou projections respectives de la direction de Charbone concernant les résultats ou événements futurs, sur la base des opinions, hypothèses et estimations considérées comme raisonnables par la direction à la date à laquelle les déclarations sont faites. Bien que Charbone estime que les attentes exprimées dans les déclarations prospectives sont raisonnables, les déclarations prospectives comportent des risques et des incertitudes, et il ne faut pas se fier indûment aux déclarations prospectives, car des facteurs inconnus ou imprévisibles pourraient faire en sorte que les résultats réels soient sensiblement différents de ceux exprimés dans les déclarations prospectives. Des risques et des incertitudes liés aux activités de Charbone peuvent avoir une incidence sur les déclarations prospectives. Ces risques, incertitudes et hypothèses comprennent, sans s'y limiter, ceux décrits à la rubrique « Facteurs de risque » dans la déclaration de changement à l'inscription de la Société datée du 31 mars 2022, qui peut être consultée sur SEDAR à l'adresse www.sedar.com; ils pourraient faire en sorte que les événements ou les résultats réels diffèrent sensiblement de ceux prévus dans les déclarations prospectives.
Sauf si les lois sur les valeurs mobilières applicables l'exigent, Charbone ne s'engage pas à mettre à jour ni à réviser les déclarations prospectives.
Ni la Bourse de croissance TSX ni son fournisseur de services de réglementation (tel que ce terme est défini dans les politiques de la Bourse de croissance TSX) n'acceptent de responsabilité quant à la pertinence ou à l'exactitude du présent communiqué.
Pour contacter Corporation Charbone Hydrogène :
Téléphone bureau: +1 450 678 7171 | ||
Courriel: ir@charbone.com Benoit Veilleux Chef de la direction financière et secrétaire corporatif |
Copyright (c) 2025 TheNewswire - All rights reserved.
News Provided by TheNewsWire via QuoteMedia
(TheNewswire)
Brossard, Quebec TheNewswire - September 5, 2025 Charbone Hydrogen Corporation (TSXV: CH,OTC:CHHYF; OTCQB: CHHYF; FSE: K47) (the "Company" or "CHARBONE "), a company focused on green hydrogen production and distribution, is pleased to announce it has signed, on September 4, 2025, an Asset Purchase Agreement to acquire operational hydrogen production and refuelling equipment in Quebec. The strategic acquisition will enable CHARBONE to fast-track the commissioning of CHARBONE's flagship Sorel-Tracy facility phase 1 and empower CHARBONE to produce and deliver first industrial high purity hydrogen (UHP) sales in the upcoming quarter.
The equipment, currently in use will be dismantled, repurposed and relocated to Sorel-Tracy .
This transaction follows CHARBONE's signing of a non-dilutive USD 50 million construction capital facility announced on May 1 and June 4, 2025. While this facility is earmarked for broader project financing rather than this equipment purchase, it demonstrates CHARBONE's strengthened capital position and ability to scale up its overall development plan.
Key Investor Highlights
Accelerated Timeline : Repurposing proven operating equipment reduces installation costs of new equipment — enabling production by early Q4 2025
Selection Process : CHARBONE has been selected as the buyer of the equipment as the seller has accepted $1M in CHARBONE stock as part of a portion of the purchase price at an issue price equal to the market price of CHARBONE's shares on the TSX Venture Exchange on the effective date plus a cash balance payable in 3 tranches payment , with one-third payment on the effective date and the remaining paid over two years — preserving cash for growth.
Operational Progress : Grid connection is completed; Hydro-Québec installed the energy meter on July 22, and completed the interconnection on August 13, while the Town of Sorel-Tracy completed the water connection to its main system, providing the site with the two elements needed for hydrogen production.
Private Placement Details
Additionally, CHARBONE is pleased to announce the sequential closings of its $1M non-brokered private placement (the "Equity Offering"). The Company has already secured $0.5 million to accelerate the completion of its flagship green hydrogen production facility in Sorel-Tracy, Quebec.
The initial tranche involved the issuance of 7,699,666 units. A second tranche for the remaining $0.5M is expected to close by October 15, 2025.
The proceeds from the Equity Offering will be primarily allocated to the Company's purchase of the operating hydrogen equipment, re-installation at the Sorel-Tracy site, and infrastructure development, and general working capital requirements.
Each of the units offered (each a Unit "), priced at $0.06 per Unit, included one common share of the Company (each, a " Unit Share ") and one common share purchase warrant (each, a " Warrant "). Each Warrant gives the holder the right to buy one additional common share of the Company at an exercise price of $ 0.08 for 24 months after the closing date of the Offering (the Closing Date "). At the Closing Date, the Company paid a finder's fee of $17,222 and issued 287,040 finder's warrants to registered dealers related to the sale of certain Units to qualified subscribers introduced by such dealers. The Units were offered under the "accredited investor" exemptions of National Instrument 45-106 – Prospectus Exemptions (in Québec, Regulation 45-106 – Prospectus Exemptions ). However, the Company reserves the right to decline subscription amounts below $5,000 (83,333 Units) to avoid excessive administrative costs.
The closing of the Equity Offering remains subject to the approval of the TSX Venture Exchange and other customary closing conditions. The Company may close a second tranche in the coming days, but no later than October 15, 2025. All securities issued under the Offering are subject to a statutory four-month and one-day hold period in Canada following the Closing Date
This news release does not constitute an offer to sell or a solicitation of an offer to buy, nor shall there be any sale of securities in any jurisdiction where such offer, solicitation, or sale would be unlawful, including in the United States. The securities have not been and will not be registered under the United States Securities Act of 1933, as amended (the 1933 Act ") or any applicable state securities laws and may not be offered or sold within the United States or to, or for the account or benefit of, U.S. Persons (as defined in Regulation S under the 1933 Act) unless registered under the 1933 Act and relevant state laws, or if an exemption from registration is available
CEO Comment
"Investors have waited for Sorel-Tracy to move from development to revenue," said Dave Gagnon, President and CEO of CHARBONE. "By repurposing proven equipment — at a lower cost of a new build — and structuring the deal to preserve cash, we're entering execution mode with strong capital backing and minimal dilution. He continues; This acquisition positions us to deliver green and high purity hydrogen (UHP) to our industrial customers quicker, and with best-in-class operating equipment. "
Why This Matters
This acquisition signals a turning point for CHARBONE: after years of development, the company is positioned to deliver its first hydrogen revenues, leverage non-dilutive capital to scale, and capture early-mover advantages in the North American green hydrogen market.
About Charbone Hydrogen CORPORATION
CHARBONE is an integrated company specialized in Ultra High Purity (UHP) hydrogen and the strategic distribution of industrial gases in North America and the Asia-Pacific region. It is developing a modular network of green hydrogen production while partnering with industry players to supply helium and other specialty gases without the need to build costly new plants. This disciplined strategy diversifies revenue streams, reduces risks, and increases flexibility. The CHARBONE group is publicly listed in North America and Europe on the TSX Venture Exchange (TSXV: CH,OTC:CHHYF), the OTC Markets (OTCQB: CHHYF), and the Frankfurt Stock Exchange (FSE: K47). For more information, visit www.charbone.com .
Forward-Looking Statements
This news release contains statements that are "forward-looking information" as defined under Canadian securities laws ("forward-looking statements"). These forward-looking statements are often identified by words such as "intends", "anticipates", "expects", "believes", "plans", "likely", or similar words. The forward-looking statements reflect management's expectations, estimates, or projections concerning future results or events, based on the opinions, assumptions and estimates considered reasonable by management at the date the statements are made. Although Charbone believes that the expectations reflected in the forward-looking statements are reasonable, forward-looking statements involve risks and uncertainties, and undue reliance should not be placed on forward-looking statements, as unknown or unpredictable factors could cause actual results to be materially different from those reflected in the forward-looking statements. The forward-looking statements may be affected by risks and uncertainties in the business of Charbone. These risks, uncertainties and assumptions include, but are not limited to, those described under "Risk Factors" in the Corporation's Filing Statement dated March 31, 2022, which is available on SEDAR at www.sedar.com; they could cause actual events or results to differ materially from those projected in any forward-looking statements.
Except as required under applicable securities legislation, Charbone undertakes no obligation to publicly update or revise forward-looking information.
Neither TSX Venture Exchange nor its Regulation Services Provider (as that term is defined in policies of the TSX Venture Exchange) accepts responsibility for the adequacy or accuracy of this release .
Contact Charbone Hydrogen Corporation | |
Telephone: +1 450 678 7171 | |
Email: ir@charbone.com Benoit Veilleux CFO and Corporate Secretary |
Copyright (c) 2025 TheNewswire - All rights reserved.
News Provided by TheNewsWire via QuoteMedia
Brazil’s expanding natural gas market, supported by an attractive and stable regulatory framework and fiscal regime, presents a unique opportunity for Alvopetro Energy to leverage its high-potential upstream and midstream assets. In early 2025, Alvopetro also announced a strategic entry into Western Canada focused on the prolific Mannville stack play fairway in Saskatchewan. With capital investment opportunities in Canada and Brazil, Alvopetro is on the pathway for long-term growth.
Alvopetro Energy (TSXV:ALV;OTCQX:ALVOF) is an independent energy company focused on unlocking onshore natural gas in Brazil while expanding its footprint into Canada. The company is recognized as Brazil’s first integrated onshore natural gas producer, having established a unique model that combines upstream production, midstream infrastructure and long-term sales agreements with stable pricing linked to Brent and Henry Hub benchmarks.
Since commencing production in 2020, Alvopetro has delivered strong operating results, sector-leading netbacks and consistent dividends. With a disciplined capital allocation strategy, approximately half of the cash flow from operations has been reinvested in organic growth, while the remainder has been returned to shareholders through dividends, debt reduction and share repurchases. This balance has underpinned exceptional shareholder returns, including a cumulative 1,495 percent total shareholder return since 2018.
Alvopetro’s growth is anchored by two pillars: its high-margin natural gas business in the Recôncavo Basin of Bahia, Brazil, and its newly established Western Canadian heavy oil platform. Together, these assets provide a diversified base of production and reserves, supporting near-term growth and long-term value creation.
Headquartered in Calgary, Canada, and operating in Salvador, Brazil, Alvopetro is led by a proven management team with extensive international oil and gas experience. The company is committed not only to profitable growth but also to sustainable development, investing in local communities through education, entrepreneurship, cultural programs and biodiversity initiatives.
The company’s flagship Caburé asset has historically delivered the majority of the company’s production. The project is a joint development of a conventional natural gas discovery across four blocks, two held by Alvopetro and two by its partner.
Following the first redetermination in 2024, Alvopetro’s working interest in Cabure increased to 56.2 percent, entitling the company to a larger share of production. The unitized area includes eight producing wells and all necessary production facilities. Gross unit production capacity has increased by 33 percent to 21.2 million cubic feet per day (MMcfpd), and an ongoing development program includes five additional wells, four of which have already been drilled.
Immediately north of Caburé, Murucututu is a 100 percent owned Alvopetro asset with significant growth potential. Independent reserves evaluators have assigned 2P reserves of 4.6 MMboe, with an additional 4.5 MMboe of risked best estimate contingent resources and 10.2 MMboe of risked best estimate prospective resources.
The company successfully completed the 183-A3 well in 2024 and drilled the 183-D4 well updip of the 183-A3 well in 2025, bringing the 183-D4 well online in August 2025, which achieved initial production of 953 barrels of oil equivalent per day (boepd). With field production facilities already in place, Alvopetro plans a multi-year development program targeting both the Gomo and Caruaçu formations, including at least six more development wells.
Alvopetro owns and operates all of the key infrastructure needed to process and deliver its natural gas. Production from Caburé and Murucututu is transported via Alvopetro’s 11-kilometre transfer pipeline to its UPGN gas processing facility, which has a capacity of more than 18 MMcfpd.
At the UPGN, condensate and water are removed, with condensate sold at a premium to Brent. Processed natural gas is delivered to the Bahiagás city gate, with onward transportation through a 15-kilometre distribution pipeline into Bahia’s Camacari industrial complex. Under the long-term gas sales agreement with Bahiagás, pricing is set quarterly based on Brent and Henry Hub benchmarks. An updated agreement, effective January 1, 2025, increased firm sales volumes by 33 percent, further securing Alvopetro’s cash flow stability.
Beyond Brazil, Alvopetro has expanded its global footprint into North America with the establishment of a new heavy oil growth platform in Western Canada. The company holds a 50 percent working interest in 27.5 sections (8,890 net acres) of Mannville conventional heavy oil lands in Alberta and Saskatchewan, in partnership with an experienced operator, where we are deploying leading edge open hole multilateral drilling technology:
The diagram above depicts the evolution of drilling technology to develop a ¼ section of land. On the far left, traditional development would have required 32 vertical wells. Technology then advanced to horizontal wells, as depicted in the middle of the diagram with 4 separate wells. Today, multilateral drilling technology (as depicted on the far right) allows for just a single well with 6+ open-hole lateral legs developing the ¼ section of land. Alvopetro’s first 2 wells drilled in Saskatchewan each included 6 lateral legs. A total of 15 km of open-hole horizontal legs were drilled.
The Mannville stack is a multi-zone fairway with shallow depths, lower geological risk and attractive drilling economics. The first two earning wells were drilled with more than 15 km of open hole and brought into production in April 2025. Two additional wells were drilled in Big Gully in July 2025, with more than 19 km of open hole, with oil sales from the new wells are expected to commence in September 2025.
With the potential for more than 100 drilling locations, the Canadian platform provides Alvopetro with a complementary source of long-term production growth.
Corey C. Ruttan is the president, chief executive officer and director of Alvopetro. He was the president and CEO of Petrominerales, from May 2010 until it was acquired by Pacific Rubiales Energy in November 2013. Prior to that, he was the vice-president of finance and chief financial officer of Petrominerales. From March 2000 to May 2010, Ruttan was the senior vice-president and chief financial officer of Petrobank Energy and Resources, and held increasingly senior positions with Petrobank since its inception in 2000. He also served as executive vice-president and chief financial officer of Lightstream Resources from October 2009 to May 2010; served as vice-president of Caribou Capital from June 1999 to March 2000; and manager financial reporting of Pacalta Resources from May 1997 to June 1999. He began his career at KPMG where he worked from September 1994 to May 1997. Ruttan obtained his Bachelor of Commerce degree majoring in accounting from the University of Calgary in 1994 and his chartered accountant designation in 1997.
Alison Howard is a chartered accountant with over 20 years of experience in Canadian and international taxation, accounting and finance. Howard joined Petrominerales in July 2011 as a tax manager and was subsequently promoted to tax director. From May 2008 to July 2011, Howard was the tax manager at Petrobank Energy and Resources. Prior to that, Howard spent a number of years at Deloitte LLP in Calgary. She obtained her Bachelor of Commerce degree from the University of Saskatchewan in 1999.
Adrian Audet joined Petrominerales in 2013 and has held increasingly senior roles with Alvopetro since its inception. Audet has spent extensive time in Bahia overseeing the operations, realizing extensive cost savings and improvements in efficiency. Previously, Audet held engineering roles with increasing responsibility in the oil and gas industry. Audet began his career in 2006 and completed his masters and undergraduate degrees in mechanical engineering at the University of Alberta. Audet is a professional engineer registered with APEGA and is a CFA charterholder.
Nanna Eliuk is a professional geophysicist (M.Sc.) with over 23 years of diversified petroleum exploration and development experience. She has expertise in conventional and unconventional plays in both carbonate and clastic reservoirs in different depositional and structural settings (including pre-salt) in various basins around the world. Prior to joining Alvopetro, Eliuk was the senior explorationist of Condor Petroleum (Kazakhstan) for two years, and prior thereto, she was the vice-president of geophysics and land for Waldron Energy. Eliuk started her career in 1997, holding progressively senior roles at Husky Energy for five years, and at Compton Petroleum for over six years. Her extensive experience includes geophysical evaluation and analysis for business development opportunities and new ventures in various international basins, along with regional mapping, play fairway analysis, petroleum system evaluation, prospect definition, and seismic attribute analysis. Eliuk holds a masters degree in geology and geophysics, and a BSc. in geology.
Darcy Reynolds, P.Geo is the Western Canadian Business Unit Lead with over 20 years of subsurface and asset evaluation experience across Western Canada. For the past 12 years, Reynolds has focused on heavy oil development, including horizontal multilateral wells, enhanced oil recovery (waterflood, polymer, CO₂), and thermal SAGD projects. He has held senior leadership and technical roles at Rubellite Energy (senior geologist), Cenovus Energy (geoscience director), Husky Energy (geoscience director), and Talisman Energy (geology manager). Reynolds holds a B.Sc. in Geology from the University of Alberta and is a registered professional geoscientist with APEGA
Frederico Oliveira has held increasingly senior roles since 2008 and has expertise in regulations, contracts, partnerships, management and cost efficiency. He has held management roles in large private companies in Brazil, performing strategic planning, project implementation, process restructuring, efficiency and productivity improvements, and cost control. Oliveira obtained an MBA from the Federal University of Minas Gerais in 2004 and a Bachelor of Science degree in Mechanical Engineering from the Pontificia Universidade Catolica de Minas Gerais.
(TheNewswire)
Brossard, Quebec, September 4, 2025 TheNewswire - Charbone Hydrogen Corporation (TSXV: CH,OTC:CHHYF; OTCQB: CHHYF; FSE: K47) (the "Company" or "CHARBONE "), a company focused on green hydrogen production and distribution, is pleased to announce it has signed, on September 4, 2025, an Asset Purchase Agreement to acquire operational hydrogen production and refuelling equipment in Quebec. The strategic acquisition will enable CHARBONE to fast-track the commissioning of CHARBONE's flagship Sorel-Tracy facility phase 1 and empower CHARBONE to produce and deliver first industrial high purity hydrogen (UHP) sales in the upcoming quarter.
The equipment, currently in use will be dismantled, repurposed and relocated to Sorel-Tracy .
This transaction follows CHARBONE's signing of a non-dilutive USD 50 million construction capital facility announced on May 1 and June 4, 2025. While this facility is earmarked for broader project financing rather than this equipment purchase, it demonstrates CHARBONE's strengthened capital position and ability to scale up its overall development plan.
Key Investor Highlights
Accelerated Timeline : Repurposing Harnois' proven operating equipment reduces installation costs of new equipment — enabling production by early Q4 2025
Selection Process : CHARBONE has been selected as the buyer of the equipment by accepting $1M in CHARBONE stock as part of a portion of the purchase price at an issue price equal to the market price of CHARBONE's shares on the TSX Venture Exchange on the effective date plus a cash balance payable in 3 tranches payment , with one-third payment on the effective date and the remaining paid over two years — preserving cash for growth.
Operational Progress : Grid connection is completed; Hydro-Québec installed the energy meter on July 22, and completed the interconnection on August 13, while the Town of Sorel-Tracy completed the water connection to its main system, providing the site with the two elements needed for hydrogen production.
Private Placement Details
Additionally, CHARBONE is pleased to announce the sequential closings of its $1M non-brokered private placement (the "Equity Offering"). The Company has already secured $0.5 million to accelerate the completion of its flagship green hydrogen production facility in Sorel-Tracy, Quebec.
The initial tranche involved the issuance of 7,699,666 units. A second tranche for the remaining $0.5M is expected to close by October 15, 2025.
The proceeds from the Equity Offering will be primarily allocated to the Company's purchase of the operating hydrogen equipment from Harnois, re-installation at the Sorel-Tracy site, and infrastructure development, and general working capital requirements.
Each of the units offered (each a Unit "), priced at $0.06 per Unit, included one common share of the Company (each, a " Unit Share ") and one common share purchase warrant (each, a " Warrant "). Each Warrant gives the holder the right to buy one additional common share of the Company at an exercise price of $ 0.08 for 24 months after the closing date of the Offering (the Closing Date "). At the Closing Date, the Company paid a finder's fee of $17,222 and issued 287,040 finder's warrants to registered dealers related to the sale of certain Units to qualified subscribers introduced by such dealers. The Units were offered under the "accredited investor" exemptions of National Instrument 45-106 – Prospectus Exemptions (in Québec, Regulation 45-106 – Prospectus Exemptions ). However, the Company reserves the right to decline subscription amounts below $5,000 (83,333 Units) to avoid excessive administrative costs.
The closing of the Equity Offering remains subject to the approval of the TSX Venture Exchange and other customary closing conditions. The Company may close a second tranche in the coming days, but no later than October 15, 2025. All securities issued under the Offering are subject to a statutory four-month and one-day hold period in Canada following the Closing Date
This news release does not constitute an offer to sell or a solicitation of an offer to buy, nor shall there be any sale of securities in any jurisdiction where such offer, solicitation, or sale would be unlawful, including in the United States. The securities have not been and will not be registered under the United States Securities Act of 1933, as amended (the 1933 Act ") or any applicable state securities laws and may not be offered or sold within the United States or to, or for the account or benefit of, U.S. Persons (as defined in Regulation S under the 1933 Act) unless registered under the 1933 Act and relevant state laws, or if an exemption from registration is available
CEO Comment
"Investors have waited for Sorel-Tracy to move from development to revenue," said Dave Gagnon, President and CEO of CHARBONE. "By repurposing proven equipment — at a lower cost of a new build — and structuring the deal to preserve cash, we're entering execution mode with strong capital backing and minimal dilution. He continues; This acquisition positions us to deliver green and high purity hydrogen (UHP) to our industrial customers quicker, and with best-in-class operating equipment. "
Why This Matters
This acquisition signals a turning point for CHARBONE: after years of development, the company is positioned to deliver its first hydrogen revenues, leverage non-dilutive capital to scale, and capture early-mover advantages in the North American green hydrogen market.
About Charbone Hydrogen CORPORATION
CHARBONE is an integrated company specialized in Ultra High Purity (UHP) hydrogen and the strategic distribution of industrial gases in North America and the Asia-Pacific region. It is developing a modular network of green hydrogen production while partnering with industry players to supply helium and other specialty gases without the need to build costly new plants. This disciplined strategy diversifies revenue streams, reduces risks, and increases flexibility. The CHARBONE group is publicly listed in North America and Europe on the TSX Venture Exchange (TSXV: CH), the OTC Markets (OTCQB: CHHYF), and the Frankfurt Stock Exchange (FSE: K47). For more information, visit www.charbone.com .
Forward-Looking Statements
This news release contains statements that are "forward-looking information" as defined under Canadian securities laws ("forward-looking statements"). These forward-looking statements are often identified by words such as "intends", "anticipates", "expects", "believes", "plans", "likely", or similar words. The forward-looking statements reflect management's expectations, estimates, or projections concerning future results or events, based on the opinions, assumptions and estimates considered reasonable by management at the date the statements are made. Although Charbone believes that the expectations reflected in the forward-looking statements are reasonable, forward-looking statements involve risks and uncertainties, and undue reliance should not be placed on forward-looking statements, as unknown or unpredictable factors could cause actual results to be materially different from those reflected in the forward-looking statements. The forward-looking statements may be affected by risks and uncertainties in the business of Charbone. These risks, uncertainties and assumptions include, but are not limited to, those described under "Risk Factors" in the Corporation's Filing Statement dated March 31, 2022, which is available on SEDAR at www.sedar.com; they could cause actual events or results to differ materially from those projected in any forward-looking statements.
Except as required under applicable securities legislation, Charbone undertakes no obligation to publicly update or revise forward-looking information.
Neither TSX Venture Exchange nor its Regulation Services Provider (as that term is defined in policies of the TSX Venture Exchange) accepts responsibility for the adequacy or accuracy of this release .
Contact Charbone Hydrogen Corporation | |
Telephone: +1 450 678 7171 | |
Email: ir@charbone.com Benoit Veilleux CFO and Corporate Secretary |
Copyright (c) 2025 TheNewswire - All rights reserved.
News Provided by TheNewsWire via QuoteMedia