The Conversation (0)

HIGHLIGHTS
SIGMA Lithium Corporation ("Sigma Lithium" or the "Company") (NASDAQ: SGML,TSXV: SGML), dedicated to powering the next generation of electric vehicles with environmentally sustainable and high-purity lithium, is pleased to announce the filing of its consolidated Phase 1 DFS and Phase 2 PFS Update of the NI 43-101 Technical Report (the "Consolidated Technical Report") for its 100% owned Grota do Cirilo Project (the "Project" or "Grota do Cirilo"). The Consolidated Technical Report incorporates the Phase 1 Feasibility Study and a Phase 2 Pre-Feasibility Study, and demonstrates robust combined economics, highlighted by a combined after-tax NPV8% of US$5.1 billion and combined after-tax IRR of 589%.
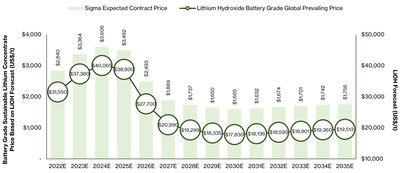
Figure 1: Battery Grade LiOH & SC Price Forecast (US$/t)
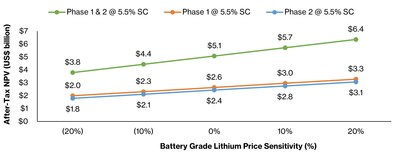
Figure 2: Grota do Cirilo After-Tax NPV8% Sensitivity Analysis to Price Changes (US$ billion)
"With Phase 1 funded and in construction, we are delighted to share our progress on Phase 2 and the combined economics of this fully-integrated lithium project," says Ana Cabral-Gardner, Co-CEO and Co-Chairperson of Sigma Lithium. "We remain focused on delivering Battery Grade Sustainable Lithium for the electric vehicle supply chain, while continuing to focus on lifting the most vulnerable members of our local communities in Vale do Jequitinhonha, Brazil."
The Consolidated Technical Report considers a fully integrated and environmentally sustainable production of battery grade high purity lithium concentrate ("Battery Grade Sustainable Lithium"), with feedstock spodumene ore sourced from its Phase 1 and Phase 2 lithium deposits. The combined operation increases average run-rate production to 531,000 tpa of Battery Grade Sustainable Lithium. Additionally, Grota do Cirilo's operating life has been extended by more than 50% to 13 years with the addition of Phase 2 production from the initial eight years in the Phase 1 Feasibility Study.
The Consolidated Technical Report estimates US$76 million of additional capital expenditures to build a "second production line" to produce Battery Grade Sustainable Lithium in a Phase 2.
The key factors influencing the robust Consolidated Technical Report economics include:
The Company expects to announce an updated mineral resource estimate in the second quarter of 2022, with the goal of determining the potential for a further production expansion ("Phase 3"). A Preliminary Economic Assessment on Phase 3 is expected to be completed at the end of the second quarter or early in the third quarter of 2022.
The Company has filed the Consolidated Technical Report and it is available on SEDAR (www.sedar.com), EDGAR (www.sec.gov) and the Company's corporate website. The Consolidated Technical Report is NI 43-101 compliant and was issued on May 25, 2022. The Consolidated Technical Report was prepared for Sigma Lithium by: Homero Delboni Jr., MAusIMM, Promon Engenharia; Marc-Antoine Laporte, P. Geo, SGS Canada Inc; Jarret Quinn, P. Eng., Primero Group Americas; Porfirio Cabaleiro Rodriguez, (MEng), FAIG, GE21 Consultoria Mineral; and Brian Talbot, FAusIMM, Rtek Pty Ltd.
Integrated Economic AnalysisThe Grota do Cirilo Phase 1 and Phase 2 after-tax NPV8% and after-tax IRR of US$5.1 billion and 589% were calculated based on an average annual production run-rate of 531,000 tonnes of Battery Grade Sustainable Lithium and a 13-year operating life. A financial summary for the Project is included in Table 1 below, which demonstrates the robust economics for the production of Battery Grade Sustainable Lithium for the following concentrations of lithium oxide: 6.0%, 5.5% and 5.2%.
Table 1: Phase 1 & 2 Financial Summary
Base Case Phase 1 & 2 | 6.0% Li2O | 5.5% Li2O | 5.2% Li2O |
Economic Analysis | |||
After-Tax Net Present Value (@ 8% Discount Rate) | US$4.0 Billion | US$5.1 Billion | US$5.4 Billion |
After-Tax Internal Rate of Return | 495% | 589% | 624% |
Revenues, Cash Flow and Capex | |||
Operating Life | 13 years | 13 years | 13 years |
Battery Grade Lithium Run-Rate Production | 440,400 tpa | 531,000 tpa | 561,700 tpa |
Lithium Carbonate Equivalent Run-Rate Production | 65,300 tpa LCE | 72,200 tpa LCE | 72,200 tpa LCE |
Average Annual Revenue | US$756 M | US$915 M | US$968 M |
Average Annual After-Tax Free Cash Flow | US$472 M | US$595 M | US$637 M |
Costs per tonne of Lithium | |||
Total Cash Cost at Production | US$399/t | US$340/t | US$325/t |
All-in Sustaining Cost (CIF China) | US$515/t | US$455/t | US$440/t |
Phase 1 Lithium Recovery Rate (DMS) | 60.4% | 65.0% | 65.0% |
Phase 2 Lithium Recovery Rate (DMS) | 50.9% | 57.9% | 57.9% |
Integrated Costs (per tonne of lithium) | |||
Mining costs | US$236/t | US$194/t | US$184/t |
Greentech Plant Processing costs | US$69/t | US$57/t | US$54/t |
G&A costs | US$30/t | US$25/t | US$24/t |
Transportation costs (Mine to CIF China) | US$114 | US$114 | US$114 |
Spodumene Mined Feedstock for Greentech Plant | |||
Total quantity mined | 33.6 Mt | 33.6 Mt | 33.6 Mt |
Annual run of mine (ROM) | 2.6 Mtpa | 2.6 Mtpa | 2.6 Mtpa |
Table 2 below highlights the robust Phase 1 only standalone economics for the production of Battery Grade Sustainable Lithium for the following concentrations of lithium oxide: at 6.0%, 5.5% and 5.2%.
Table 2: Phase 1 Only Financial Summary
Base Case Phase 1 Only | 6.0% Li2O | 5.5% Li2O | 5.2% Li2O |
Economic Analysis | |||
After-Tax Net Present Value (@ 8% Discount Rate) | US$2.2 Billion | US$2.6 Billion | US$2.8 Billion |
After-Tax Internal Rate of Return | 482% | 571% | 606% |
After-Tax Payback Period | 3 months | 3 months | 2 months |
Revenues, Cash Flow and Capex | |||
Operating Life | 8 years | 8 years | 8 years |
Battery Grade Lithium Run-Rate Production | 230,000 tpa | 270,000 tpa | 285,600 tpa |
Lithium Carbonate Equivalent Run-Rate Production | 34,100 tpa LCE | 36,700 tpa LCE | 36,700 tpa LCE |
Average Annual Revenue | US$575 M | US$675 M | US$714 M |
Average Annual After-Tax Free Cash Flow | US$376 M | US$455 M | US$485 M |
Costs per tonne of Lithium | |||
Total Cash Cost at Production | US$386/t | US$339/t | US$324/t |
All-in Sustaining Cost (CIF China) | US$506/t | US$459/t | US$444/t |
Lithium Recovery Rate (DMS) | 60.4% | 65.0% | 65.0% |
Integrated Costs (per tonne of lithium) | |||
Mining costs | US$229/t | US$195/t | US$185/t |
Greentech Plant Processing costs | US$65/t | US$56/t | US$53/t |
G&A costs | US$21/t | US$18/t | US$17/t |
Transportation costs (Mine to CIF China) | US$119/t | US$119/t | US$119/t |
Spodumene Mined Feedstock for Greentech Plant | |||
Total quantity mined | 11.8 Mt | 11.8 Mt | 11.8 Mt |
Annual run of mine (ROM) | 1.5 Mtpa | 1.5 Mtpa | 1.5 Mtpa |
Spodumene ore feed grade LOM average | 1.55% | 1.55% | 1.55% |
Table 3 below highlights the robust Phase 2 only standalone economics for the production of Battery Grade Sustainable Lithium for the following concentrations of lithium oxide: at 6.0%, 5.5% and 5.2%.
Table 3: Phase 2 Only Financial Summary
Base Case Phase 2 Only | 6.0% SC | 5.5% SC | 5.2% SC |
Economic Analysis | |||
After-Tax Net Present Value (@ 8% Discount Rate) | US$1.9 B | US$2.4 B | US$2.6 B |
After-Tax Internal Rate of Return | 601% | 764% | 813% |
After-Tax Payback Period | 2 months | 2 months | 2 months |
Revenues, Cash Flow and Capex | |||
Operating Life | 12 years | 12 years | 12 years |
Battery Grade Lithium Run-Rate Production | 210,400 tpa | 261,100 tpa | 276,100 tpa |
Lithium Carbonate Equivalent Run-Rate Production | 31,200 tpa LCE | 35,500 tpa LCE | 35,500 tpa LCE |
Average Annual Revenue | US$436 M | US$541 M | US$573 M |
Average Annual After-Tax Free Cash Flow | US$260 M | US$342 M | US$366 M |
Costs per tonne of Lithium | |||
Total Cash Cost at Production | US$408/t | US$340/t | US$325/t |
All-in Sustaining Cost (CIF China) | US$521/t | US$453/t | US$437/t |
Lithium Recovery Rate (DMS) | 50.9% | 57.9% | 57.9% |
Integrated Costs (per tonne of lithium) | |||
Mining costs | US$240/t | US$194/t | US$183/t |
Greentech Plant Processing costs | US$72/t | US$58/t | US$55/t |
G&A costs | US$37/t | US$30/t | US$28/t |
Transportation costs (Mine to CIF China) | US$110/t | US$110/t | US$110/t |
Spodumene Mined Feedstock for Greentech Plant | |||
Total quantity mined | 21.8 Mt | 21.8 Mt | 21.8 Mt |
Annual run of mine (ROM) | 1.8 Mtpa | 1.8 Mtpa | 1.8 Mtpa |
Spodumene ore feed grade LOM average | 1.37% | 1.37% | 1.37% |
Grota do Cirilo's average revenue and operating costs per tonne of Battery Grade Sustainable Lithium are outlined in Table 4 below. The lithium prices forecasted are based on the Benchmark Mineral Intelligence curve of battery grade lithium hydroxide (LiOH) shown in Figure 1, with the price of the Battery Grade Sustainable lithium calculated based on a fixed percentage of 9% of the LiOH price. This is based on an average Battery Grade Sustainable Lithium price of US$3,159/t for 2022 to 2026, with a long-term Battery Grade Sustainable Lithium price of US$1,710/t from 2027 to 2035.
Table 4: Grota do Cirilo Integrated Estimated Revenue and Operating Costs
Estimated Revenue, Operating Cost and After-Tax Earnings | Annual Average Economics (1) (13 Year Operating Life) | |
(US$ MM) | (US$/t) | |
Gross Revenue | $915 | $2,247 |
Less: Realization costs | ($26) | ($63) |
(-) CFEM Royalty | ($18) | ($45) |
(-) Other Royalties | ($7) | ($18) |
(-) Commercial Discount | - | - |
Net Revenues | $889 | $2,184 |
Less: Site Operating Costs | ($159) | ($390) |
(-) Mining | ($79) | ($194) |
(-) Processing | ($23) | ($57) |
(-) Transport | ($46) | ($114) |
(-) Selling, General & Administration | ($10) | ($25) |
(-) Depreciation | ($27) | ($67) |
EBIT | $703 | $1,727 |
% EBIT Margin | 79% | 79% |
(-) Taxes | ($107) | ($263) |
After-Tax Earnings | $596 | $1,463 |
% After-Tax Earnings Margin | 67% | 67% |
(1) Based on the production of Battery Grade Sustainable Lithium at 5.5%
Given the relatively low capital intensity of the Project, the after-tax NPV8% shows low sensitivity to changes in capex, BRL/USD exchange rate and operating expenses. Grota do Cirilo's after-tax NPV8% is more sensitive to variations in Battery Grade Sustainable Lithium prices, as reflected in Figure 2 below.
Capital ExpendituresIn addition to the remaining US$111 million pre-production Phase 1 capex (which is already fully funded), the Consolidated Technical Report estimates US$76 million of additional capex to build a "second production line" to produce Battery Grade Sustainable Lithium process in a Phase 2. This Phase 2 expansion is expected to be constructed during the first year of production for Phase 1 at the Project, with Phase 2 production expected to commence in the second year of production.
The Phase 1 capex was estimated at a FEL3 level of engineering detail, whereby the engineering firms provided pricing quotations from qualified suppliers for all areas of construction (summarized in Table 5 below).
The pre-production Phase 2 capex to construct the "second production line" (including all direct and indirect costs and contingencies in each line item) is summarized in Table 5 below and was estimated with an accuracy of ±25%.
Table 5: Capex to Commercial Production
Item | Phase 1 (Year 1) (1) | Phase 2 (Year 2) (2) |
(US$ M) | (US$ M) | |
Mine | $8.5 | $2.3 |
Process Plant | $69.8 | $53.9 |
Environmental Equipment (Water & Dry Stacking) | $16.6 | $7.3 |
Engineering Services | $19.2 | $11.6 |
Substation & Utility Power Supply | $7.4 | - |
Operational and ESG Expenses During Construction | $9.8 | $3.2 |
Working Capital During Plant Commissioning | $6.1 | $1.0 |
Tax Incentives (Savings) | ($5.9) | ($3.5) |
Capex already Disbursed During Construction | ($20.7) | - |
Total Capex to Commercial Production | $110.9 | $75.7 |
(1) The operating life capital is estimated at US$3.2 M (including contingency) for replacement of key plant components over the Phase 1 operating life, considering the modelled operating life and useful life of major equipment items. The sustaining capex is mainly for the crushing area and allows for crusher rebuilds (replacements).
(2) The operating life capital is estimated at US$166.9 M and includes capitalized stripping of US$56.7 M in year 6, US$52.9 M in year 7 and US$50.8 M in year 8.
All-In Sustaining Cost
The operating cost estimate is based on an owner-operated model with contract mining. Table 6 below shows the anticipated average operating costs over the operating life.
Mining costs were estimated based on a quoted proposal from a large Brazilian mining contractor, selected after an extensive tender process by the Company and its mining consultant, GE21.
Grota do Cirilo Battery Grade Sustainable Lithium is forecasted to have very low All-in Sustaining Costs (CIF China) of US$455/t, mainly as a result of the following:
Grota do Cirilo's mining costs have decreased from the standalone Phase 1 operation partially as a result of a lower Phase 2 strip ratio (waste mined per ore mined) of 12.5 versus the Phase 1 strip ratio of 16.6.
Table 6: Grota do Cirilo Operating Cost Estimate
Operating Cost Category | US$/t SC |
Mining | $194 |
Processing | $57 |
G&A | $25 |
Royalties | $63 |
Total Cash Cost (FOB) | $340 |
Transport & Ocean Freight Costs | $114 |
Total Cash Cost (CIF China) | $454 |
Sustaining | $2 |
All-In Sustaining Cost (CIF China) | $455 |
The mining and mineral reserve estimates in this news release has been reviewed and approved by Porfirio Cabaleiro Rodriguez P.Eng, Mining Engineer of GE21 Consultoria Mineral Brazil. Mr. Rodriguez is a Qualified Person as defined by National Instrument 43-101 and is independent of Sigma Lithium.
The technical and scientific information related to geology and mineral resource estimate in this news release has been reviewed and approved by Marc-Antoine Laporte P.Geo., M.Sc., of SGS Geological Services. Mr. Laporte is a Qualified Person as defined by National Instrument 43-101 and is independent of Sigma Lithium.
The financial information in this news release has been reviewed and approved by Brian Talbot BSc Engineering (Chemical), FAusIMM. Mr. Talbot is a Qualified Person as defined by National Instrument 43-101 and is independent of Sigma Lithium.
The technical and scientific information related to DMS recoveries in this news release has been reviewed and approved by Jarrett Quinn, P.Eng., Primero Group Americas Inc. Mr. Quinn is a Qualified Person as defined by National Instrument 43-101 and is independent of Sigma Lithium.
ABOUT SIGMA LITHIUM CORPORATIONSigma Lithium (NASDAQ: SGML,TSXV: SGML) is a Canadian company dedicated to powering the next generation of electric vehicle batteries with environmentally sustainable and high-purity lithium.
Sigma Lithium is currently in construction at its wholly owned Grota do Cirilo Project in Brazil, which includes a state-of-the-art, green-tech processing plant that uses 100% renewable energy, 100% recycled water and 100% dry-stack tailings. The project also represents one of the largest and highest-grade hard rock lithium spodumene deposits in the Americas. Since inception, Sigma has devoted itself to strong ESG practices, from its ongoing support of local communities to its goal of achieving net zero by 2024. For more information about Sigma Lithium, visit https://www.sigmalithiumresources.com/
Sigma Lithium
Linkedin Sigma Lithium
Instagram @sigmalithium
Twitter @SigmaLithium
FORWARD-LOOKING STATEMENTS
This news release includes certain "forward-looking information" under applicable Canadian and U.S. securities legislation, including but not limited to statements relating to timing and costs related to the delivery of additional incremental production at varying grades, NPV, IRR and payback estimates, increase in after tax cash flow, expected strip ratios, potential to be among the lowest cost producers in the industry, production, operating and capital cost estimates (including sustaining costs and improvements in respect thereof), all estimates and assumptions relating to the economic analysis and financial summary including but not limited to revenue and production estimates, operating life, plant recoveries and feedstock estimates, lithium prices, mineral resource and mineral reserve estimates (including assumptions and estimates used in preparing the mineral reserve and mineral resource estimates), Phase 3 projections, economic development in the jurisdictions in which Sigma Lithium operates, the general business and operational outlook of the Company, and other forward-looking information. All statements that address future plans, activities, events, estimates, expectations or developments that the Company believes, expects or anticipates will or may occur is forward-looking information, including statements regarding the potential development of mineral resources and mineral reserves which may or may not occur. Forward-looking information contained herein is based on certain assumptions regarding, among other things: general economic and political conditions; the stable and supportive legislative, regulatory and community environment in the jurisdictions where the Company operates; anticipated trends and effects in respect of the COVID-19 pandemic and post-pandemic; the military conflict in Ukraine and related sanctions; demand for lithium, including that such demand is supported by growth in the electric vehicle market; the Company's market position and future financial and operating performance; the Company's estimates of mineral resources and mineral reserves, including whether mineral resources will ever be developed into mineral reserves; and the Company's ability to develop and achieve production at its mineral projects.
Although management believes that the assumptions and expectations reflected in the forward-looking information are reasonable, there can be no assurance that these assumptions and expectations will prove to be correct. Forward-looking information inherently involves and is subject to risks and uncertainties, including but not limited to that the Company may not develop its mineral projects into a commercial mining operation; the market prices for lithium may not remain at current levels; and the market for electric vehicles and other large format batteries currently has limited market share and no assurances can be given for the rate at which this market will develop, if at all, which could affect the success of the Company and its ability to develop lithium operations. There can be no assurance that such statements will prove to be accurate, as actual results and future events could differ materially from those anticipated in such statements. Accordingly, readers should not place undue reliance on forward-looking information. The Company disclaims any intention or obligation to update or revise any forward-looking information, whether because of new information, future events or otherwise, except as required by law. For more information on the risks, uncertainties and assumptions that could cause our actual results to differ from current expectations, please refer to the current annual information form of the Company and other public filings available under the Company's profile at www.sedar.com.
Neither the TSX Venture Exchange nor its Regulation Services Provider (as that term is defined in the policies of the TSX Venture Exchange) accepts responsibility for the adequacy or accuracy of this news release.