The Conversation (0)

Pasofino Gold Limited (TSXV: VEIN) (OTCQB: EFRGF) (FSE: N07) ("Pasofino" or the "Company") is pleased to announce the results of the Dugbe Project Feasibility Study (FS), which is located in Southern Liberia. The FS was prepared by the Company's lead engineers, DRA Global (South Africa), in accordance with Canadian Securities Administrators' National Instrument 43-101 Standards of Disclosure for Mineral Projects ("NI 43-101").
As per NI 43-101 the Feasibility Study will be filed by Pasofino at www.sedar.com within 45 days of this news release. Subject to the filing by Pasofino of the Feasibility Study under Pasofino's profile at www.sedar.com and final administrative documentation, Hummingbird Resources Plc ("Hummingbird") has confirmed that the FS has been carried out to the agreed standards and will satisfy the technical requirements to allow Pasofino to earn its 49% economic interest in the Project (prior to the issuance of the Government of Liberia's 10% carried interest).
HIGHLIGHTS
PASOFINO EARN-IN UPDATE
Subject to the filing by Pasofino of the FS under Pasofino's profile at www.sedar.com, and final administrative documentation, Hummingbird has confirmed that the FS has been carried out to the agreed standards and will satisfy the technical requirements to allow Pasofino to earn its 49% economic interest in the Project (prior to the issuance of the Government of Liberia's 10% carried interest). Further, both Pasofino and Hummingbird will have the right to exercise the option to consolidate ownership by converting Hummingbird's 51% ownership of the Project for a 51% shareholding in Pasofino, such that Pasofino would own 100% of the Project (prior to the government of Liberia's 10% carried interest), subject to the receipt of all required approvals including the TSX Venture Exchange.
ENVIRONMENT, SOCIAL AND GOVERNANCE
Environmental and social impact assessment (ESIA) process nearing completion with submission to the EPA expected in June 2022.
Build, own, operate and transfer (BOOT) liquified natural gas (LNG) thermal power and owner's photovoltaic (PV)/battery energy storage solution power supply mix. Substantial reduction in predicted greenhouse gas emissions, including approximately 25% fewer tonnes carbon dioxide equivalent (tCO2e) compared to using only a conventional HFO thermal power plant.
Multiple rounds of ESIA stakeholder engagement, along with ongoing relationship building by the Hummingbird Liberia (HBL) team, leading to general acceptance of the project whilst recognising high community expectations.
INFRUSTRUCTURE-READY PROJECT
PASOFINO CEO IAN STALKER COMMENTS
"I am extremely pleased with the outcome of the FS, particularly given the current environment of higher raw material, capital and energy costs as a result of inflation and other global dislocations. We are truly in the 'eye of the storm' on Capex estimations and hence it is reasonable to expect going forward to the FEED Phase that as world-wide business conditions settle down significant savings can be made against this Capital Estimate that will naturally enhance overall Project economics. The Dugbe Gold Project is now a significant, viable and economically robust gold project, with substantial exploration upside potential to improve upon the already large 4Moz Resources base.
LOM. metallurgical recovery for the Study has been set at 83%, leaving significant upside that can be brought to account as gold price rises and Capex cost associated with further process recovery steps reduces. It is worth noting a 2% increase in overall recovery enhances the Project NPV by up to USD52M.
Most importantly, Pasofino is in a position to pursue strategic alternatives to maximise shareholder value now that a key milestone of a detailed and economically robust FS is available."
HUMMINGBIRD RESOURCES PLC CEO DAN BETTS COMMENTS
"We are delighted to receive the results from the robust FS that has been led by Pasofino. The FS has been conducted to a high standard and has seen a complete remodelling of the Resource base, to now showcase a significant 2.76Moz Reserve base, long LOM of 14 years with upside given the material exploration potential available and a low AISC profile of USD1,005/oz to underpin a gold mine of material value. We look forward to now working with Pasofino to conduct a strategic review of our options to best realise the maximum value of Dugbe for all stakeholders."
The FS was prepared in accordance with Canadian Securities Administrators' National Instrument 43-101 Standards of Disclosure for Mineral Projects ("NI 43-101").
The reader is advised that the FS summarised in this news release is intended to provide only a high-level review of the project potential and design options. The FS mine plan and economic model include numerous assumptions and the use of Measured and Indicated mineral resources only.
PROJECT DESCRIPTION AND LOCATION
The Project is located in south-eastern Liberia, approximately 76km east of Greenville and 240km south-east of the capital Monrovia-Figure 1. The combined Project covers an area of 2,559km2 and is defined within a single Mineral Development Agreement (MDA), effective in April 2019, valid for 25 years. The centre of the Project has an approximate latitude of 5.093º and longitude of -8.502º. The Tuzon and Dugbe F deposits are approximately 4km apart.
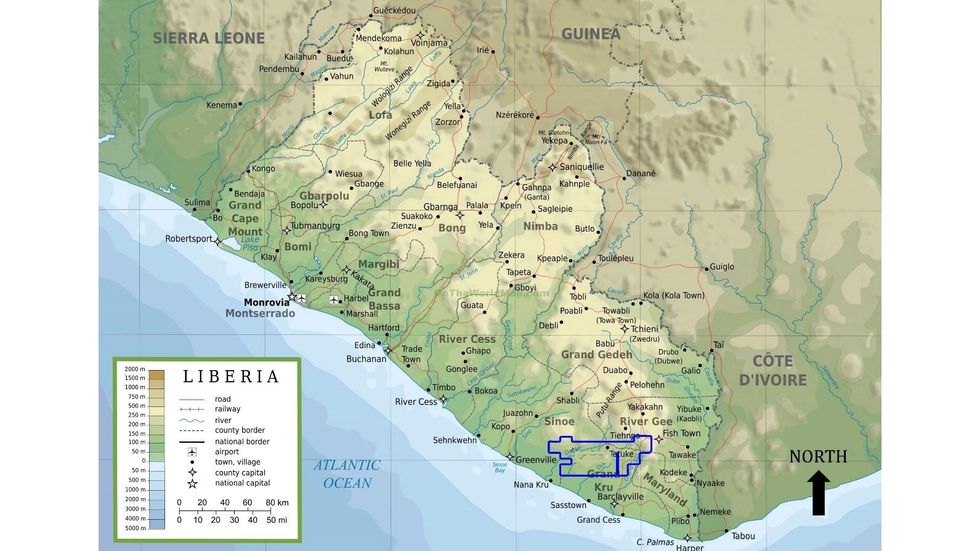
Figure 1. Project location in Liberia
The Project is located in an undeveloped area of Liberia, with one main access road, recently upgraded by the mine, and several villages. Most people in the area engage in artisanal and small-scale mining (ASM), hunting and/or small-scale farming. No utilities such as power and water are available.
The area is primarily rainforest over low rolling hills. The region is drained by three major rivers, the Dugbe River in the south-east, the Geebo River that runs between the two deposits, and the Nyenmon River in the west. Sapo National Park is approximately 15km north of the Project area with the Grand Kru - River Gee proposed Protected Area approximately 10-20km to the south-east.
A wide range of plant and animal species that are endemic and/or of conservation importance are present in the forests. The climate is typically tropical, with high humidity, daytime temperatures and rainfall. The nearest town of consequence is Greenville, the Sinoe County capital, which has a basic port and a palm oil processing centre, but no grid-scale utilities.
GEOLOGY AND MINERALISATION
The Project is located just south of the inferred boundary between the Archean Liberian Age Province (3000-2500 Ma) which covers the northern two-thirds of Liberia and the Paleo Proterozoic Birimian aged rocks (2166 ±66 Ma) to the south-east-Figure 2. The regional scale ENE-WSW oriented Dugbe Shear Zone bisects the Project area passing just south of the deposits. The dominant lithologies in the project area are granulite facies gneisses, migmatites and younger crosscutting granitoids and pegmatites.
Mineralogical investigations suggest that the Tuzon and Dugbe F deposits in their current form resulted from the deformation and metamorphism of a single pre-existing gold deposit. Gold pre-dates peak metamorphic conditions and therefore differs from most typical Birimian deposits where mineralisation is largely associated with late transcurrent shearing. The deposits may more appropriately be compared to granulite facies gold deposits, which are found in cratonic regions in Canada, Australia and China.
Tropical weathering has produced a lateritic profile of 1m to approximately 15m thick. The contact between weathered material and fresh rock is abrupt, the transitional layer being poorly developed generally less than 1m thick.
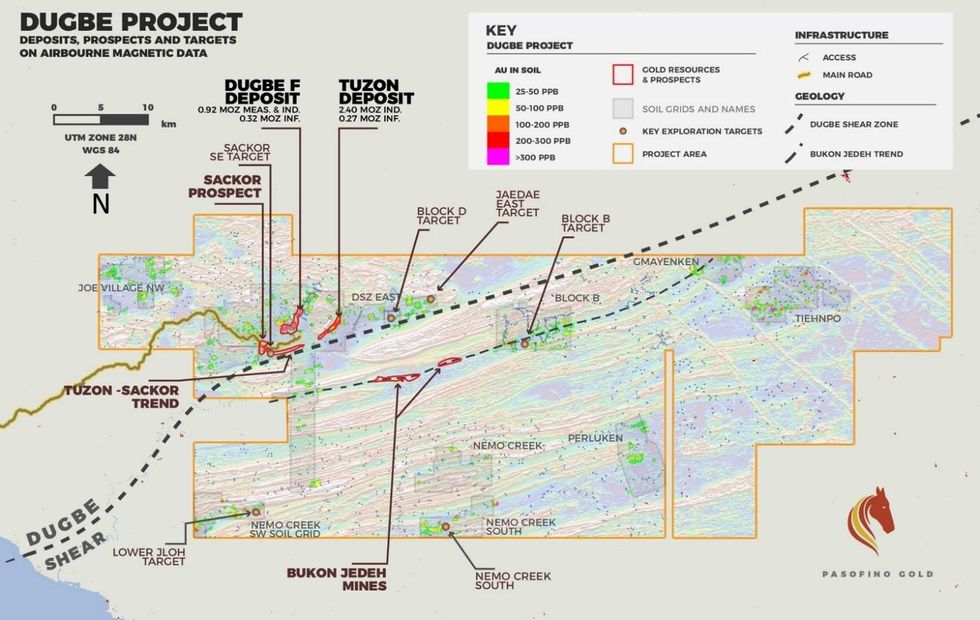
Figure 2. The Dugbe Project and location of the Tuzon and Dugbe F deposits
Tuzon Deposit
The Tuzon deposit has a length of 1,800m and is up to 375m wide with a general strike of 030°. The deposit outcrops at surface over most its strike length and the deepest part of the current Mineral Resource Estimate (MRE) is approximately 390m below surface.
The deposit is hosted by a gently south-west plunging refolded synform as shown in cross-section in Figure 3. Minor zones or selvages of mineralised gneiss are found within the core of the fold in some areas. The rock types and their sequence from footwall upwards are as follows.
The gold mineralized layer at Tuzon is variable in thickness from less than 10m to approximately 100m at the hinge of the main synform. It is comprised of an inner zone with higher grade (>= 0.8-1.0g/t Au) and an outer zone which grades between 0.4 and 0.8g/t Au, as is illustrated in Figure 3. Pegmatites are abundant and maybe concordant with the dominant foliation or cross-cutting.
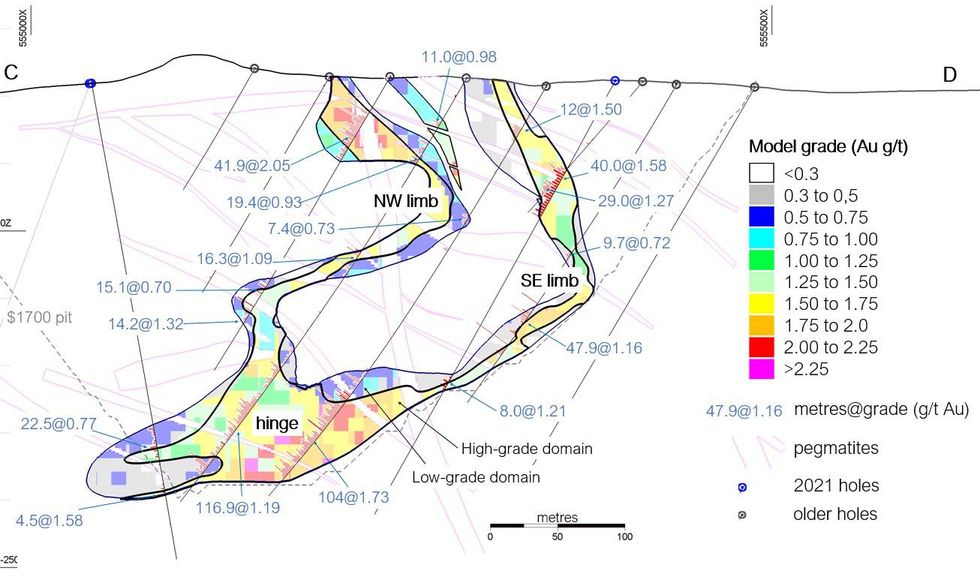
Figure 3. Cross-section through Tuzon looking north-east showing the block model and drillhole intersections. Cross-cutting pegmatites are shown
Dugbe F Deposit
The Dugbe F deposit has a surface footprint of approximately 3,400 x 1,500m. The deposit is hosted by a single layer with overall gentle (5-20°) SE dip. The sequence of rocks is the same as Tuzon. The mineralized layer has a thickness ranging from less than 1m up to 20m, with an average of 10-12m. It is undulating and affected by relatively localised isoclinal or near-isoclinal recumbent folds which cause thickening and repetition of the mineralisation.
Gold Mineralisation
The gold mineralisation at both deposits is spatially associated with elevated levels of sulphide, principally pyrrhotite and arsenopyrite. Chalcopyrite may be observed. The sulphides are finely disseminated, but also occur as coarser angular blebs, thin folded monomineralic laminae and stringers typically parallel with the dominant S1/S2 foliation. Grade is generally higher at the centre of the mineralised layer. Gold mineralisation is thought to be controlled by the S1 or S2 foliation which was later affected by the D3 event.
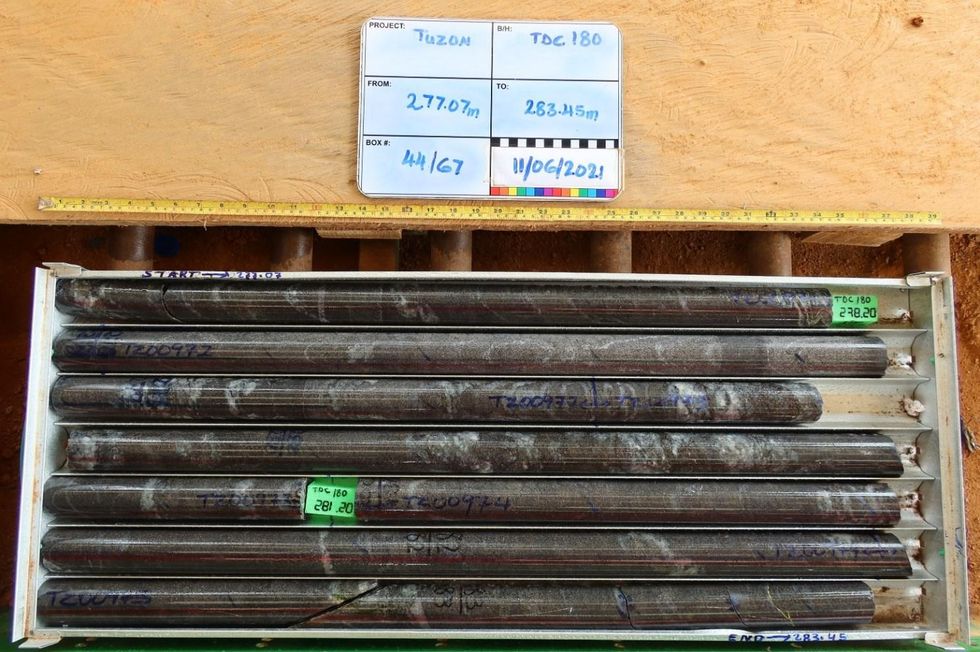
Figure 4. Typical orthopyroxene sulphide gneiss (OSG) host rock. All metre lengths in this tray contain between 2 and 3g/t Au
The gold mineralogy consists of four main types: electrum (Au, Ag), gold amalgam (Au, Ag, Hg), native gold and maldonite (Au2Bi). Most of the gold is fine (<10μm with most <5μm) and is at external and internal grain boundaries or lying along alteration patches within the grains.
EXPLORATION DATA
A large amount of surface exploration was carried out by Hummingbird across the Project between 2006 and 2014 which led to the discovery of the Dugbe F and Tuzon deposits. From 2009 until 2014 exploration resource drilling was carried out at Dugbe F. After the discovery of Tuzon, exploration resource drilling was carried out there between April 2011 and January 2014. Table 1 and Table 2 summarises the drillholes used for the Dugbe F and Tuzon MRE, all of which were diamond core drillholes (DD).
Table 1. Summary of drilling completed at Tuzon
| Drilling Phase | Dates | Holes | Type | NO. holes | Metres |
| 1 | Aug 2011 - April 2012 | TDC001 - TDC072 | DD | 71 | 15,480 |
| 2 | July 2012 | TDC073- TDC077 | DD | 5 | 1,253 |
| 3 | Jan 2013 - July 2013 | TDC078 - TDC140 | DD | 59 | 15,186 |
| 4 | Aug 2013 - Jan 2014 | TDC141 - TDC157 | DD | 17 | 2,253 |
| 5 | April 2020 - May 2020 | TDC174 - TDC191 | DD | 23 | 6,675 |
| Total | 175 | 40,847 |
Notes:
1. TDC158 to TDC173 are at the tailings area, not within MRE area.
2. Phase 5 excludes the metres belonging to the upper part of five previous holes which were deepened.
Table 2. Summary of drilling completed at Dugbe F
| Drilling Phase | Dates | Holes | Type | NO. Holes | Metres |
| 1 | Feb 2009 - May 2009 | DFDC001 - DFDC007 | DD | 7 | 520 |
| 2 | Feb 2010 - Oct 2010 | DFDC008 - DFDC093 | DD | 85 | 13,462 |
| 3 | Feb 2011 - Sep 2011 | DFDC094 - DFDC264 | DD | 168 | 18,343 |
| 4 | Jun 2012 - Jul 2012 | DFDC265 - DFDC280 | DD | 16 | 1,135 |
| 5 | Feb 2014 - Mar2014 | DFDC281 - DFDC333 | DD | 53 | 1,200 |
| 6 | Jan 2021 - May 2021 | DFDC334 - DFDC415 | DD | 84 | 6,938 |
| Total | 413 | 41,598 |
Notes:
1. Phase 5 metres excludes the metres belonging to the upper part of two previous holes which were deepened.
Core sampling was undertaken using a nominal 1 to 2m sampling interval. Between 2009 and 2014 samples were either prepared at ALS Monrovia and assayed at ALS Ireland or prepared and assayed at SGS Monrovia. For the drilling 2020 onwards, samples were initially shipped to ALS in Yamoussoukro in Ivory Coast then analysed at ALS Ouagadougou in Burkina Faso or ALS in Kumasi in Ghana. Later, a preparation laboratory in Monrovia, Liberia Geochemical Services (LGS), was used, from which the pulp samples were sent to ALS in Kumasi.
Quality Assurance and Quality Control (QA-QC) measures included the use of certified reference materials (CRMs), blanks, pulp and field duplicates, and umpire laboratory duplicates. One of each of these sample types was inserted into every 20 samples. Site visits have been made by SRK's Independent Qualified Persons. Martin Pittuck observed the drilling and sampling procedures used from 6 to 11 June 2013. SRK's Colin Rawbone visited the Project from 9 to 12 March 2021, to observe the drilling, logging and sampling procedures and to inspect the sample preparation laboratory in Monrovia.
MINERAL RESOURCE ESTIMATE FOR TUZON
SRK constructed wireframe geological models comprising a base of oxide surface, the unmineralised pegmatite bodies and the mineralisation domains. A low-grade (LG) mineralisation wireframe was made based on changes in elevated gold grade (typically coincident at >= 0.3 to 0.4g/t). SRK also modelled an internal high-grade (HG) domain within the LG mineralisation wireframe based on a threshold of >= 0.8 to 1.0g/t. This is illustrated in Figure 5 below. In addition to the main LG and the HG domain within it, models were created for four minor low-grade domains referred to as D, F, G and H.
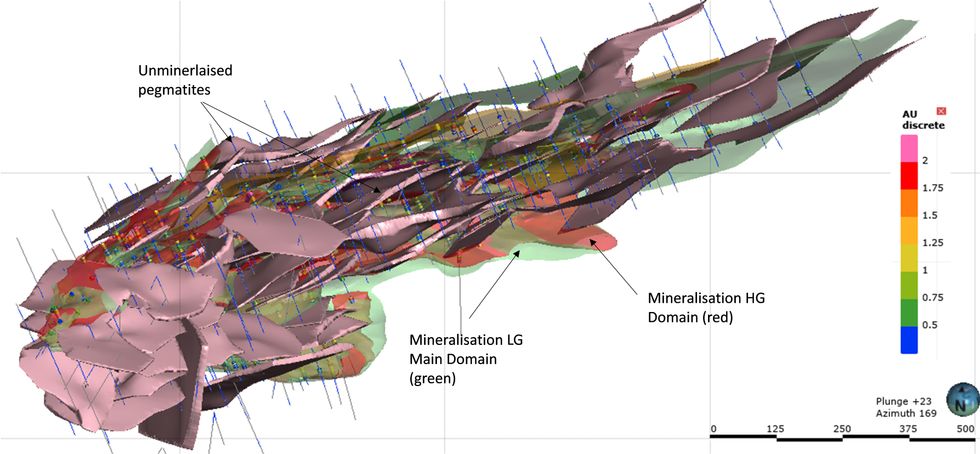
Figure 5. 3D view of the Tuzon geological wireframes, looking south-east (along the F3 axes)
SRK created 2.0m composites of the drilling data and applied a 15g/t Au cap to the high-grade domain only. Snowdon Supervisor Software was used for geostatistical analysis. Experimental semi-variograms were reviewed for the mineralised domains in the along-strike, down-dip and across-strike orientations. Omni-directional structures were selected for fitting of the final variogram models for the HG and combined LG domain.
Based on 578 density samples for Tuzon, the following bulk densities were determined for use for the MRE: Mineralised gneiss: variable density, whereby the average of 2.78g/cm3 is factored (reduced) according to increasing pegmatite content. Pegmatite: Average density value of 2.62g/cm3. All oxide material: Average density value of 2.20g/cm3.
A block model was created based on UTM coordinates with dimensions of 10 x 10 x 10m (x, y and z). Sub-blocking was allowed along the boundaries. Ordinary Kriging (OK) was used for the grade interpolation of gold and search ellipses were orientated to follow the trend of the mineralisation domain using Leapfrog Geo (Leapfrog) software's Variable Orientation tool. Validation was by use of swath plots, visual inspection and comparative statistics. SRK classified the Tuzon Mineral Resource as:
Indicated where there is reasonable level of geological confidence in well-drilled areas of the model with 80m coverage or better.
Inferred in areas of lower geological confidence, where blocks are typically within 100m of sample data.
MINERAL RESOURCE ESTIMATE FOR DUGBE F
The procedures were mostly the same as those used for Tuzon. Only a single mineralised domain was created using an approximate 0.4g/t Au threshold. Being a relatively thin layer, lower grades were incorporated where required to ensure geological continuity of the layer. A single 5-10m thick late-stage dolerite dyke is present at Dugbe F passing the deposit from south-east to north-west.
Based on log histograms and visual-spatial review of the composite data, no high-grade capping was applied to composite samples. The block model was created with parent block size of 20 x 20 x 2 (x, y and z). Sub-blocking was allowed along the boundaries of the model. As at Tuzon, OK was used for the grade interpolation and Leapfrog's Variable Orientation tool. Figure 6 illustrates the block model for part of the deposit with a recumbent fold.
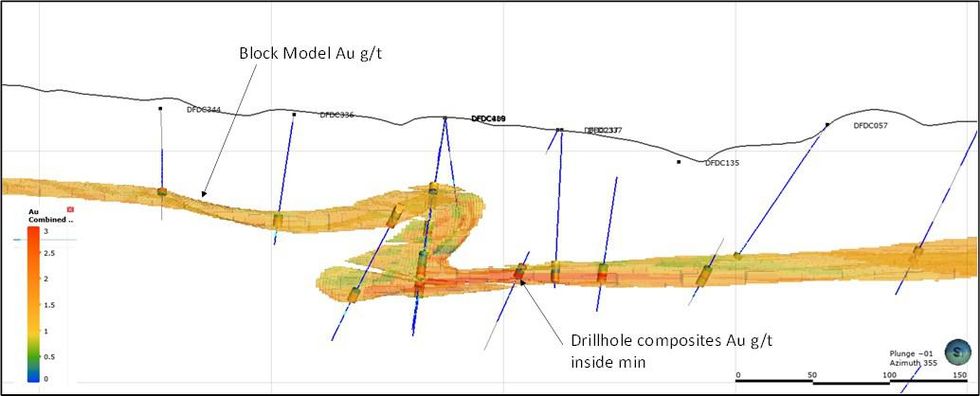
Figure 6. Cross-section through one of the folds at Dugbe F showing the block model
Within zones of tight re-folding separate fold limbs were assigned variable search ellipse orientations separately (where necessary), to ensure appropriate representation of search ellipses at fold hinges.
A total of some 2,491 density measurements were used to define host and waste densities as follows: Mineralised gneiss variable density, whereby the average of 2.78g/cm3 is factored (reduced) according to increasing pegmatite content. Pegmatite: Average density value of 2.64g/cm3. Dolerite dyke: Average density value of 2.91g/cm3. All oxide material: Average density value of 2.25g/cm3.
Mineral Resources were classified as follows and included a small area of Measured category in an area of close-spaced drilling. Measured: The block grades are based on multiple drillhole intercepts, and there is typically 25-50m drillhole coverage and good continuity shown by both assay grades and geological wireframes. Indicated Mineral Resources were where SRK has a reasonable level of geological confidence in well-drilled areas of the model (with 80m coverage or better) and typically up to 40m beyond these areas. Inferred was applied to areas with lower geological confidence, where blocks are typically within 100m of sample data.
MINERAL RESOURCE STATEMENT
Reasonable Prospects for Eventual Economic Extraction
For both deposits, reasonable prospects for eventual economic extraction were established based on open pit mining satisfied by means of a conceptual pit shell. All blocks outside the pits were excluded from the Mineral Resource Estimate. Key parameters used for the pit shells were: Gold price of USD1700/oz Au, overall slope angle of 55 degrees, dilution of 10%, recovery of 90%, mining costs of USD1.93 per tonne for waste and USD 2.24 and USD 2.84 per tonne for Tuzon and Dugbe F respectively.
Combined Mineral Resource Estimate Statement
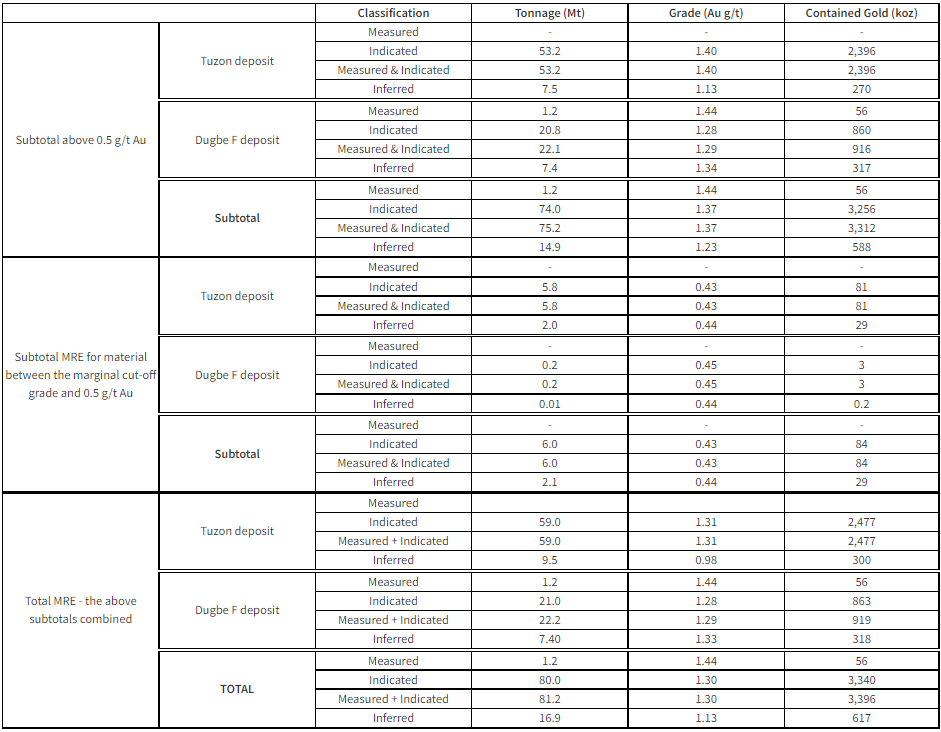
The combined statement for both deposits is provided in Table 3 subdivided using a 0.5g/t Au grade category and reported above a lower 'marginal' cut-off grade. Within the 0.5 g/t Au grade category, the Measured and Indicated tonnage is 75.2Mt grading 1.37g/t Au containing 3.31Moz gold plus an Inferred tonnage of 14.9Mt at 1.23g/t Au containing 588 thousand ounces (koz) gold. Although not shown as a grade category in Table 3, above a 1.0g/t Au cut-off, the combined Measured and Indicated part of the MRE is 2.88 million ounces (Moz) of gold contained in 56.6 million tonnes (Mt) grading 1.58 grams per tonne (g/t), mostly hosted within the HG domain at Tuzon.
Table 3. Mineral Resource Estimate effective 17 November 2021
Notes:
1. The effective date of the Mineral Resource Estimate is 17 November 2021.
2. The marginal cut-off grades for Tuzon are 0.34g/t Au for fresh material and 0.39g/t Au for weathered material. The marginal cut-off grades for Dugbe F are 0.36g/t Au for fresh material and 0.40g/t Au for weathered material.
3. Rounding errors may be evident when combining totals in the table but are immaterial.
4. The Qualified Person is Mr. Martin Pittuck (CEng, MIMMM).
5. The Mineral Resource has been classified under the guidelines of the Canadian Institute of Mining, Metallurgy and Petroleum (CIM) and undertaken within the context of the Canadian Securities Administrators' National Instrument 43-101 (NI 43-101).
6. Mineral Resources are not Mineral Reserves and have no demonstrated economic viability. The estimate of Mineral Resources may be materially affected by environmental, permitting, legal, marketing or other relevant issues.
7. Mineral Resource estimates are stated within conceptual pit shells that have been used to define Reasonable Prospects for Eventual Economic Extraction (RPEEE). The pit shells used the following main parameters: (i) Au price of US$1700/ounce; (ii) plant recovery of 90%; and (iii) mean specific gravity of 2.78t/m3 for mineralised gneiss and 2.64t/m-3 for pegmatite in fresh rock and 2.1t/m3 for oxide material.
OPPORTUNITIES TO EXPAND AND DISCOVER ADDITIONAL DEPOSITS
Both deposits extend beyond the MRE pit shell and there is opportunity to expand the high-grade zone at Tuzon beyond its current modelled extent -Figure 7. At Tuzon, the 'SE limb' warrants additional drilling to test the potential for extending this further. The last drillhole on this limb was TDC186 which intersected 17.3m with an average grade of 2.70g/t Au.
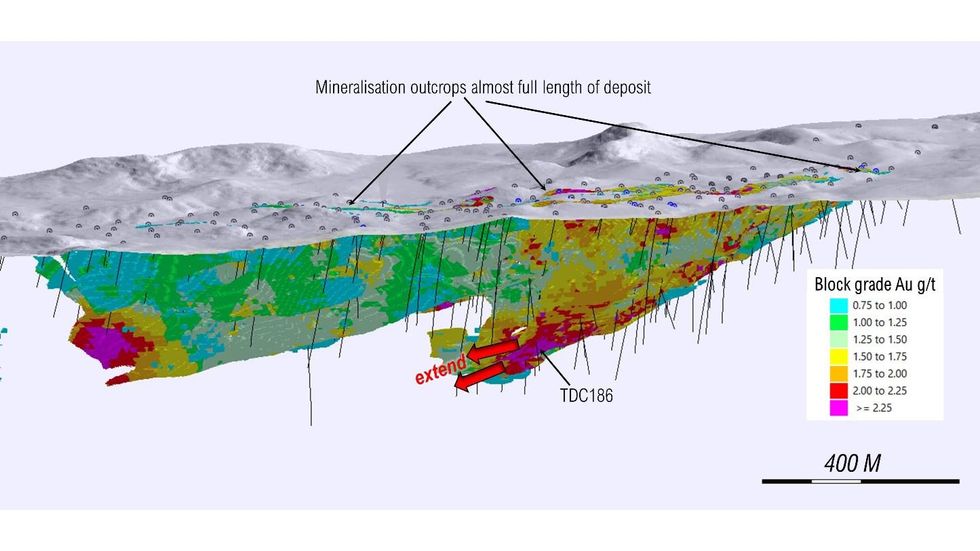
Figure 8. Map showing targets along strike from Tuzon
MINERAL RESERVE ESTIMATE
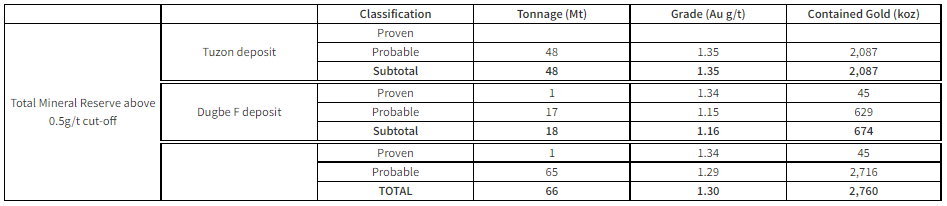
The Mineral Reserve Estimate (MRev) has been prepared as part of the Dugbe FS completed by DRA, using the CIM definitions and guidelines adopted in May 2014 (CIM, 2014) and procedures for classifying the reported Mineral Reserves were undertaken within the context of the Canadian Securities Administrators' National Instrument 43-101 (NI 43-101)-Table 4.
The Mineral Reserves were derived from the MREs and the block models presented in the Mineral Resource section. The Mineral Reserves are based on the Measured and Indicated Mineral Resources that have been identified as being economically extractable and which incorporate mining losses and dilution. A summary of the Mineral Reserves by deposit is shown in the table below.
Though not considered for the Mineral Reserve Estimate there are Inferred Mineral Resources within the FS pit and in immediate proximity to it. This material comprises 1.7 Mt at an average grade of 1.25 g/t Au containing 67 koz and may be converted to Indicated Mineral Resources with a relatively small number of additional drillholes. If this is realised, they may then contribute additional material to future Mineral Reserve Estimates.
Table 4. Mineral Reserve Estimate effective 1 May 2022
Notes:
1. The effective date of the Mineral Reserve is 1 May 2022.
2. Mineral Reserves are defined within pit designs guided by pit shells.
3. Mineral Reserves are reported at 0.50g/t cut-off grade and a metal price of US$1,600/oz Au.
4. Figures are rounded to the appropriate level of precision for the reporting of Mineral Reserves. Due to rounding some columns or rows may not compute as shown.
5. The Mineral Reserves are stated as diluted dry metric tonnes. Estimated dilution applied to Dugbe F is 10.1% and Tuzon 6.9%, while estimated losses were 6.3% for Dugbe F and 5.0% for Tuzon.
6. The Qualified Person is Mr Frikkie Fourie (B.Eng, Pr.Eng, MSAIMM).
7. The Mineral Reserves have been classified under the guidelines of the Canadian Institute of Mining, Metallurgy and Petroleum (CIM).
MINING
The mining method for both the Tuzon and Dugbe F deposits will be conventional open pit mining, using a combination of 100t dump trucks and 200t excavators for loading and hauling. Ore blocks will be defined by grade control drilling, after which 12m and 6m benches will be drilled with drill rigs and charged with emulsion for blasting. Ore will be delivered to the crusher or to low-grade stockpiles. A small proportion of oxide ore will be blended into the hard rock ore before being processed.
Waste rock will be placed adjacent to the pits, or in areas of mined out pits in the case of Dugbe F. Waste rock storage facilities will be progressively capped every year, and fully closed as sections are competed.
A small amount of Inferred material is present in the pits and may be sent for processing rather than to the waste rock storage facilities.
Both Dugbe F and Tuzon will be mined concurrently to keep the initial strip ratio low, and a low-grade stockpile will be established to prioritise higher grade ore being fed to the process plant. The first five years will see approximately 28Mtpa of rock mined, increasing to an average of 41Mtpa in the later years. Mining is scheduled to end in Year 11, but stockpiles will then be rehandled and processed until Year 14. This will also enable concurrent mine closure work.
Mining of the Dugbe F deposit will consist of three pits, some of which have a gentle footwall gradient. This will allow for some concurrent backfilling with waste rock, reducing haul distances and environmental impact.
Pasofino Gold intends to use a mining contractor and a number of initial proposals and costs have been received and used in the FS.
MINERAL PROCESSING
As part of the FS, test work was undertaken over the period 2021 to 2022, under the governance of DRA, on samples originating from the Dugbe F and Tuzon deposits. The test work was primarily undertaken at ALS Perth with comparative tests and analysis on select samples at SGS and Mintek in Johannesburg, South Africa as well as Bureau Veritas in Perth to validate the ALS test work findings and analysis.
The FS test work programme included flowsheet development and optimisation test work on master composite samples, followed by variability test work on 15 variability samples. The test work included comparative gold recovery test work for a conventional Gravity-CIL flowsheet and a Gravity-Flotation-CIL flowsheet with results summarised as follows:
Gold recovery ranged from 78.2% to 87.4% averaging 83.6% for Tuzon fresh samples, 71.9% to 84.4% averaging 77.8% for Dugbe F fresh samples with a recovery of 97.2% for the Dugbe F oxide composite for the Gravity-CIL flowsheet.
Gold recovery ranged from 84.2% to 90.9% averaging 88.8% for Tuzon fresh samples, 81.4% to 88.6% averaging 86.0% for Dugbe F fresh samples with a recovery of 97.3% for the Dugbe F oxide composite for the Gravity-Flotation-CIL flowsheet.
The gold recovery for the Gravity-CIL flowsheet is expected to range from 80% to 85%, averaging 83% over LoM at an average process operating cost of US$10.7/t. The gold recovery for the Gravity-Flotation-CIL flowsheet, which includes regrind and CIL of flotation concentrate and CIL on the combined tailings, is expected to range from 86% to 90%, averaging 88% over LoM at a higher average process operating cost of US$16.8/t.
The Gravity-CIL flowsheet was selected as the basis for the FS based on the outcome of a high-level techno-economic assessment which considered the comparative gold recovery, process plant operating cost and capital cost. Further test work will be undertaken once the FS has been completed to assess the potential for recovery improvement and reduced operating cost. The Dugbe Gold Mine Project FS gold processing plant design has been based on a fresh ore throughput rate of 5.0Mtpa.
The flowsheet includes semi-autogenous grinding (SAG milling), secondary ball milling and tertiary Vertimill, followed by a gravity concentration and CIL gold recovery circuit.
This process flowsheet is well known in industry and has historically been proven as a successful processing route for oxide and fresh gold ores. The process plant design includes a tailings counter current decantation thickener circuit (CCD) to maximise cyanide water recovery and reduce the final tailings CNwad concentration to less than 50ppm. Figure 9 summarises the flowsheet for the FS.
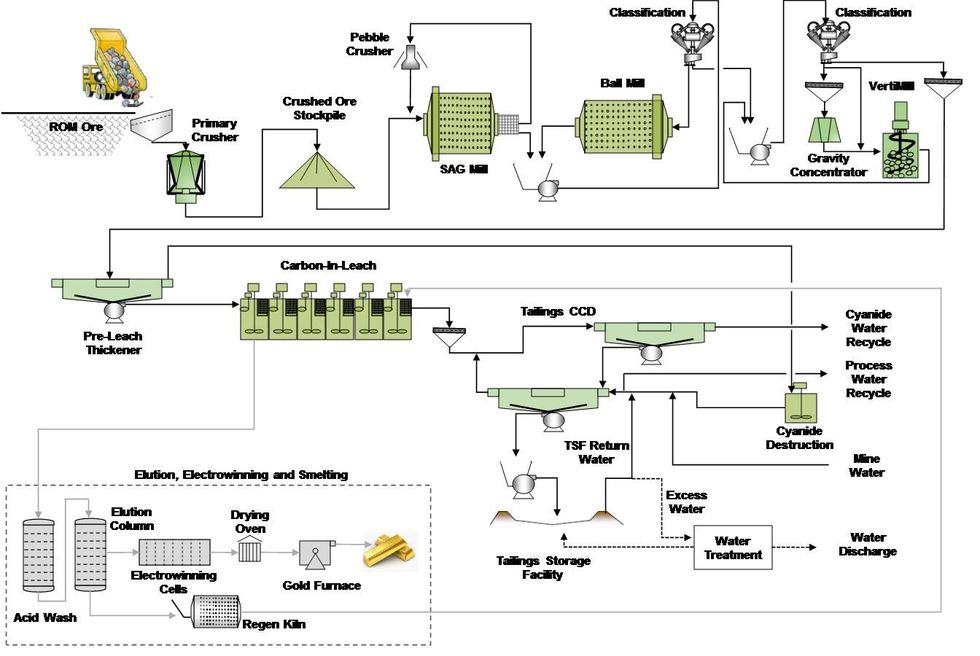
Figure 9. Flowsheet for the FS
PROJECT INFRASTRUCTURE
Access
The primary access is a 76km road from the Port of Greenville to the mine site utilising the existing public road infrastructure. The main requirement is to upgrade the existing access roads and tracks to accommodate the anticipated traffic volumes during mining operations, as well as to provide public access to the local villages. The road is split into two defined sections; the 32km road from the Port of Greenville to Plazon Junction and the 44.1km track from Plazon Junction to the mine site. Access along the 30.1km from the Port of Greenville to Plazon Junction consists of gravel roads that are mostly in fair condition. The balance of the primary access road, between Plazon Junction and the mine site, consists of existing gravel roads and tracks. This section will require extensive upgrades to meet the required standards.
Water
Raw water will be supplied from the Geebo River, via a pumping station, in the first year of operation. Treated water returned from the tailings storage facility (TSF) will be utilised as raw water from Year 2 onwards. Based on the outcome of water balance modelling the design includes allowance to treat water being discharged from the TSF ranging from 0.7M - 3.7M m3/annum over the life of mine prior to discharge to the environment in compliance with the globally recognised discharge standards.
Power
The power demand of the Dugbe mining activities has been calculated based on the final mechanical equipment list generated for the FS. A detailed electrical load schedule has been compiled from the equipment list and includes electrical demands from all process-related equipment, lighting and small power demands from supporting infrastructure, and the mine accommodation camp. Where calculated values were not available, typical utilisation and diversity factors were applied in the calculation of the running power demand. The estimated running power demand is anticipated at 28.9MW (30.8MVA), with an annual energy consumption of 228GWh.
Due to the lack of an electrical utility grid in the vicinity of the mine, a local power generation plant will be established to generate electrical power. An LNG-fuelled thermal generation plant consisting of 16 x 2MWe generators, hybridised with a 16MWp solar PV plant, has been determined to produce the lowest levelised cost of energy, supported by various trade-off studies and competitive tenders. The installation of the PV plant will be phased to reduce the initial capital impact. Additionally, the utilisation of LNG fuel as opposed to HFO fuel for thermal power generation has resulted in a substantial reduction in prospective greenhouse gas emissions, which are further reduced through the application of solar power generation.
An LNG supply chain has been outlined and includes the supply of LNG from the LNG terminal in Tema, Ghana, shipped via a leased 7,500m3 floating storage unit (FSU) to the Port of Greenville, and then road freighted via cryogenic road tankers to the mine site. A two-week LNG storage facility has been included at the mine site to provide a buffer for refuelling procedures by the FSU, optimised operation of the road tanker fleet, and to allow for interruptions of the supply chain due to inclement weather conditions.
The 14-year levelised cost of energy for the mine was calculated to be $0.175 per kWh and is based on an LNG price of $7.83GJ, along with other capital, fixed and variable operations and maintenance costs. The LNG price is based on a three-year trailing average Brent crude price of $62.65 per barrel, as of 18 April 2022. Power plant and LNG-related infrastructure is based on a BOOT style contract, with capital costs being repaid over a multi-year period.
TAILINGS MANAGEMENT
A site selection process has been conducted to determine the preferred TSF location. The TSF has been designed to store 65Mt of tailings over a 14-year LoM. The TSF has been split into two phases. TSF 1 operates for the first four years of operations, storing 20Mt, and TSF 2, situated to the west of TSF 1, comes into operation for the remaining nine years storing 45Mt.
TSF 1 and 2 have been designed as HDPE lined, downstream raised, full containment valley dams. The construction of the TSF embankments is a combination of borrow material and selected waste rock provided by the open pit mining operation. A detox plant and associated water dam is constructed near the TSFs to treat and release excess water from the TSFs. Following the operational LoM, the TSFs will be capped allowing for the separation of the tailings body from clean runoff water. Storm water runoff will not require treatment following the capping of the TSF and will be discharged from the TSF by means of a closure spillway. The TSF costing has been determined using tendered rates sourced from local contractors.
ENVIRONMENT, SOCIAL AND GOVERNANCE
An ESIA has been undertaken in accordance with the Environmental Protection and Management Law of Liberia 2003 and the Liberian Environmental Protection Agency's (EPA) Environmental and Social Impact Assessment Procedural Guidelines (2017). It is also aligned with good international industry practice, as represented by the International Finance Corporation's Performance Standards. Additional environmental and social requirements are specified in the MDA. The study included primary environmental and social data collection by a team of Liberian and international specialists, building on the historical data available from the previous ESIA study completed in 2015.
In parallel with the ESIA, a preliminary resettlement policy framework has been completed to set out the future resettlement action plan requirements. There have been five rounds of formal engagement with potentially affected communities and other stakeholders throughout these studies.
Recent feedback sessions on the outcome of the ESIA indicate general acceptance of the Project, with concerns raised over the management of any future resettlement process, maximising local employment opportunities and impacts on and loss of access to forest areas that are important for subsistence, livelihoods and cultural heritage. The outcome of the feedback sessions is being assessed and the final ESIA report is planned to be submitted to the EPA in June 2022.
The sensitive ecological setting and under-developed socio-economic status of the area pose both challenges and opportunities for the Project. Based on the extensive stakeholder engagement, communities in the area are aware of their rights. The key risk areas identified through the ESIA and resettlement study, and the proposed management of these are summarised below.
Several communities in or adjacent to the proposed mine infrastructure will need to be relocated and there will be economic displacement of farmers and artisanal and small-scale miners, few of whom are formally licensed by the Government. There has been extensive engagement with these affected people. A resettlement action plan and ASM action plan are being developed to manage the engagement, relocation, compensation and livelihood restoration required. The aim is to ensure affected parties are better off or at least not disadvantaged as a result of the Project.
As noted above, options to minimise carbon emissions have been considered but the mine will still be carbon net positive. To manage this, help protect and offset sensitive habitats (see below) and provide funds to support community and alternative livelihood development, Pasofino is proposing to initiate a sustainable forestry project. This integrated and novel approach would involve working with a third-party forestry specialist organisation, the Government and local communities to manage a landscape-scale area of forest with the aim of offsetting biodiversity impacts, allowing some sustainable timber harvesting and providing employment opportunities. The carbon credits and value of timber would be used to sustain the project with the aim of it continuing beyond the life of the Project.
The location and size of infrastructure has taken consideration of areas with high biodiversity sensitivity; areas important for ecosystem services; and areas of soils with higher sensitivity (wetlands). However, some critical and natural habitats and some sensitive soils will still be impacted. A Biodiversity Management Plan is being developed to define required offsets as part of the wider sustainable forestry project.
Geochemical characterisation of the tailings and waste rock has been undertaken and, in consultation with the engineers, the storage facilities designed to minimise seepage and prevent accidental releases to the environment. Due to the net positive rainfall, discharges to the environment from the TSF will occur following treatment to meet effluent standards. Settling of contact water from the waste rock storage facilities will occur prior to discharge. Water and Waste Management Plans are being developed to guide construction and operation of the facilities with the aim of protecting sensitive water resources, and the people and ecosystems that depend on them. The plans include additional studies needed to confirm preliminary assumptions around design, operation and closure of the facilities, particularly those associated with waste rock and pit lakes.
Expectations around what the mine will provide in terms of community development and job opportunities are high, often exceeding the legislated commitments laid out in the MDA. Direct and indirect employment opportunities will be generated by the Project, with the MDA stipulating local content and training requirements.
Building on the management approaches outlined above, the ESIA includes a framework for a Community Development Management Plan that sets out how communities, working with Pasofino and relevant Government departments, will identify, develop, fund and implement projects that target provision of training, infrastructure development, social service delivery and alternative livelihood development. The plan will also help with managing the predicted influx of people and support Government to effectively use its increased revenue to plan and improve social services and infrastructure.
A conceptual closure and rehabilitation plan has been developed, along with a preliminary cost estimate. The plan lays out the progressive rehabilitation requirements, closure approaches and post mining monitoring and maintenance. It identifies further studies needed to confirm final closure approaches taking consideration of the geochemical characterisation of mining wastes, expectations of communities with respect to post mining land uses and sensitivity of soils, habitats and water resources in the area.
Other impacts that have been identified, assessed and had appropriate management plans developed, as part of the ESIA, include those associated with air quality, noise, community health and safety (particularly relating to traffic), cultural heritage, land clearance and soils.
To address the above risks and as required by law, an Environmental and Social Management Plan (ESMP) has been compiled that sets out the management system framework for implementing the measures needed to mitigate the negative impacts and optimise the positive impacts arising from the Project. These measures are contained in various environment, social and health & safety supporting plans appended to the ESMP. The proposed management system and associated plans address requirements for monitoring performance, audits to assess compliance, management review and reporting to internal and external stakeholders. The ESMP will be submitted to the EPA in parallel with the ESIA report.
CAPITAL COST ESTIMATE
The project capital has been derived predominantly from tendered costs and rates from the market, as well as relevant data base costs from recent projects, and is summarised in Table 5. Capital is within the accuracy of a Class 3 Association of the Advancement of Cost Engineering (AACE) estimate of (+20 %/-15%).
Table 5. Capital Summary
| DIRECT | TOTAL USD M |
| Process Plant | 129 |
| Process Plant Infrastructure | 37 |
| General Site Infrastructure | 77 |
| Tailings Storage Facility | 19 |
| Access Road | 36 |
| Port Infrastructure | 8 |
| Mining | 22 |
| Sub-Total: Base Estimate Cost | 32 |
| INDIRECT | |
| General Indirect Costs | 71 |
| SUB TOTAL: PRE PRODUCTION CAPITAL | 397 |
| OWNER'S COST | |
| Owner's Cost | 37 |
| TOTAL COST | 435 |
Note: Rounding may cause totals to differ.
OPERATING COST ESTIMATE
The operating costs over life of Project include mine operations, process plant, TSF and general and administrative (G&A) costs. Total LoM average operational costs are estimated to be approximately USD154 million per annum equivalent to a unit rate of USD31t RoM. An overview of operational costs is presented in Table 6.
Table 6. LOM operating expenditure (columns may not add up due to rounding)
| LOM (USD M) | LOM (USD/t) | |
| Processing (Incl TSF) | 700 | 10.71 |
| Mining | 764 | 11.52 |
| G&A | 100 | 1.51 |
| Other | 378 | 5.71 |
| TOTAL | 1,953 | 29.47 |
ECONOMIC OUTCOMES
Table 7 summarises the robust economics for the Project resulting from detailed engineering across all disciplines.
Table 7. Economic outcomes summary
| DESCRIPTION | UNITS | VALUE |
| Production Statistics | ||
| Production LoM | years | 14 |
| Production LoM | months | 159 |
| Total Ore Tonnes | M tonnes | 66.27 |
| Total Au Ounces Recovered | M Oz | 2.27 |
| LoP Average | ||
| Throughput | t/a | 5.00 |
| Au Grade | g/t | 1.30 |
| Au Recovery | % | 83.01 |
| Au Ounces Recovered | Oz/a | 171,594 |
| Initial Capital Cost | M USD | 435 |
| SIB Capital Cost | M USD | 98 |
| Operating Cost | ||
| LoP Average | M USD/a | 147 |
| LoP Unit Cost | USD/t | 29 |
| Financial Outcomes (PRE-TAX) | ||
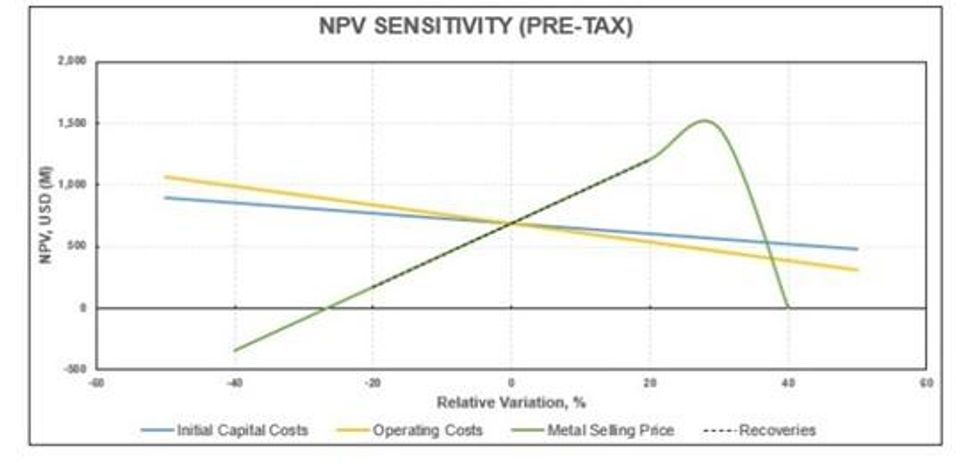
| NPV | M USD | 690 |
| IRR | % | 26.35 |
| Payback Period (undiscounted) | years | 3.3 |
| AISC | USD/Oz | 1,005 |
| USD/t | 34 | |
| Financial Outcomes (POST-TAX) | ||
| NPV | M USD | 530 |
| IRR | % | 23.6 |
| Payback Period (undiscounted) | years | 3.3 |
| AISC | USD/Oz | 1,005 |
| USD/t | 34 |
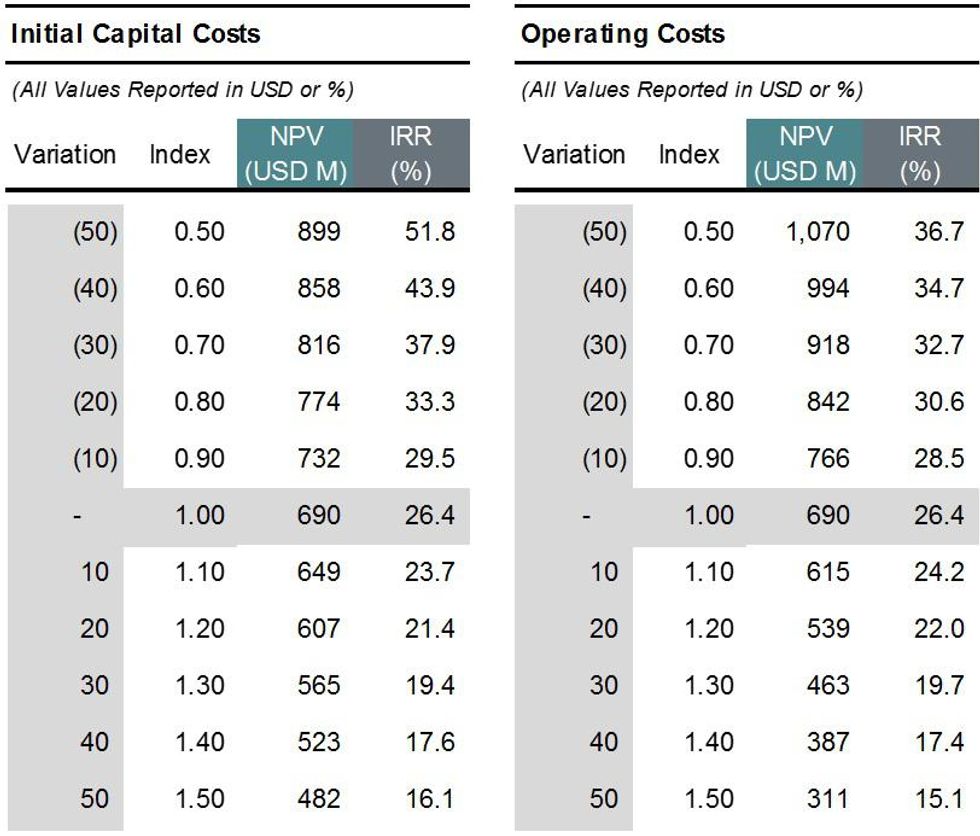
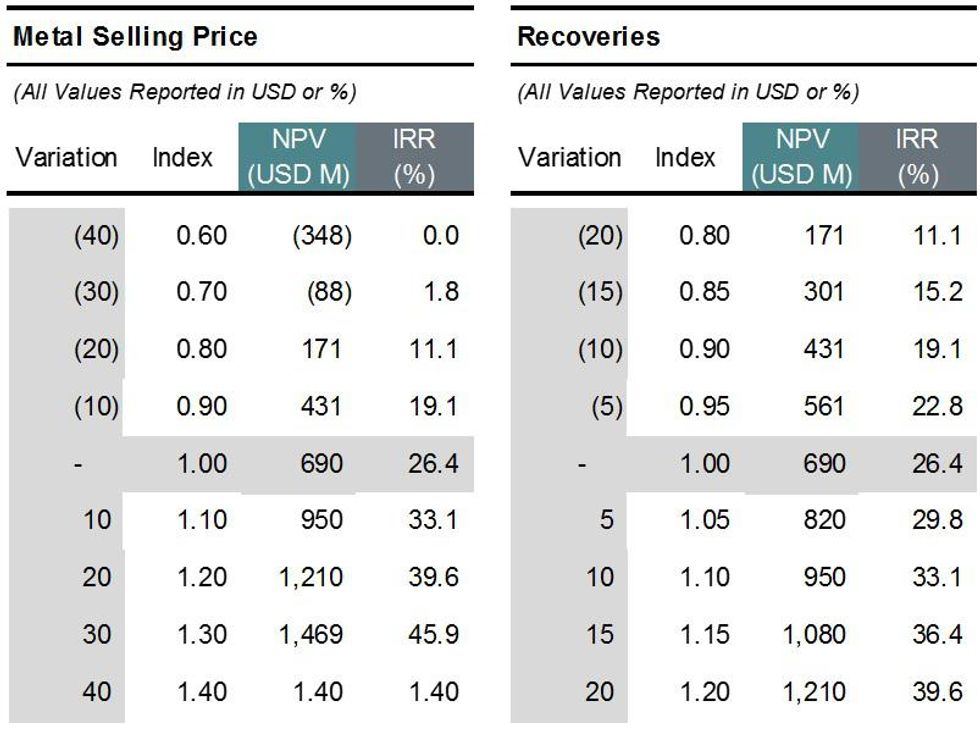
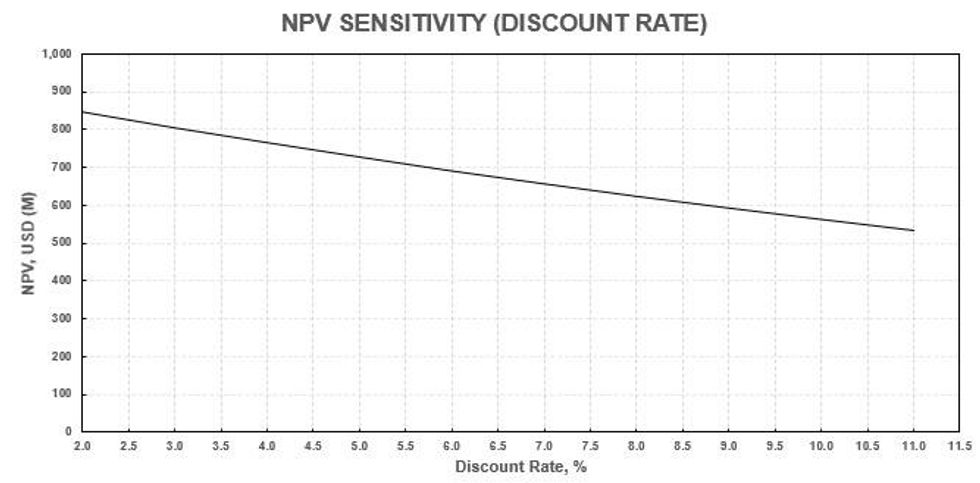
NET PRESENT VALUE (NPV) SENSITIVITY TO GOLD PRICE
The impact of flexing gold price and discount rate on NPV (pre-and post-tax) has been assessed and presented in the data tables below.
Table 8. Metal Price and discount rate data tables
DEVELOPMENT TIMETABLE
The Project has a planned duration of 30 months from the start of the design and procurement activities. An initial workstream will be the enabling works which will deal with the maintenance and upgrades of the Port of Greenville and the access road to site. Fuel storage, accommodation and the bulk LNG power supply will be constructed as part of the enabling works which will be timed for the completion of the power supply (in month 26) in time for the start of cold commissioning of the process plant.
Design and procurement of the process plant, TSF and the supporting infrastructure will start in month 3 with commissioning of the process plant planned for month 28. Cold commissioning will be complete in month 30 with the start of ore being fed to the plant in month 31.
QUALIFIED PERSONS STATEMENT
Scientific or technical information in this disclosure (other than information that relates to mining, processing and related infrastructure results) was reviewed by Mr Martin Pittuck, a full-time employee of SRK Consulting UK Ltd. Mr Pittuck is a member in good standing with the Institute of Materials, Minerals and Mining, a Fellow of the Geological Society of London and is a Chartered Engineer; he has sufficient experience that is relevant to the commodity, style of mineralisation under consideration and activity which he is undertaking to qualify as a Qualified Person under National Instrument 43-101.
Scientific or technical information in this disclosure that relates to processing and related infrastructure results was reviewed by Mr Robin Welsh, a full-time employee of DRA Global. Mr Welsh is a Professional Engineer in good standing with the Engineering Council of South Africa and has sufficient experience that is relevant to the project under consideration which he is undertaking to qualify as a Qualified Person under National Instrument 43-101.
Scientific or technical information in this disclosure that relates to metallurgy and processing results was reviewed by Mr Marius Phillips, a full-time employee of DRA Global. Mr Phillips is a Chartered Professional Member of the Australasian Institute of Mining & Metallurgy and has sufficient experience that is relevant to the project under consideration which he is undertaking to qualify as a Qualified Person under National Instrument 43-101.
Scientific or technical information in this disclosure that relates to mining results was reviewed by Mr Frikkie Fourie, an independent consultant for DRA Global. Mr Fourie is a Professional Engineer in good standing with the Engineering Council of South Africa, is a Member of the South African Institute of Mining and Metallurgy and has sufficient experience that is relevant to the project under consideration which he is undertaking to qualify as a Qualified Person under National Instrument 43-101.
Scientific or technical information in this disclosure that relates to tailings storage facility results was reviewed by Mr Guy Wiid, a permanent employee for Epoch Resources. Mr Wiid is a Professional Engineer in good standing with the Engineering Council of South Africa, and a Chartered Engineering good standing with the American Society of Civil Engineers and has sufficient experience that is relevant to the project under consideration which he is undertaking to qualify as a Qualified Person under National Instrument 43-101.
Scientific or technical information in this disclosure that relates to environmental, social and governance results was reviewed by Ms Fiona Cessford-Le Roux, a full-time employee of SRK UK. Ms Cessford-Le Roux is a Chartered Environmentalist in good standing with and a fellow of the Institute of Materials, Minerals & Mining of the United Kingdom She has sufficient experience which is relevant to the project under consideration which she is undertaking to qualify as a Qualified Person under National Instrument 43-101.
Scientific or technical information in this disclosure that relates to financial results was reviewed by Mr Juan Kotzee, an independent consultant for DRA Global. Mr Kotzee is a Financial Accountant, and has sufficient experience that is relevant to the project under consideration which he is undertaking to qualify as a Qualified Person under National Instrument 43-101.
ABOUT THE DUGBE GOLD PROJECT
The 2,559 km2 Dugbe Gold Project is in southern Liberia and situated within the southwestern corner of the Birimian Supergroup which is host to the majority of West African gold deposits. To date, two deposits have been identified on the Project; Dugbe F and Tuzon discovered by Hummingbird in 2009 and 2011 respectively. The deposits are located within 4 km of the Dugbe Shear Zone which is thought to have played a role in large scale gold mineralization in the area.
A large amount of exploration in the area was conducted by Hummingbird up until 2012 including 74,497 m of diamond coring. Pasofino drilled an additional 14,584 metres at Tuzon and Dugbe during 2021. Both deposits have Mineral Resource Estimates dated 17 November 2021. Following the completion of the Definitive Feasibility Study in June 2022 a Mineral Reserve Estimate was declared, based on the open-pit mining of both deposits over a 14-year Life of Mine.
In addition, there are many gold prospects within the Project including the Bukon Jedeh area acquired in late 2020. Here artisanal mining has extracted gold since the 1930's and includes currently active open pits over 20 m deep working fresh-bedrock. At the DSZ target on the Tuzon-Sackor trend Pasofino has discovered a broad zone of surface gold mineralisation in trench and outcrop along strike from Tuzon. At this and several of the other prospects no drilling has been carried out to date.
In 2019, Hummingbird signed a 25-year Mineral Development Agreement ("MDA") with the Government of Liberia providing the necessary long-term framework and stabilization of taxes and duties. Under the terms of the MDA, the royalty rate on gold production is 3%, the income tax rate payable is 25% (with credit given for historic exploration expenditures), the fuel duty is reduced by 50%, and the Government of Liberia is granted a free carried interest of 10% in the Project.
ABOUT PASOFINO GOLD LTD.
Pasofino Gold Ltd. is a Canadian-based mineral exploration company listed on the TSX-V (VEIN).
Pasofino, through its wholly-owned subsidiary, is earning a 49% economic interest (prior to the issuance of the Government of Liberia's 10% carried interest) in the Dugbe Gold Project.
For further information, please visit www.pasofinogold.com or contact:
Ian Stalker, President & CEO
T: 604 367 8110
E: istalker@pasofinogold.com
NATIONAL INSTRUMENT 43-101 TECHNICAL REPORT
A technical report for the Dugbe Gold Project will be prepared in accordance with National Instrument 43-101 and will be filed on SEDAR at www.sedar.com and on the Company's website at www.pasofinogold.com within 45 days of this news release. Readers are encouraged to read the technical report in its entirety, including all qualifications, assumptions and exclusions that relate to the details summarised in this news release. The technical report is intended to be read as a whole, and sections should not be read or relied upon out of context.
For this reason, information contained in this news release in respect of the Dugbe Gold Project may not be comparable to similar information made public by United States companies subject to the reporting and disclosure requirements under the United States federal securities laws and the rules and regulations thereunder.
Neither the TSX Venture Exchange nor its Regulation Services Provider (as that term is defined in the policies of the TSX Venture Exchange) accepts responsibility for the adequacy or accuracy of this release.
CAUTIONARY STATEMENTS REGARDING FORWARD-LOOKING STATEMENTS
This news release contains "forward-looking statements" that are based on expectations, estimates, projections and interpretations as at the date of this news release. Forward-looking statements are frequently characterised by words such as "plan", "expect", "project", "seek", "intend", "believe", "anticipate", "estimate", "suggest", "indicate" and other similar words or statements that certain events or conditions "may" or "will" occur, and include, without limitation, statements regarding the ability to raise the funds to finance its ongoing business activities including the acquisition of mineral projects and the exploration and development of its projects. Such forward-looking statements involve known and unknown risks, uncertainties and other factors which may cause the actual results, performance or achievements of the Company to be materially different from any future results, performance or achievements expressed or implied by such forward-looking statements. Such risks and other factors may include, but are not limited to, the results of exploration activities; the ability of the Company to complete further exploration activities; timing and availability of external financing on acceptable terms and those risk factors outlined in the Company's Management Discussion and Analysis as filed on SEDAR. The Company does not undertake to update any forward-looking information except in accordance with applicable securities laws.
NON-IFRS MEASURES
This news release includes certain terms or performance measures commonly used in the mining industry that are not defined under International Financial Reporting Standards (IFRS), including cash costs and AISC per payable ounce of gold sold. Non-IFRS measures do not have any standardised meaning prescribed under IFRS and, therefore, they may not be comparable to similar measures employed by other companies. We believe that, in addition to conventional measures prepared in accordance with IFRS, certain investors use this information to evaluate our performance. The data presented is intended to provide additional information and should not be considered in isolation or as a substitute for measures of performance prepared in accordance with IFRS.
[1] Cash costs per payable ounce and AISC per payable ounce are non-IFRS financial measures. Please see "Cautionary Note Regarding Non-IFRS Measures". AISC per payable ounce includes all mining costs, processing costs, mine level G&A, royalties, sustaining capital and closure costs. Cash costs per payable ounce includes all mining costs, processing costs, mine level G&A and royalties.