
November 17, 2024
Norfolk Metals (ASX:NFL) (Norfolk or the Company) is pleased to present the following Orroroo Project update.
- Norfolk engaged Pacific Consultants to build a data base providing for a more model driven approach to further exploration in the expanded tenement package.
- Previously identified gamma anomalies at around 120m depth confirmed reduced sediments (redox environment) developed around this target horizon.
- Structural reinterpretation of the gravity data and phreatic uranium flow model generates new targets.
- Norfolk progressing exploration towards regional approach with focus on broad spaced drilling over possible controlling structures.
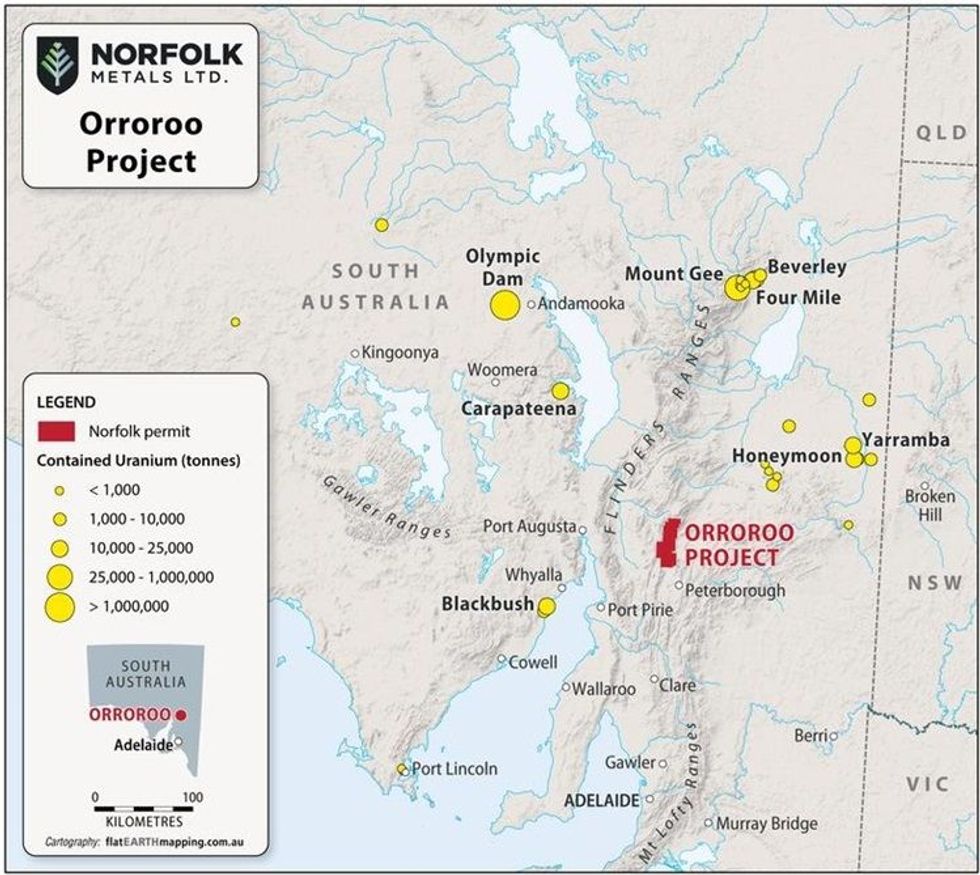
Figure 1: Orroroo Project Location Plan
Commenting on Norfolk Metals, Executive Chairman, Ben Phillips, states:
“Norfolk is extremely pleased with the outcomes of Pacific Consultants and our technical team increasing our understanding on the regional prospectivity of the Orroroo Project. The Company expects to conduct a subsequent drilling campaign which must consider all the structurally hosted contributions along with any low cost pre-drilling targeting techniques to be completed prior. We now have additional information to proceed forward with stakeholder engagements and required contractors”
Drill core and drill chips Investigation
Drill core, drill cuttings and muds from holes drilled in the Walloway Basin to the north of Orroroo were recently reviewed at the South Australian (SA) Government core facility in Adelaide.
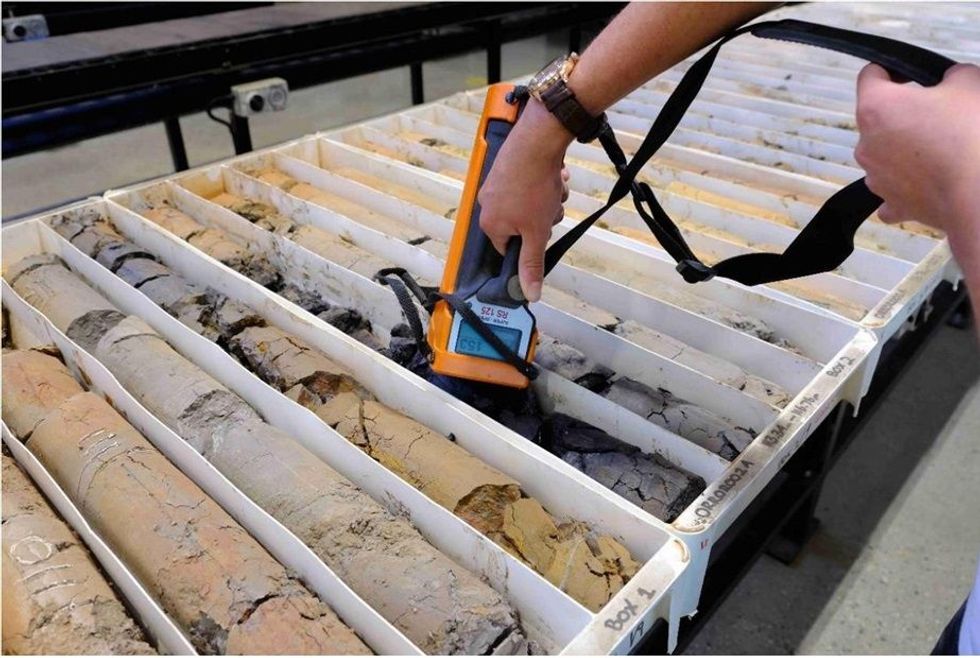
Figure 2: Spectrometer 153 cps Orroroo 2A reduced sediment margin.
Pacific Consulting was engaged to build a data base providing for a more model driven approach to further exploration across the tenement package. Data incudes drill data from Linc Energy drilling as well as numerous water bores in the district.
A digital data base has been built in Micromine using open file data from the SA Government. A number of water bores and coal exploration holes are located within the Norfolk tenement package. Radiometric logs show a wide spread anomaly in the upper Tertiary at ~ 120m below current surface. The Walloway Coal (lignite) Seam occurs in the lower Tertiary stratigraphy of the basin and is associated with low radiometric anomalism marginal to the lignite.
In borehole Orroroo 2A (Figure 2), the carbonaceous silty clay at ~ 112-114m has an elevated radiometric reading on the margin with oxidized sediments above and below. A clear demonstration that, at least locally, reduced sediments were developed at this target sedimentary horizon and that uranium was deposited on the redox margin. The drill core generally shows large intervals of silt / clayey silt with medium to coarse sand bands now silted up. The current drainage shows a similar and expected pattern in cross section with narrow cobble strewn high energy channels and silty alluvial fans with sandy beds.
The Walloway Basin contains sediment at the base which includes fine-grained sands, clayey sands and clays with minor lignite, of middle to late Eocene age. The overlying sediments include up to 70m of clays with coarse gravel beds, often lenticular. These overlying sediments range in age from mid-Tertiary to Quaternary. Obscuring the Quaternary are older deposits of recent alluvium and outwash material, derived from the surrounding Pre- Cambrian rocks.
While the paleoenvironment has not been reconstructed it can be expected that oxidized groundwater has percolated down gradient into the Walloway Basin carrying uranium which has interacted with either reduced sediments or sediments bearing reduced fluids. The source of the uranium remains uncertain (possibly from the west/northwest), but the coarse (sandy) beds at the target horizon are the clear exploration targets.
Seismic Data
In March 1980, the Department of Mines and Energy South Australia (DME SA) conducted several seismic lines over the Walloway Basin, in particular around the central portion of EL 6552 (Orroroo Project) and the northern portion of EL 6814 (Black Rock Project) (Figure 3).
The purpose of the study was to identify the depth and lithological layers of the Walloway Basin and identify possible structural features that may influence the water intake/flow of the basin.
The results of the seismic survey showed that the Walloway Basin can be divided into different layers based on the different seismic velocities. The layers were then correlated with the lithological units identified in the NFL and Linc Energy drill holes (Figure 4): -
- Quaternary to Recent – Layers 2, 2A and 3
- Upper Tertiary – Layer 3
- Lower Tertiary – Layer 4
- Basement – Layer 5
As confirmed in the drill core and drill chips investigation, Layer 4 (Lower Tertiary unit) consists of interbedded sand, silt and clay which is overlain by Layer 3 (Upper Tertiary), generally thick clay unit. The Lower Tertiary unit predominates and thickens along the deeper troughs of the basin and its sandy nature suggest deposition in a fluviatile environment. The overlying Upper Tertiary unit is a more extensive and continuous unit of grey, brown and black clay, with kaolinite bands indicating deposition in a lacustrine environment.
The general shape of the valley is asymmetrical with western margins steeper than east and bedrock depth up to 350m deep at the observed deepest point on line WB-79-1.
Several sections were constructed from the seismic survey but the two main seismic section lines WB-79-1 and WB-79-2 coincides with the drilling conducted by NFL along the Walloway Creek and Rankin Rd Targets respectively (see ASX announcement: 7 February 2024).
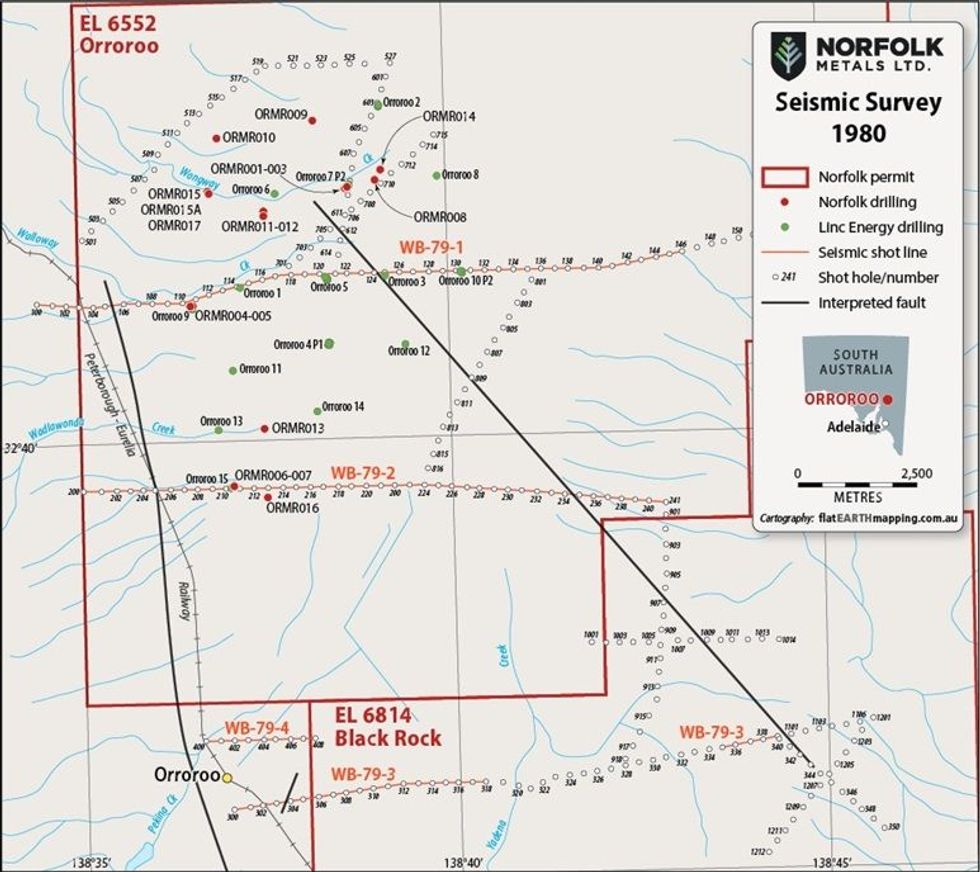
Figure 3: Seismic Survey DME SA March 1980
It was also noted from the seismic study that structurally, the Walloway Basin is fault controlled to the west and the major northwest-southeast fault identified to the east may be a zone of diapiric activity. These faults have also been observed in the interpretation of the regional gravity data.
It is important to note that historical water well drill holes have been included in the seismic sections but no data has been sighted on the public domain database of the DME SA.
Click here for the full ASX Release
This article includes content from Norfolk Metals, licensed for the purpose of publishing on Investing News Australia. This article does not constitute financial product advice. It is your responsibility to perform proper due diligence before acting upon any information provided here. Please refer to our full disclaimer here.
NFL:AU
The Conversation (0)
30 March
Norfolk to earn-into Chilean Copper Project
31 January
Quarterly Activities/Appendix 5B Cash Flow Report
7h
Jeff Clark: Gold Bull Market Running, These Stocks Getting Rewarded Now
Jeff Clark, founder of the Gold Advisor, shares his outlook for gold and silver.
However, he emphasizes that he's less concerned about prices and more interested in making sure his portfolio is prepared to weather global uncertainty.
That means having exposure to physical metal, as well as stocks.
Don't forget to follow us @INN_Resource for real-time updates!
Securities Disclosure: I, Charlotte McLeod, hold no direct investment interest in any company mentioned in this article.
Keep reading...Show less
9h
OPINION — Goldenomics 101: Follow the Money
This opinion piece was submitted to the Investing News Network (INN) by Darren Brady Nelson, who is an external contributor. INN believes it may be of interest to readers and has copy edited the material to ensure adherence to the company’s style guide; however, INN does not guarantee the accuracy or thoroughness of the information reported by external contributors. The opinions expressed by external contributors do not reflect the opinions of INN and do not constitute investment advice. All readers are encouraged to perform their own due diligence.
By Darren Brady Nelson
As an economist, I, perhaps somewhat sadly, have many economist friends. One of them recently alerted me to a post on X that was even a shock to me in the toxic 2020s. That being: “Almost all political donations by Fed employees go to one party. The Fed is already politicized.”
The post had a link to the data supporting this assertion, which was published at OpenSecrets. They are a “501(c)3” devoted to: “tracking money in US politics and its effect on elections and public policy.” Their theme is appropriately “Follow the Money,” as it is for this story.
Political money contributions, since 2016, from those at the Fed, range between 92 to 93 percent for Democrats and 8 to 9 percent for Republicans. As Public Choice economics teaches, it is crucial to “Follow the Money” in politics. Austrian and Chicago schools of economics teach the same for gold.
Gold pricing 101
Gold pricing is often characterized as being driven by “fear and uncertainty,” at least in the short run, including geopolitical fears like war and economic uncertainties such as recession. It is also typically recognized to be an “inflation hedge,” in the long run anyway.
Gold is an asset with a price determined in a 24/7/365 global auction, most often quoted per troy ounce, in the world’s reserve currency of US dollars. New supply plays an unusually small role compared to almost all other commodities, goods or services. Thus, highest bid wins.
Perhaps none of these things about gold, and its price, are new nor surprising. But what might be, despite the end of the gold standard in 1971 and legalization of gold investment in 1974, is that gold is still a shadow currency to fiat ones, especially US dollar, in the "always run."
The annual gold price from 1960 to 2024 is displayed below, as sourced from the World Bank. Rises include: late 1970s; late 2000s; and mid 2020s. Slides include: early 1980s; late 1990s; and early 2010s. Overall growth was: Sum 555 percent; Ave 8.7 percent; Max 98 percent; Min -24 percent; and CAGR 6.8 percent.Money supply 101
Gold is the inflation hedge, precisely because it is shadow currency. Money supply is the inflation source, precisely because it is fiat currency. As Chicago economist Milton Friedman wrote in Money Mischief (1994): “In the modern world, inflation is a printing-press phenomenon.”
There are multiple money supply measures, such as M0, M1, M2 and M3. M1 includes paper and coin currency held by the general public as well as liquid bank deposits (e.g. checking accounts). M3 includes M1, plus less liquid bank deposits (e.g. savings accounts) as well as “repos.”
Austrian economist Robert Murphy details in Understanding Money Mechanics (2021) just how the Fed’s printing, Treasury bonds and bank loans create US money supply, through open market operations. Since 2008 and 2020, the Fed has expanded to buying and selling just about anything.
Speaking on behalf of the Fed, and all major central banks, the Bank of England wrote in Money Creation in the Modern Economy (2014): “(B)ank lending creates deposits. At that moment, new money is created. (This is) ‘fountain pen money,’ created at the stroke of bankers’ pens(.)”
Annual M1 and M3 money supply from 1960 to 2024 are displayed below, as sourced from the OECD. M3 starts to take off from the mid 1990s. Both blast off in the early 2020s, M1 in part due to redefinition. Combined growth was: Sum 533 percent; Ave 8.3 percent; Max 126 percent; Min -6.4 percent; and CAGR 7.4 percent.
Gold inflation 101
Christian economist Gary North points out in Honest Money (2011) that businesses have three choices in the face of money inflation: A) profit deflation; B) price inflation; C) quality shrinkflation. Investors have a fourth: D) gold inflation. A, B, and C are all bad options. D is good.
The chart below shows cumulative annual growth of gold versus M1 and M3. Gold performs and protects against both M1 and M3 from 1974 to 2019, even in 2001, but not against M1 from 2020 to 2024. In 2019, gold had a 150 percent lead on M1 and 92 percent on M3. By 2022, it shrunk to -110 percent and 80 percent.
Cumulative yearly growth (percent).
Sources: OECD and World Bank.
A 2020 regression study found: “When the Federal Reserve increases money supply by 1%, gold prices increase by 0.94%.” A 2023 academic paper: “Confirms a long-term relationship between gold price and US M2.” Note that M1’s 2021 redefinition has now made it nearly identical to M1.
Period yearly change (percent).
Sources: OECD and World Bank.
However, the authors of Austrian School for Investors (2015) wrote: “Gold does not correlate with the rate of inflation as such, but with the rate of change of the inflation rate. In order to buttress this hypothesis, we calculated the regression depicted in (the chart below).”
Source: Austrian School for Investors: Austrian Investing between Inflation and Deflation.
In conclusion, as per my Wokenomics 101 (2023) ghost blog, money inflation by: “increasing demand puts upward pressure on price and quantity and downward pressure on quality.” That puts upward pressure on: nominal CPI and GDP statistics; as well as real gold investment and price.
Inflation doesn’t harm all. It helps some. They are the “Bootleggers and Baptists,” as Public Choice economist Bruce Yandle dubbed them in 1983. Bootleggers are crony capitalists, politicians and bureaucrats whose inflated revenue outpaces costs. Baptists are the “useful idiots.”
Thus, “Follow the Money” back to the “inflationistas” of: Big Business; Big Government; and Big Banks. All gain supernormal profits from easy money: one, making more money; two, collecting more money; and three, creating more money. Also, “Follow the Money” when it comes to gold.
And, sadly, there is one policy that is always bipartisan; print more money. But, gladly, gold will always win.
About Darren Brady Nelson
Darren Brady Nelson is chief economist with Fisher Liberty Gold and policy advisor to The Heartland Institute. He previously was economic advisor to Australian Senator Malcolm Roberts. He authored the Ten Principles of Regulation and Reform, and the CPI-X approach to budget cuts.
Keep reading...Show less
11h
Pacgold: Advancing the Alice River Gold Project in Northern Queensland with Tier 1 Discovery Potential
Pacgold (ASX:PGO) is an Australian gold exploration company advancing the high-potential Alice River Gold Project in Northern Queensland. Led by a technically driven and experienced team with proven success across exploration, resource development, and capital markets, Pacgold is applying a systematic, discovery-focused approach to unlock the project’s value.
The company holds a dominant 377 sq km land package, including eight mining leases, along the highly prospective Alice River Fault Zone (ARFZ) — a major structural corridor interpreted to host an intrusion-related gold system analogous to globally significant deposits such as Fort Knox (USA) and Hemi (WA).
The Alice River Gold Project is a large-scale, greenstone-hosted gold system located in Northern Queensland, centered along the regionally significant Alice River Fault Zone (ARFZ). The project covers 377 sq km of contiguous tenure, including eight granted mining leases.
Pacgold controls over 30 km of strike length along the ARFZ — a major crustal-scale structure that has only recently been the focus of systematic exploration using modern techniques, offering significant untapped discovery potential.
Company Highlights
- District-scale Discovery Potential: Pacgold controls more than 377 sq km of tenure and more than 30 km of strike length across the Alice River Fault Zone (ARFZ), a fertile, underexplored structural corridor in Northern Queensland.
- Maiden Resource: In May 2025, the company published a 474,000 oz gold mineral resource estimate (MRE), covering just five percent of the total strike, confirming high-grade mineralization and strong potential for expansion.
- Aggressive Exploration Strategy: More than 10,000 metres of RC drilling campaign is underway, complemented by air-core and diamond programs, aimed at growing the Central Zone resource and testing multiple regional targets.
- Attractive Valuation Entry: With a market capitalization of just ~AU$10 million and an EV of AU$8.5 million (as of Q1 2025), Pacgold provides a low-cost entry into a potentially Tier 1 gold system.
- Experienced Leadership: The board includes proven mine developers and discovery geologists with prior success at Chalice, AngloGold Ashanti, BHP and Sibanye-Stillwater.
This Pacgold profile is part of a paid investor education campaign.*
Click here to connect with Pacgold (ASX:PGO) to receive an Investor Presentation
Keep reading...Show less
18 July
High-Grade Gold Discovery in First 8 Mile Drill Hole
Miramar Resources Limited (ASX:M2R, “Miramar” or “the Company”) is pleased to announce that the first RC drill hole at the 8 Mile target has intersected high-grade gold and ended in mineralisation.
- First RC hole at 8 Mile discovers high-grade gold and ends in mineralisation
- 8 Mile gold mineralisation extends 75m north of tenement boundary
The 8 Mile target is located within the Gidji JV Project (“Gidji” or “the Project”), approximately 15 kilometres north of Kalgoorlie and surrounded by multiple gold mining and processing operations, including Northern Star Resources Limited’s (“NST”) Kalgoorlie gold operations (Figure 1).
The 8 Mile Target is located immediately adjacent to NST’s “8-Mile Dam” gold deposit which, according to the most recent publicly available data, contains an estimated 7Mt @ 1.4g/t Au for 313,977 ounces1.
A limited number of fast-tracked results from the first RC hole, GJRC029, show a wide zone of gold mineralisation with a similar tenor to 8 Mile Dam (18m @ 0.94g/t Au from 480m including 1m @ 6.04g/t Au), approximately 75m north of the tenement boundary, and ended in mineralisation (3m @ 0.52g/t Au).
The Company is awaiting assay results from the remainder of the hole which are expected in 2-3 weeks.
Miramar’s Executive Chairman, Mr Allan Kelly, said the Company was excited to see gold mineralisation continuing onto Miramar’s ground for a significant distance.
“This is the first time we have discovered significant gold mineralisation on our side of the fence, even though the drill hole didn’t end up exactly where we planned it to. The flip side of this is that we have extended the strike of gold mineralisation for over 100m on to our tenements,” he said.
“We’ve also demonstrated a relationship between the IP anomalism and gold mineralisation, which makes the other IP anomalies we have outlined at Gidji even more prospective,” he said.
Figure 1. The Gidji JV Project and 8-Mile Dam in relation to Kalgoorlie and surrounding deposits.
GJRC029 aimed to test an Induced Polarisation (IP) anomaly on the tenement boundary interpreted to represent the sulphide-rich gold mineralisation seen at the neighbouring 8 Mile Dam Deposit.
GJRC029 was collared approximately 10m north of the tenement boundary and mirrored MPGD008, a diamond hole drilled down-dip approximately 40m south of the tenement boundary by KCGM in 2013 and which intersected significant gold mineralisation related to the 8 Mile mafic unit.
Unfortunately, GJRC029 deviated significantly from the planned azimuth and, as a result, by the time the hole was terminated at the target depth of 504m, the drill trace ended up approximately 75m north of the tenement boundary (Figure 2). Despite this, the hole intersected a thick section of the steep westerly- dipping and highly altered 8 Mile mafic unit with widespread sulphide mineralisation, including disseminated magnetite and coarse-grained arsenopyrite, pyrrhotite and chalcopyrite, similar to the 8 Mile Dam Deposit (Figure 3).
Based on visual logging of RC drill chips, handheld portable XRF results and magnetic susceptibility measurements, samples from the bottom 56m of the hole were sent for priority analysis by fire assay at Bureau Veritas in Kalgoorlie.
The results from these initial samples confirm the relationship between the gold mineralisation and sulphides, and a relationship between the best gold mineralisation and coincident magnetic anomalism and elevated Arsenic as measured by handheld portable XRF. The first results also confirm that the IP anomaly is associated with potentially significant gold mineralisation, whilst the significant deviation of GJRC029 away from the planned target increases the potential strike length of gold mineralisation on Miramar’s ground.
Significant results are listed in Table 1, with assay results from the remainder of the hole expected in coming weeks.
The initial RC drilling programme, which also tested two other IP targets, is nearing completion and results will be reported once received and compiled.
Once all assays are received, the Company will plan further RC and/or diamond drill holes including to test the dip and strike extent of the mineralisation intersected in GJRC029.
The Company advises that the WA Department of Mines, Petroleum and Exploration (DMPE) has extended the main Gidji JV tenement, E26/214, for a further five years, and will now expire in March 2030.
Click here for the full ASX Release
This article includes content from Miramar Resources Limited, licensed for the purpose of publishing on Investing News Australia. This article does not constitute financial product advice. It is your responsibility to perform proper due diligence before acting upon any information provided here. Please refer to our full disclaimer here.
Keep reading...Show less
17 July
Rob McEwen: Gold to Go "Much Higher," Mining Stock Mania Not Here Yet
Rob McEwen, chairman and chief owner of McEwen Inc. (TSX:MUX,NYSE:MUX), outlines his gold price outlook as well as future plans for his company.
"If I look at history and the cycles gold has gone through, we have all the ingredients needed to drive it much higher," he told the Investing News Network.
Don't forget to follow us @INN_Resource for real-time updates!
Securities Disclosure: I, Charlotte McLeod, hold no direct investment interest in any company mentioned in this article.
Keep reading...Show less
Latest News
Latest Press Releases
Related News
TOP STOCKS
American Battery4.030.24
Aion Therapeutic0.10-0.01
Cybin Corp2.140.00