
October 28, 2024
Ora Gold Limited (ASX: OAU, “Ora” or the “Company”) is pleased to report assay results from infill RC drilling at the Crown Prince Project (M51/886) part of Ora’s broader Garden Gully tenure (Figure 1).
Highlights
- Ora has received assays for a 7,500m, 66-hole infill RC drilling program at Crown Prince. This drilling was undertaken to better define mineralised lodes within the south eastern zone (SEZ) deposit to upgrade resource categories within a future conceptual open pit area.
- This drilling has returned some exceptional grades and intercepts including:
- 20m at 277g/t Au from 40m including 4m at 1,368g/t Au from 52m (OGGRC859)
- 15m at 14.7g/t Au from 152m (OGGRC872)
- 9m at 21.44g/t Au from 28m including 2m at 77.8g/t Au from 31m (OGGRC883)
- 7m at 11.74g/t Au from 132m (OGGRC874)
- 11m at 6.72g/t Au from 4m (OGGRC886)
- 12m at 6.05g/t Au from 76m including 4m at 10.2g/t Au from 80m (OGGRC895)
- 9m at 6.27g/ t Au from 66m including 1m at 18.6g/t Au from 66m (OGGRC888)
- 7m at 6.87g/ t Au from 133m (OGGRC864)
- New very high-grade zones have been encountered in the footwall of SEZ lodes which will likely improve grade and tonnage estimates in this area.
- This infill drilling has generally confirmed gold mineralisation modelling and has upgraded the quality in many areas.
Ora is continuing to progress Crown Prince towards development, targeting production commencement mid calendar year 2025. Among the several workstreams underway, including regulatory approvals, the Company has completed infill drilling ahead of releasing an ore reserve.
The program was designed to target zones of mineralisation within a conceptual pit design at Crown Prince that are currently in the inferred category of mineral resource (refer ASX release 20 February 2024). This drilling successfully confirmed mineralised zones and improved gold grades in some key areas.
Other improvements from this infill drilling include delineation of new near surface high grade zones and parallel lodes in new positions in the footwall and hanging wall of the south eastern zone (SEZ) mineralisation.
These zones are within the conceptual open pit for the Crown Prince deposit and are expected to add to the mineral resource and future mining inventory. Importantly, the grades returned in this infill drilling support existing published grades and may provide a foundation for an uplift in the average grade overall for the resource.
Assay results discussed in this announcement are shown in Appendix 1 & Figures 2-5. RC hole details are included in Table 1.
Alex Passmore Ora Gold’s CEO commented:
“We are very pleased to report these exceptionally high-grade results returned from recent infill drilling. The infill drilling was carried out successfully and has confirmed or improved the mineralisation model we have for Crown Prince.
Such high-grade headline results demonstrate the high quality nature of the Crown Prince Project and point to its likely strong economics during development and production.
We look forward to providing further information on the updated resource estimate in coming weeks and then to follow up with an ore reserve as work progresses.”
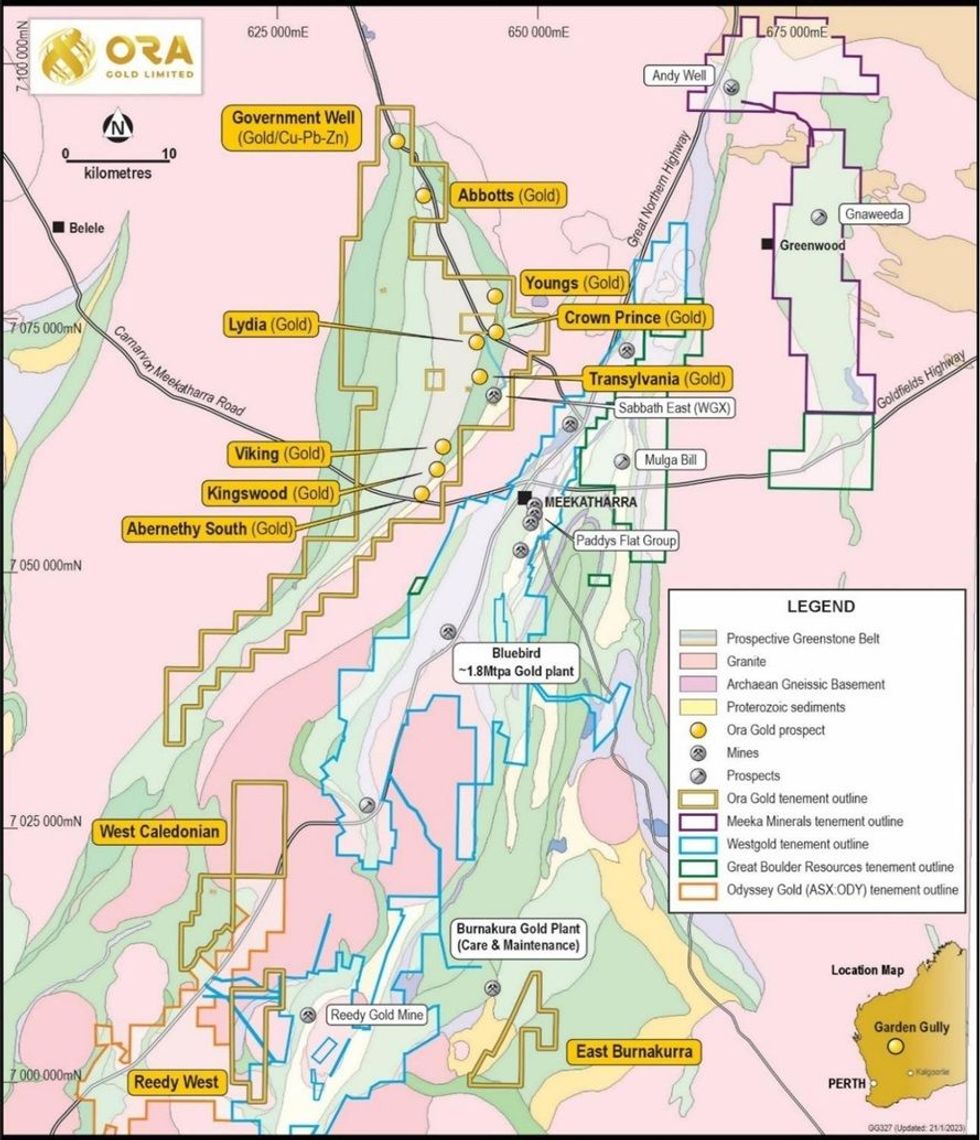
Figure 1. Ora Gold Regional Tenements - Crown Prince located 21km north of Meekatharra
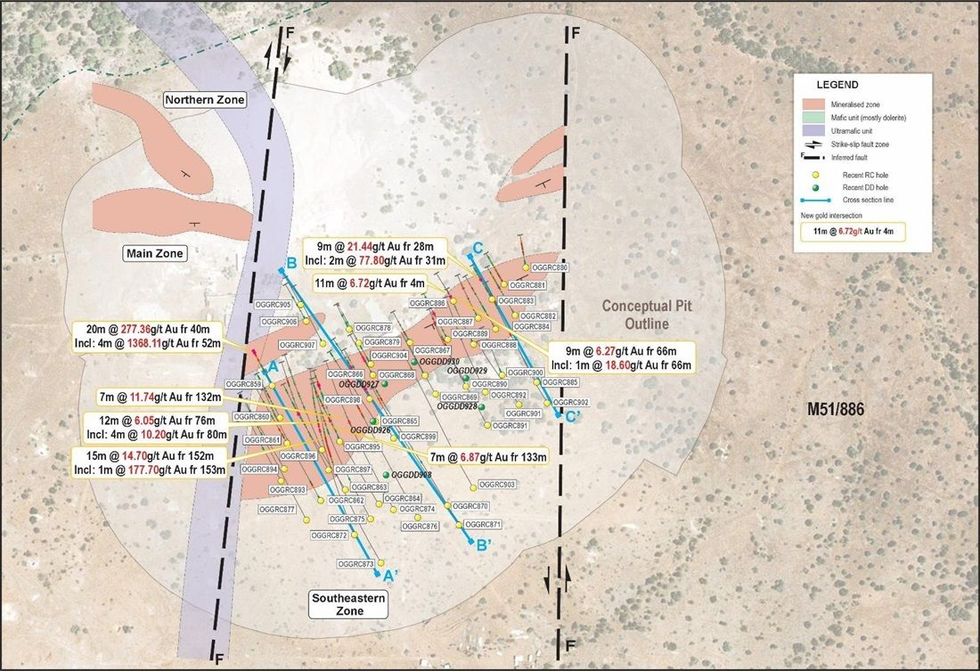
Figure 2. Significant gold intercepts from recent infill RC holes at Crown Prince
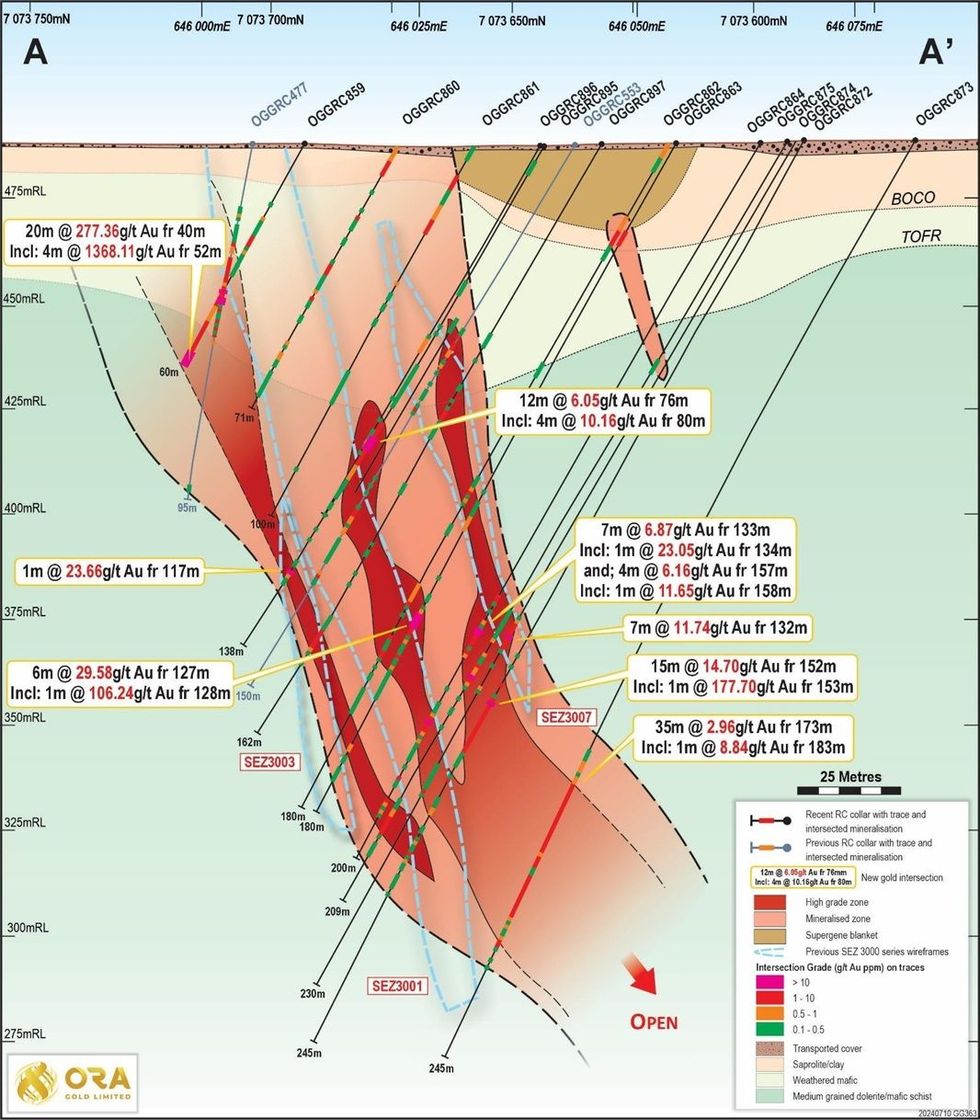
Figure 3. Cross Section A-A’ at the western end of SEZ Mineralisation
Cross Section A-A’
Infill drilling at SEZ has confirmed new FW and HW lodes outside the current mineralisation wireframes, with outstanding high-grade intercepts Including: 20m @ 277.36g/t Au from 40m (incl: 4m @1368.11 g/t Au from 52m) in OGGRC859 and 35m @ 2.96 g/t Au from 173m In OGGRC873.
Extensions to the current mineralisation model along section A-A have been confirmed by intercepts in OGGRC862, 875 and 872 which include 7m @ 6.87 g/t Au from 133m in OGGRC864 and 15m @ 14.7 g/t Au from 152m (incl: 1m @ 177 Au from 153m).
New high-grade intercepts in OGGRC859, along with previous intercepts in OGGRC477 have highlighted additional mineralised zones close to surface in the footwall, which fall outside existing mineralisation wireframes.
OGGRC873 has strengthened the current interpretation that the high-grade shoots at the southwestern end remain wide and continuous at depth.
The SEZ host geology consists of a series of coarse-grained amphibole dolerites and minor high Mg basalts which grade into an intensely sheared unit proximal to mineralisation. Gold is associated with classic, extensional mesothermal style quartz lodes with characteristic Fe carbonate +/- fuchsite alteration, with high grade zones occurring with sulphide laminations and microstructures that crosscut the early-stage white buck veins.
Recent infill drilling has confirmed that the mineralisation system remains high grade down dip, highlighting potential for future underground mining.
Click here for the full ASX Release
This article includes content from Ora Gold, licensed for the purpose of publishing on Investing News Australia. This article does not constitute financial product advice. It is your responsibility to perform proper due diligence before acting upon any information provided here. Please refer to our full disclaimer here.
OAU:AU
The Conversation (0)
8h
Editor's Picks: Gold Tariff Threat Ends, Price Reacts to Fresh Inflation Data
The gold price cooled off this week as tariff-related uncertainty reached a resolution.
The yellow metal was thrust into headlines late last week when US Customs and Border Protection told a Swiss refiner that 1 kilogram and 100 ounce gold bars would be subject to Trump administration tariffs that went into effect on August 7.
Gold is one of Switzerland's top exports to the US, and with the country facing a 39 percent levy, questions were rife about what the impact could be. Clarification came on Monday (August 11), when US President Donald Trump said on Truth Social that gold "will not be tariffed."
While the news calmed market participants, Keith Weiner of Monetary Metals believes the incident could have long-term impacts. He said the tariff confusion caused the spread between spot gold and gold futures to blow out, creating difficulties for entities using the market to hedge.
Here's how Weiner explained it:
"Once you've put the scare into everybody, you can't just say, 'Oh, sorry, just kidding.' You can't really do that. And so now we've done damage, and we'll see what happens to that spread over time. We'll see how users of the futures market adapt.
"There are other markets in the world that would be competing for this hedging business — maybe it moves to Singapore, maybe it moves to Dubai, maybe it moves to London, and the US loses not only a little more trust, but also a little bit of volume on what had been the biggest, or what is currently the biggest, futures market."
This week also brought the release of US consumer price index (CPI) and producer price index (PPI) data. On a seasonally adjusted basis, CPI for July was up 0.2 percent from the previous month and 2.7 percent from the year-ago period. Meanwhile, core CPI, which excludes the food and energy categories, was up 0.3 percent month-on-month and 3.1 percent from the same time last year.
While those numbers were largely in line with expectations, seasonally adjusted July PPI figures came in hotter than expected, rising 0.9 percent month-on-month compared to Dow Jones' forecast of 0.2 percent. Core PPI increased 0.9 percent from June compared to an estimated rise of just 0.3 percent.
Speaking about the implications of the data, Danielle DiMartino Booth of QI Research said it shows companies aren't yet passing tariff-related price increases on to consumers.
This is what she said about how these circumstances could develop:
"I do think that we will see where companies feel they can push through price increases — I think we'll see that. We saw quite a bit of food inflation in the PPI, and when you're talking about things like essentials, and especially with very, very low-margin types of sales, we could see what we call the substitution effect begin, where households end up buying other things. The classic is always that they trade down from steak to ground beef, or trade down from beef to chicken.
"We're going to see whether or not that plays out again."
While the PPI data has slightly dampened expectations that the US Federal Reserve will cut interest rates when it meets in September, CME Group's (NASDAQ:CME) FedWatch tool still shows a strong probability of a reduction at that time.
Bullet briefing — CATL closes mine, Mitsubishi invests in copper
CATL temporarily closes lithium mine
Contemporary Amperex Technology (HKEX:3750,SZSE:300750), better known as CATL, said on Sunday (August 10) that it will halt production at a lithium mine in China for at least three months.
Sources familiar with the matter told Bloomberg that CATL, which is the world's largest electric vehicle battery maker, failed to extend a key mining permit. The company is reportedly in talks about a renewal, but is prepared for a months-long shutdown.
Share prices of lithium miners rose on the news, buoyed by expectations that the CATL mine closure will help reduce oversupply. Excess output has caused Chinese lithium prices to drop 80 percent since the end of 2022, and investors are keen to see a turnaround for the beleaguered battery metal.
Hudbay, Mitsubishi team up on copper
Mitsubishi (TSE:8058) is set to acquire a 30 percent stake in Hudbay Minerals' (TSX:HBM,NYSE:HBM) Arizona-based Copper World subsidiary for US$600 million.
Hudbay called Mitsubishi its "strategic partner of choice," while Mitsubishi said the investment will help advance its copper growth plans. A feasibility study is in the works for Copper World, and a definitive feasibility study is expected in mid-2026.
Hudbay shareholders reacted positively to the news, which comes on the back of a strong focus on copper supply after last month's announcement of a 50 percent tariff on US imports of semi-finished copper products and intensive copper derivative products. The company projects that Copper World will result in a direct $1.5 billion investment into the US critical minerals supply chain.
Want more YouTube content? Check out our expert market commentary playlist, which features interviews with key figures in the resource space. If there's someone you'd like to see us interview, please send an email to cmcleod@investingnews.com.
And don't forget to follow us @INN_Resource for real-time updates!
Securities Disclosure: I, Charlotte McLeod, hold no direct investment interest in any company mentioned in this article.
Editorial Disclosure: The Investing News Network does not guarantee the accuracy or thoroughness of the information reported in the interviews it conducts. The opinions expressed in these interviews do not reflect the opinions of the Investing News Network and do not constitute investment advice. All readers are encouraged to perform their own due diligence.
Keep reading...Show less
13h
OPINION — Goldenomics 103: Gold Protects and Performs
This opinion piece was submitted to the Investing News Network (INN) by Darren Brady Nelson, who is an external contributor. INN believes it may be of interest to readers and has copy edited the material to ensure adherence to the company’s style guide; however, INN does not guarantee the accuracy or thoroughness of the information reported by external contributors. The opinions expressed by external contributors do not reflect the opinions of INN and do not constitute investment advice. All readers are encouraged to perform their own due diligence.
By Darren Brady Nelson
US President Donald Trump’s “Liberation Day” tariffs certainly caused quite the stir in the markets on April 2.
Gold dropped about 6 percent, and silver 12 percent. A week later, a pause was announced, which ended on August 1. Gold and silver have since risen approximately 11 percent and 24 percent, respectively.
Six month gold and silver price performance.
Source: Trading Economics (gold) and (silver).
Unless you are a professional, or even amateur, trader, it is best to look at gold and silver investment with a perspective of years or decades, rather than just days, weeks or even months. Since the start of the COVID-19 panic in March 2020, gold and silver have exploded 123 percent and 192 percent.
10 year gold and silver price performance.
Source: Trading Economics (gold) and (silver).
In the shorter term, the gold price is driven by what economist John Maynard Keynes called “animal spirits.” In the longer term, it is driven by “monetary spirits.” And not just as protection, but also for performance. The Presidential Gold Guide highlights both in chapters four and five.
Source: Fisher Liberty Gold.
Gold unsurprisingly protects
Economist and investor Mark Skousen has wisely noted that: “Since we left the gold standard in 1971, both gold and silver have become superior inflation hedges.” Gold has more than countered the results of inflation, as measured by CPI, and the drivers of inflation, as measured by M3.
And the numbers back that up. The Gold Protects chart below compares the gold price, CPI and M3 in terms of cumulative growth of each from 1971 to 2025. That is throughout the whole era of gold as an investment, which officially started in 1974 once private ownership was restored.
During this era, gold grew by 541 percent, CPI by 214 percent and M3 by 384 percent. Annual average growth for gold was 10 percent, CPI at 4 percent and M3 at 7 percent. Maximums were 92 percent, 14 percent and 29 percent, respectively. CPI only failed to grow twice, ie. 0 percent in 2009 and 2015. M3 decreased twice, by -4 percent in 2023 and -6 percent in 2024.
Gold surprisingly performs
The highly respected In Gold We Trust (IGWT) report states: “When dealing with the specific level of gold allocation, it is advisable to differentiate between safe-haven gold and performance gold. The Big Long strategy emphasizes the potential of performance gold in the coming years.”
IGWT thus recommends an investment portfolio "rule of thumb" that includes 15 percent in “safe-haven gold” and 10 percent in “performance gold.” The Gold Performs chart below compares gold price, S&P 500 and nominal GDP in terms of cumulative growth of each from 1971 to 2025.
Gold grew by 541 percent, the S&P 500 by 484 percent and GDP by 339 percent. Annual average growth for gold was 10 percent, with the S&P 500 at 9 percent and GDP at 6 percent. Maximums were 92 percent, 45 percent and 14 percent, respectively. Gold did have a higher standard deviation of 27 percent, compared to 17 percent for the S&P 500 and 3 percent for GDP.
Animal and monetary spirits
Gold protects as a hedge or safe haven, not just from inflation, but from the flip side of that same coin of the boom-bust cycle. Both are driven, in the longer term, not by “animal spirits,” but by “monetary spirits.”
Inflation is when money inflation has a widespread impact as price inflation. A bubble is when money increases have a more concentrated impact such as in certain asset values. The bubble eventually bursts when “monetary spirits” are finally reined in by monetary realities.
I say “monetary spirits” because of the role of fiat money, as indicated by, say, M3. When money supply outstrips money demand in a localized way, then that is a bubble, and when in a general way, that is inflation.
The former shows up in certain asset, wholesale and/or producer prices, whilst the latter shows up in CPI. Asset prices include the S&P 500. But nominal GDP is also "ginned up" as it is ultimately a price times quantity measure as well. Price is expressed in money terms.
Conclusion
Gold can have ups and downs, as standard deviation indicates, due to the “animal spirits” of fear and uncertainty, that tend to be daily, weekly or monthly. Yet gold both protects and performs due to the “monetary spirits” of inflation and boom-bust, which tend to be decennially.
In particular, gold performs when the S&P 500 does not, like in the aftermaths of the 2001/2002 dot-com collapse, the 2008/2009 global financial crisis and 2020/2021 COVID-19 lockdowns.
Therefore, when it comes to gold, “follow the money” of central bank “money printing” and fractional reserve bank “fountain pen money,” for both superior inflation protection and boom-bust performance.
And besides, Skousen rightly "begged the question" as follows: “Gold and Silver have always had value, never gone to zero. Can you say the same for stocks and bonds?”
About Darren Brady Nelson
Darren Brady Nelson is chief economist with Fisher Liberty Gold and policy advisor to The Heartland Institute. He previously was economic advisor to Australian Senator Malcolm Roberts. He authored the Ten Principles of Regulation and Reform, and the CPI-X approach to budget cuts.
Click here to read Goldenomics 101: Follow the Money, and here to read Goldenomics 102: The Shadow Price of Gold.
Keep reading...Show less
15 August
Horn Island Mining Lease Application Registered
14 August
Brien Lundin: Gold at New US$3,000 Floor, Silver Supply Crunch Coming
Brien Lundin, editor of Gold Newsletter, shares his thoughts on gold and silver prices, as well as what types of stocks he's focusing on in these sectors.
In his view, the precious metals are set up for a new era.
Click here to sign up for the New Orleans Investment Conference, hosted by Lundin.
Don't forget to follow us @INN_Resource for real-time updates!
Securities Disclosure: I, Charlotte McLeod, hold no direct investment interest in any company mentioned in this article.
Affiliate Disclosure: The Investing News Network may earn commission from qualifying purchases or actions made through the links or advertisements on this page.
Keep reading...Show less
14 August
Gold Majors Ride Price Surge to Strong Q2 Earnings
The world’s top gold producers delivered a string of robust second-quarter results, buoyed by record prices and resilient operations as investors continue to seek refuge in the yellow metal amid growing economic uncertainty.
With spot gold trading above US$3,400 per troy ounce, just shy of its April all-time high of US$3,448.50, the world’s largest gold producers posted higher earnings and stronger cash flow in their recent Q2 results.
Below is a breakdown of how a few major players fared in Q2.
Barrick nearly doubles profit margins
Barrick Mining (TSX:ABX,NYSE:B) formerly Barrick Gold, reported a 97 percent year-on-year jump in net income to US$1.25 billion for the quarter, compared to US$634 million a year earlier.
Earnings per share rose to US$0.47 while operating cash flow in the first half reached US$2.5 billion, up 32 percent from 2024. Free cash flow more than doubled to US$770 million, supported by higher commodity prices.
Gold production climbed 5 percent from the first quarter, while copper output surged 34 percent, led by strong performance at Zambia’s Lumwana mine. Nevada Gold Mines boosted output by 11 percent, while Pueblo Viejo in the Dominican Republic posted a 28 percent increase as expansion work in the site advanced.
“From the ramp-up at Goldrush to the progress at Pueblo Viejo, Lumwana and Reko Diq, not to mention the transformational potential of Fourmile, we’re demonstrating the strength and depth of our portfolio,” president and chief executive Mark Bristow said in the recent Q2 report.
The company also recently agreed to sell its Alturas Project in Chile to a Boroo subsidiary for US$50 million upfront plus a royalty, with proceeds earmarked for funding future ventures
Kinross outpaces gold price gains
Kinross Gold Corporation (TSX:K,NYSE:KGC) posted record attributable free cash flow of US$646.6 million in the second quarter, alongside operating cash flow of US$992.4 million. Adjusted net earnings jumped to US$541 million from US$174.7 million a year earlier.
Further, the company achieved a 21 percent margin increase from the first quarter, outpacing the 15 percent rise in gold prices over the same period.
“Our portfolio of mines continued to perform well during the quarter contributing to a strong first half of the year and positioning us well to achieve our full-year guidance,” CEO J. Paul Rollinson said.
Kinross said that it expects to produce 2 million gold-equivalent ounces in 2025 at an average production cost of US$1,120 per ounce.
Paracatu in Brazil was the company’s top-producing asset, while Tasiast in Mauritania began mining the Fennec satellite deposit. US-based Bald Mountain also reported higher output at lower costs.
The company also advanced key projects, including its Great Bear exploration program in Ontario, engineering work at Round Mountain Phase X in Nevada, and drilling at the Curlew Basin project in Washington.
Agnico Eagle delivers, shares gain
Agnico Eagle's (TSX:AEM,NYSE:AEM) operational consistency and cost control helped drive a six-day share price rally, culminating in a 10.06 percent gain over the past week.
In the second quarter, the company produced 866,029 ounces of gold, maintaining full-year guidance of 3.3 to 3.5 million ounces. Adjusted earnings per share came in at US$1.94, prompting analysts to raise 2025 profit forecasts by US$0.70 to US$6.94.
Analysts cited the company’s steady performance despite rising unit costs, noting its appeal as a defensive play in the sector. Bank of America raised its price target to US$173 due to rising optimism about the firm’s growth prospects.
Newmont rides sector momentum
Newmont (TSX:NGT,NYSE:NEM) posted higher sales and net income for the quarter while authorizing a new share repurchase program and declaring a quarterly dividend.
The miner also renewed a key lease in Ghana. Shares rose 36 percent over the last quarter, outpacing the US Metals and Mining industry’s 24.1 percent return.
The performance came despite a drop in the company’s gold production. Rather, Newmont underscored the role of shareholder returns and strategic asset moves in supporting investor sentiment. Over the past three years, Newmont has delivered a total shareholder return of 63.75 percent.
Gold outlook: Gold shines during volatility
The sector’s strong quarter unfolded against a favorable macro backdrop.
Gold, which has gained about 30 percent year-to-date, has been buoyed by safe-haven flows. The metal’s latest rally began after spot prices dipped to US$3,311.80 in early August, then climbed back above US$3,418 by the first week of August..
The Federal Reserve cut rates by a full percentage point in late 2024 but has held steady this year, citing the need for more data on how tariffs affect inflation. Lower rates generally enhance gold’s appeal by reducing the opportunity cost of holding non-yielding assets..
Don't forget to follow us @INN_Resource for real-time news updates!
Securities Disclosure: I, Giann Liguid, hold no direct investment interest in any company mentioned in this article.
Keep reading...Show less
Latest News
Latest Press Releases
Related News
TOP STOCKS
American Battery4.030.24
Aion Therapeutic0.10-0.01
Cybin Corp2.140.00