The Conversation (0)

Manuka Resources Limited (ASX: MKR) (“Manuka” or the “Company”) is pleased to release an updated Mineral Resources Estimate for Mt Boppy. The Resource update supports Manuka’s strategy to install a purpose-built gold processing plant at Mt Boppy and recommence on-site gold production from Q4 2024.
Highlights:
Dennis Karp, Manuka’s Executive Chairman, commented:
“The Sonic Drilling Program was critical precursor to the recommencement of the processing of rock dumps and dry tailings at Mt Boppy. The results of this program have been extremely positive allowing us to significantly improve the confidence of our Mt Boppy Resource.
Consequently, Manuka is confident in its strategy to progress the establishment a fit-for- purpose on-site gold processing plant at Mt Boppy in the coming months and in turn free up our Wonawinta process plant, most recently used to process Mt Boppy ore, for future silver production from the existing Wonawinta Silver mine.
The bullish gold and silver markets, combined with the fact that Manuka has two granted mining licenses - both fully permitted for on-site processing - and existing processing infrastructure, translate to a very exciting time for the Company.”
Mt Boppy Resource Statement Summary
The Mineral Resource Estimate at Mt Boppy has been updated subsequent to the completion of a 26 borehole 506m sonic drilling evaluation programme over the Mt Boppy Rock Dumps and Dry Tailings completed in December 2023 (Figure 1).
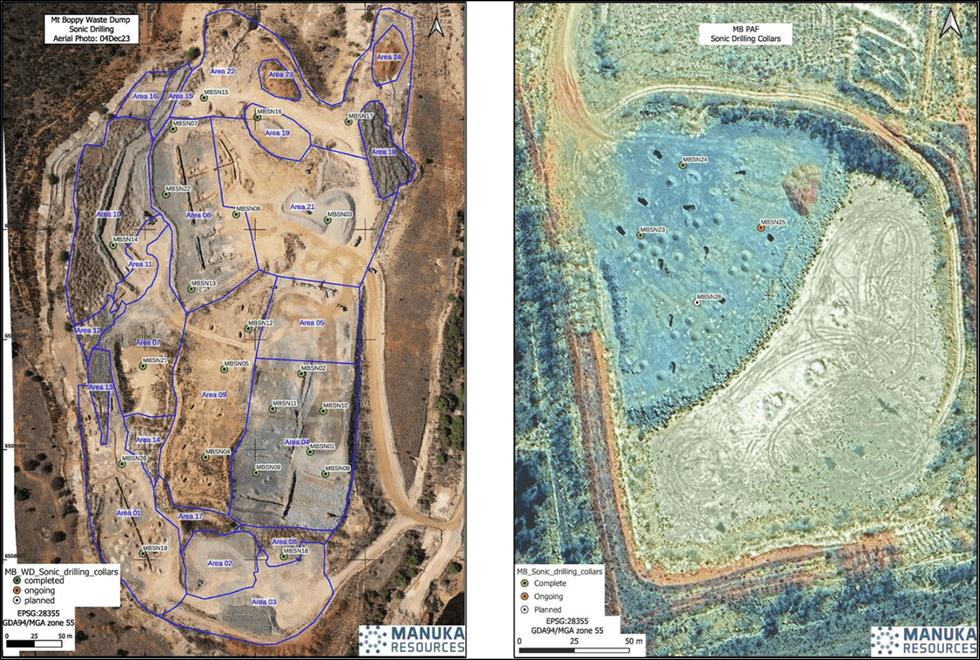 Figure 1: Location Sonic drilling collars over Mt Boppy Rock Dump (left) and TSF3 PAF (right)
The updated Resource comprises 4.28Mt at 1.19g/t Au for 163koz of contained gold of which 82% is contained in the Measured and Indicated categories (Table 1). Importantly, the Resource update sees the ounces classified as Indicated increase by 100% over the previous estimate.
The Resource for Mt Boppy comprises (Table 2):
Rock dumps and tailings depositories, with gold grades derived from recent Sonic drilling to bedrock, and fire assay head grades of +90, -90+20, +10-20, and -10mm size fractions, each weighed to ascertain mass % distribution. The rock dump and tailings Resources are reported at a cutoff of 0.25g/t Au total 3.9Mt tonnes at a grade of 0.89g/t Au for 110,628oz Au.
In-situ hard rock Resources including:
The incremental change to the overall Mt Boppy Resource relates to updates to Rock dumps and Tailings depositories. The combined Mt Boppy Open Cut and Boppy South Resource of 282kt at a grade of 4.95 g/t Au for 44,820 ounces gold remain unchanged from that previously reported (ASX Release 25 August 2023) and all material assumptions continue to apply.
Click here for the full ASX Release
This article includes content from Manuka Resources Limited, licensed for the purpose of publishing on Investing News Australia. This article does not constitute financial product advice. It is your responsibility to perform proper due diligence before acting upon any information provided here. Please refer to our full disclaimer here.