The Conversation (0)
Solid execution results in mid-single digit revenue growth, driven by broad-based strength across multiple businesses and geographies; Major innovative product approvals; Raises fiscal year guidance
Medtronic plc (NYSE:MDT) today announced financial results for its second quarter of fiscal year 2024 (FY24), which ended October 27, 2023 .
Key Highlights
- Revenue of $8.0 billion increased 5.3% as reported and 5.0% organic
- GAAP diluted earnings per share (EPS) of $0.68 ; non-GAAP diluted EPS of $1.25
- Underlying business fundamentals are strong with broad-based, diversified growth coming from multiple businesses and geographies
- Company increases FY24 organic revenue growth and EPS guidance
- Received U.S. FDA approval for Aurora EV-ICD™ system and Symplicity Spyral™ renal denervation (RDN) system; CE Mark for Evolut™ FX TAVR system, Simplera™ standalone CGM, and PulseSelect™ pulsed field ablation (PFA) system
Financial Results
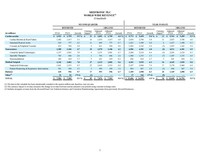
Medtronic reported Q2 worldwide revenue of $7.984 billion , an increase of 5.3% as reported and 5.0% on an organic basis. The company's organic revenue results reflect continued broad strength across businesses and geographies benefiting from durable fundamentals. The organic revenue growth comparison excludes:
- Revenue and the associated impact from foreign currency translation reported as Other, stemming from business separations, including Renal Care Solutions and ongoing manufacturing agreements with Cardinal Health from the divestiture of Patient Care, Deep Vein Thrombosis, and Nutritional Insufficiency; and
- The favorable impact from foreign currency translation of $86 million on the remaining segments.
As reported, Q2 GAAP net income and diluted EPS were $909 million and $0.68 , respectively, both representing increases of 113%. As detailed in the financial schedules included at the end of this release, Q2 non-GAAP net income of $1.667 billion decreased 3% and non-GAAP diluted EPS of $1.25 decreased 4%. Included in non-GAAP diluted EPS was an 8 cent , or 6%, unfavorable impact from foreign currency translation.
"We're delivering a track record of durable, mid-single digit revenue growth. The underlying fundamentals are strong, and our solid results were broad-based across our businesses and geographies," said Geoff Martha , Medtronic chairman and chief executive officer. "We're bringing game changing innovation to market, with numerous recent regulatory approvals and major product launches, which give us confidence in our ability to continue delivering dependable growth."
Cardiovascular Portfolio
The Cardiovascular Portfolio includes the Cardiac Rhythm & Heart Failure (CRHF), Structural Heart & Aortic (SHA), and Coronary & Peripheral Vascular (CPV) divisions. Revenue of $2.923 billion increased 5.9% as reported and 4.8% organic, with a high-single digit organic increase in SHA and mid-single digit organic increases in CRHF and CPV.
- CRHF results driven by high-single digit growth in Cardiac Pacing Therapies, including low-double digit growth in Micra™ transcatheter pacing systems; Cardiovascular Diagnostics grew high-single digits and Cardiac Ablation Solutions grew mid-single digits
- SHA drove high-single digit growth in Aortic and Cardiac Surgery; Structural Heart (TAVR) grew mid-single digits on the continued adoption of Evolut™ FX in the U.S. & Japan
- CPV results driven by mid-single digit growth in Coronary on the continued strength of the Onyx Frontier™ drug-eluting stent and low-single digit growth in Peripheral Vascular Health on mid-teens growth in drug-coated balloons
- Received U.S. FDA approval for Aurora EV-ICD™ system and Symplicity Spyral™ RDN system; CE Mark for Evolut™ FX transcatheter aortic valve implantation system and PulseSelect™ pulsed field ablation (PFA) system
- Presented four-year results from Evolut Low Risk Trial at the 2023 TCT conference showing the Evolut™ TAVR system demonstrated exceptional outcomes with sustained valve performance, proven by significantly better hemodynamics, low thrombosis rates, and lower and diverging rates of all-cause mortality or disabling stroke than surgical aortic valve replacement (SAVR) at four years
Neuroscience Portfolio
The Neuroscience Portfolio includes the Cranial & Spinal Technologies (CST), Specialty Therapies, and Neuromodulation divisions. Revenue of $2.288 billion increased 4.7% as reported and 4.2% organic, with a high-single digit organic increase in CST and low-single digit organic increases in Specialty Therapies and Neuromodulation.
- CST delivered high-single digit Core Spine growth on implant pull-through fueled by continued adoption of the AiBLE™ ecosystem; Neurosurgery grew mid-single digits on strong sales of StealthStation™ navigation and O-arm™ imaging systems
- Specialty Therapies results driven by mid-single digit growth in Neurovascular on strength in flow diversion and low-single digit growth in ENT and Pelvic Health; excluding a product line divestiture, Pelvic Health grew mid-single digits
- Neuromodulation drove mid-single digit growth in Targeted Drug Delivery and low-single digit growth in Pain Stim
Medical Surgical Portfolio
The Medical Surgical Portfolio includes the Surgical & Endoscopy (SE) and the Patient Monitoring & Respiratory Interventions (PMRI) divisions. Revenue of $2.142 billion increased 7.0% as reported and 5.6% organic, with a high-single digit organic increase in SE and low-single digit organic increase in PMRI.
- SE results driven by low-double digit growth in General Surgical Technologies, mid-single digit growth in Advanced Surgical Technologies, and low-double digit growth in Endoscopy
- SE also drove installed base growth of the Hugo™ robotic-assisted surgery (RAS) system; received Investigational Device Exemption (IDE) from U.S. FDA to begin the U.S. clinical trial for Hugo™ RAS system for Hernia procedures
- PMRI results driven by low-single digit growth in Patient Monitoring, with double-digit growth in Nellcor™ pulse oximetry monitor sales; Respiratory Interventions results were flat, with high-single digit growth in Airways offset by decreases in Ventilator sales
Diabetes
Diabetes revenue of $610 million increased 9.7% as reported and 6.7% organic.
- Non-U.S. Developed Markets grew mid-teens on continued MiniMed™ 780G system adoption and increased CGM attachment rates on the strength of the Guardian™ 4 sensor
- First full quarter of the U.S. launch of MiniMed™ 780G system resulted in low-thirties sequential growth in U.S. Diabetes pump revenue; overall, U.S. Diabetes declined mid-single digits year-over-year on customer attrition versus the prior year; customer base increased sequentially
- Received CE Mark and began phased launch for Simplera™ standalone CGM
Guidance
The company today raised its FY24 revenue growth and EPS guidance.
The company increased its FY24 organic revenue growth guidance to 4.75% versus the prior 4.5%. The organic revenue growth guidance excludes the impact of foreign currency and revenue related to certain businesses reported as Other. Including Other revenue and the impact of foreign currency, if foreign currency exchange rates as of the beginning of November hold, FY24 revenue growth on a reported basis would be approximately 2.6%.
The company increased its FY24 diluted non-GAAP EPS guidance from the prior range of $5.08 to $5.16 to the new range of $5.13 to $5.19 , a 4 cent increase at the midpoint. Given the change in foreign currency exchange rates over the past quarter, the foreign exchange impact on FY24 diluted non-GAAP EPS is now estimated to be 2 cents more unfavorable in the second half and is estimated to be a 6% unfavorable impact for the full year.
"Overall, it was another good quarter as we delivered revenue, margins, and earnings ahead of expectations. Combining our second quarter outperformance with our updated tax and foreign currency estimates, we're raising our full year organic revenue growth and EPS guidance," said Karen Parkhill , Medtronic EVP & chief financial officer. "Based on the changes we've made to our operating model, incentives, and capital allocation, among other drivers, we've positioned the company to deliver consistent mid-single digit growth on the top line. As we move ahead, translating this durable revenue growth into durable earnings power remains a top priority."
Video Webcast Information
Medtronic will host a video webcast today, November 21 , at 8:00 a.m. EST ( 7:00 a.m. CST ) to provide information about its businesses for the public, investors, analysts, and news media. This webcast can be accessed by clicking on the Events icon at investorrelations.medtronic.com , and this earnings release will be archived at news.medtronic.com . Within 24 hours of the webcast, a replay of the webcast and transcript of the company's prepared remarks will be available by clicking on the Events icon at investorrelations.medtronic.com .
Medtronic plans to report its FY24 third and fourth quarter results on Tuesday, February 20, 2024 , and Thursday, May 23, 2024 , respectively. Confirmation and additional details will be provided closer to the specific event.
Financial Schedules
The second quarter financial schedules and non-GAAP reconciliations can be viewed by clicking on the Investor Events link at investorrelations.medtronic.com . To view a printable PDF of the financial schedules and non-GAAP reconciliations, click here . To view the second quarter earnings presentation, click here .
| MEDTRONIC PLC | ||||||||||||||||||||||||||||
| WORLD WIDE REVENUE (1) | ||||||||||||||||||||||||||||
| (Unaudited) | ||||||||||||||||||||||||||||
| | ||||||||||||||||||||||||||||
| | SECOND QUARTER | | | YEAR-TO-DATE | ||||||||||||||||||||||||
| | REPORTED | | | | ORGANIC | | | REPORTED | | | | ORGANIC | ||||||||||||||||
| (in millions) | FY24 | | FY23 | | Growth | | Currency | | Adjusted | | Adjusted | | Growth | | | FY24 | | FY23 | | Growth | | Currency | | Adjusted | | Adjusted | | Growth |
| Cardiovascular | $ 2,923 | | $ 2,759 | | 5.9 % | | $ 31 | | $ 2,892 | | $ 2,759 | | 4.8 % | | | $ 5,773 | | $ 5,459 | | 5.8 % | | $ 12 | | $ 5,761 | | $ 5,459 | | 5.5 % |
| Cardiac Rhythm & Heart Failure | 1,492 | | 1,417 | | 5.3 | | 18 | | 1,474 | | 1,417 | | 4.0 | | | 2,938 | | 2,798 | | 5.0 | | 11 | | 2,927 | | 2,798 | | 4.6 |
| Structural Heart & Aortic | 819 | | 757 | | 8.2 | | 11 | | 808 | | 757 | | 6.7 | | | 1,633 | | 1,499 | | 8.9 | | 6 | | 1,627 | | 1,499 | | 8.5 |
| Coronary & Peripheral Vascular | 613 | | 584 | | 5.0 | | 2 | | 611 | | 584 | | 4.6 | | | 1,202 | | 1,163 | | 3.4 | | (5) | | 1,207 | | 1,163 | | 3.8 |
| Neuroscience | 2,288 | | 2,186 | | 4.7 | | 10 | | 2,278 | | 2,186 | | 4.2 | | | 4,506 | | 4,301 | | 4.8 | | (5) | | 4,511 | | 4,301 | | 4.9 |
| Cranial & Spinal Technologies | 1,157 | | 1,081 | | 7.0 | | 4 | | 1,153 | | 1,081 | | 6.7 | | | 2,260 | | 2,124 | | 6.4 | | (3) | | 2,263 | | 2,124 | | 6.5 |
| Specialty Therapies | 705 | | 686 | | 2.8 | | 1 | | 704 | | 686 | | 2.6 | | | 1,400 | | 1,353 | | 3.5 | | (7) | | 1,407 | | 1,353 | | 4.0 |
| Neuromodulation | 426 | | 419 | | 1.7 | | 5 | | 421 | | 419 | | 0.5 | | | 846 | | 824 | | 2.7 | | 5 | | 841 | | 824 | | 2.1 |
| Medical Surgical | 2,142 | | 2,002 | | 7.0 | | 27 | | 2,115 | | 2,002 | | 5.6 | | | 4,181 | | 3,935 | | 6.3 | | 16 | | 4,165 | | 3,935 | | 5.8 |
| Surgical & Endoscopy | 1,641 | | 1,513 | | 8.5 | | 25 | | 1,616 | | 1,513 | | 6.8 | | | 3,187 | | 2,968 | | 7.4 | | 17 | | 3,170 | | 2,968 | | 6.8 |
| Patient Monitoring & Respiratory Interventions | 501 | | 489 | | 2.5 | | 3 | | 498 | | 489 | | 1.8 | | | 994 | | 967 | | 2.8 | | (2) | | 996 | | 967 | | 3.0 |
| Diabetes | 610 | | 556 | | 9.7 | | 17 | | 593 | | 556 | | 6.7 | | | 1,189 | | 1,098 | | 8.3 | | 20 | | 1,169 | | 1,098 | | 6.5 |
| Other (3) | 22 | | 82 | | (73.2) | | (1) | | — | | — | | — | | | 37 | | 162 | | (77.2) | | (5) | | — | | — | | — |
| TOTAL | $ 7,984 | | $ 7,585 | | 5.3 % | | $ 85 | | $ 7,876 | | $ 7,503 | | 5.0 % | | | $ 15,686 | | $ 14,955 | | 4.9 % | | $ 38 | | $ 15,605 | | $ 14,793 | | 5.5 % |
| | |
| (1) | The data in this schedule has been intentionally rounded to the nearest million and, therefore, may not sum. |
| (2) | The currency impact to revenue measures the change in revenue between current and prior year periods using constant exchange rates. |
| (3) | Includes inorganic revenue from the divested Renal Care Solutions business and Transition Manufacturing Agreements from previously divested businesses. |
| MEDTRONIC PLC | ||||||||||||||||||||||||
| U.S. (1)(2) REVENUE | ||||||||||||||||||||||||
| (Unaudited) | ||||||||||||||||||||||||
| | ||||||||||||||||||||||||
| | SECOND QUARTER | | | YEAR-TO-DATE | ||||||||||||||||||||
| | REPORTED | | ORGANIC | | | REPORTED | | ORGANIC | ||||||||||||||||
| (in millions) | FY24 | | FY23 | | Growth | | Adjusted | | Adjusted | | Growth | | | FY24 | | FY23 | | Growth | | Adjusted | | Adjusted | | Growth |
| Cardiovascular | $ 1,427 | | $ 1,410 | | 1.2 % | | $ 1,427 | | $ 1,410 | | 1.2 % | | | $ 2,776 | | $ 2,696 | | 3.0 % | | $ 2,776 | | $ 2,696 | | 3.0 % |
| Cardiac Rhythm & Heart Failure | 782 | | 776 | | 0.8 | | 782 | | 776 | | 0.8 | | | 1,502 | | 1,481 | | 1.4 | | 1,502 | | 1,481 | | 1.4 |
| Structural Heart & Aortic | 367 | | 348 | | 5.5 | | 367 | | 348 | | 5.5 | | | 724 | | 660 | | 9.7 | | 724 | | 660 | | 9.7 |
| Coronary & Peripheral Vascular | 278 | | 286 | | (2.8) | | 278 | | 286 | | (2.8) | | | 550 | | 555 | | (0.9) | | 550 | | 555 | | (0.9) |
| Neuroscience | 1,560 | | 1,512 | | 3.2 | | 1,560 | | 1,512 | | 3.2 | | | 3,057 | | 2,931 | | 4.3 | | 3,057 | | 2,931 | | 4.3 |
| Cranial & Spinal Technologies | 863 | | 817 | | 5.6 | | 863 | | 817 | | 5.6 | | | 1,685 | | 1,580 | | 6.6 | | 1,685 | | 1,580 | | 6.6 |
| Specialty Therapies | 403 | | 403 | | — | | 403 | | 403 | | — | | | 795 | | 784 | | 1.4 | | 795 | | 784 | | 1.4 |
| Neuromodulation | 293 | | 291 | | 0.7 | | 293 | | 291 | | 0.7 | | | 577 | | 567 | | 1.8 | | 577 | | 567 | | 1.8 |
| Medical Surgical | 963 | | 895 | | 7.6 | | 963 | | 895 | | 7.6 | | | 1,845 | | 1,726 | | 6.9 | | 1,845 | | 1,726 | | 6.9 |
| Surgical & Endoscopy | 688 | | 633 | | 8.7 | | 688 | | 633 | | 8.7 | | | 1,308 | | 1,214 | | 7.7 | | 1,308 | | 1,214 | | 7.7 |
| Patient Monitoring & Respiratory Interventions | 275 | | 262 | | 5.0 | | 275 | | 262 | | 5.0 | | | 537 | | 512 | | 4.9 | | 537 | | 512 | | 4.9 |
| Diabetes | 217 | | 228 | | (4.8) | | 217 | | 228 | | (4.8) | | | 405 | | 434 | | (6.7) | | 405 | | 434 | | (6.7) |
| Other (3) | 8 | | 23 | | (65.2) | | — | | — | | — | | | 16 | | 49 | | (67.3) | | — | | — | | — |
| TOTAL | $ 4,175 | | $ 4,069 | | 2.6 % | | $ 4,167 | | $ 4,046 | | 3.0 % | | | $ 8,099 | | $ 7,835 | | 3.4 % | | $ 8,083 | | $ 7,787 | | 3.8 % |
| | |
| (1) | U.S. includes the United States and U.S. territories. |
| (2) | The data in this schedule has been intentionally rounded to the nearest million and, therefore, may not sum. |
| (3) | Includes inorganic revenue from the divested Renal Care Solutions business and Transition Manufacturing Agreements from previously divested businesses. |
| MEDTRONIC PLC | ||||||||||||||||||||||||||||
| WORLD WIDE REVENUE: GEOGRAPHIC (1)(2) | ||||||||||||||||||||||||||||
| (Unaudited) | ||||||||||||||||||||||||||||
| | ||||||||||||||||||||||||||||
| | SECOND QUARTER | | | YEAR-TO-DATE | ||||||||||||||||||||||||
| | REPORTED | | | | ORGANIC | | | REPORTED | | | | ORGANIC | ||||||||||||||||
| (in millions) | FY24 | | FY23 | | Growth | | Currency | | Adjusted | | Adjusted | | Growth | | | FY24 | | FY23 | | Growth | | Currency | | Adjusted | | Adjusted | | Growth |
| U.S. | $ 1,427 | | $ 1,410 | | 1.2 % | | $ — | | $ 1,427 | | $ 1,410 | | 1.2 % | | | $ 2,776 | | $ 2,696 | | 3.0 % | | $ — | | $ 2,776 | | $ 2,696 | | 3.0 % |
| Non-U.S. Developed | 912 | | 802 | | 13.7 | | 43 | | 869 | | 802 | | 8.4 | | | 1,869 | | 1,694 | | 10.3 | | 45 | | 1,824 | | 1,694 | | 7.7 |
| Emerging Markets | 584 | | 546 | | 7.0 | | (12) | | 596 | | 546 | | 9.2 | | | 1,128 | | 1,070 | | 5.4 | | (33) | | 1,161 | | 1,070 | | 8.5 |
| Cardiovascular | 2,923 | | 2,759 | | 5.9 | | 31 | | 2,892 | | 2,759 | | 4.8 | | | 5,773 | | 5,459 | | 5.8 | | 12 | | 5,761 | | 5,459 | | 5.5 |
| U.S. | 1,560 | | 1,512 | | 3.2 | | — | | 1,560 | | 1,512 | | 3.2 | | | 3,057 | | 2,931 | | 4.3 | | — | | 3,057 | | 2,931 | | 4.3 |
| Non-U.S. Developed | 399 | | 382 | | 4.5 | | 14 | | 385 | | 382 | | 0.8 | | | 815 | | 788 | | 3.4 | | 10 | | 805 | | 788 | | 2.2 |
| Emerging Markets | 329 | | 292 | | 12.7 | | (4) | | 333 | | 292 | | 14.0 | | | 634 | | 582 | | 8.9 | | (15) | | 649 | | 582 | | 11.5 |
| Neuroscience | 2,288 | | 2,186 | | 4.7 | | 10 | | 2,278 | | 2,186 | | 4.2 | | | 4,506 | | 4,301 | | 4.8 | | (5) | | 4,511 | | 4,301 | | 4.9 |
| U.S. | 963 | | 895 | | 7.6 | | — | | 963 | | 895 | | 7.6 | | | 1,845 | | 1,726 | | 6.9 | | — | | 1,845 | | 1,726 | | 6.9 |
| Non-U.S. Developed | 740 | | 685 | | 8.0 | | 27 | | 713 | | 685 | | 4.1 | | | 1,512 | | 1,420 | | 6.5 | | 21 | | 1,491 | | 1,420 | | 5.0 |
| Emerging Markets | 438 | | 421 | | 4.0 | | 1 | | 437 | | 421 | | 3.8 | | | 824 | | 789 | | 4.4 | | (5) | | 829 | | 789 | | 5.1 |
| Medical Surgical | 2,142 | | 2,002 | | 7.0 | | 27 | | 2,115 | | 2,002 | | 5.6 | | | 4,181 | | 3,935 | | 6.3 | | 16 | | 4,165 | | 3,935 | | 5.8 |
| U.S. | 217 | | 228 | | (4.8) | | — | | 217 | | 228 | | (4.8) | | | 405 | | 434 | | (6.7) | | — | | 405 | | 434 | | (6.7) |
| Non-U.S. Developed | 310 | | 254 | | 22.0 | | 18 | | 292 | | 254 | | 15.0 | | | 625 | | 518 | | 20.7 | | 22 | | 603 | | 518 | | 16.4 |
| Emerging Markets | 84 | | 74 | | 13.5 | | (1) | | 85 | | 74 | | 14.9 | | | 159 | | 145 | | 9.7 | | (3) | | 162 | | 145 | | 11.7 |
| Diabetes | 610 | | 556 | | 9.7 | | 17 | | 593 | | 556 | | 6.7 | | | 1,189 | | 1,098 | | 8.3 | | 20 | | 1,169 | | 1,098 | | 6.5 |
| U.S. | 8 | | 23 | | (65.2) | | — | | — | | — | | — | | | 16 | | 49 | | (67.3) | | — | | — | | — | | — |
| Non-U.S. Developed | 7 | | 33 | | (78.8) | | (1) | | — | | — | | — | | | 12 | | 65 | | (81.5) | | (2) | | — | | — | | — |
| Emerging Markets | 7 | | 25 | | (72.0) | | (1) | | — | | — | | — | | | 10 | | 48 | | (79.2) | | (2) | | — | | — | | — |
| Other (4) | 22 | | 82 | | (73.2) | | (1) | | — | | — | | — | | | 37 | | 162 | | (77.2) | | (5) | | — | | — | | — |
| U.S. | 4,175 | | 4,069 | | 2.6 | | — | | 4,167 | | 4,046 | | 3.0 | | | 8,099 | | 7,835 | | 3.4 | | — | | 8,083 | | 7,787 | | 3.8 |
| Non-U.S. Developed | 2,368 | | 2,157 | | 9.8 | | 101 | | 2,259 | | 2,123 | | 6.4 | | | 4,831 | | 4,485 | | 7.7 | | 96 | | 4,722 | | 4,420 | | 6.8 |
| Emerging Markets | 1,441 | | 1,359 | | 6.0 | | (17) | | 1,451 | | 1,334 | | 8.8 | | | 2,755 | | 2,635 | | 4.6 | | (57) | | 2,800 | | 2,586 | | 8.3 |
| TOTAL | $ 7,984 | | $ 7,585 | | 5.3 % | | $ 85 | | $ 7,876 | | $ 7,503 | | 5.0 % | | | $ 15,686 | | $ 14,955 | | 4.9 % | | $ 38 | | $ 15,605 | | $ 14,793 | | 5.5 % |
| | |
| (1) | U.S. includes the United States and U.S. territories. Non-U.S. developed markets include Japan, Australia, New Zealand, Korea, Canada, and the countries within Western Europe. Emerging Markets include the countries of the Middle East, Africa, Latin America, Eastern Europe, and the countries of Asia that are not included in the non-U.S. developed markets, as previously defined. |
| (2) | The data in this schedule has been intentionally rounded to the nearest million and, therefore, may not sum. |
| (3) | The currency impact to revenue measures the change in revenue between current and prior year periods using constant exchange rates. |
| (4) | Includes inorganic revenue from the divested Renal Care Solutions business and Transition Manufacturing Agreements from previously divested businesses. |
| MEDTRONIC PLC | |||||||
| CONSOLIDATED STATEMENTS OF INCOME | |||||||
| (Unaudited) | |||||||
| | |||||||
| | Three months ended | | Six months ended | ||||
| (in millions, except per share data) | October 27, | | October 28, | | October 27, | | October 28, |
| Net sales | $ 7,984 | | $ 7,585 | | $ 15,686 | | $ 14,955 |
| Costs and expenses: | | | | | | | |
| Cost of products sold, excluding amortization of intangible assets | 2,761 | | 2,535 | | 5,390 | | 5,051 |
| Research and development expense | 698 | | 676 | | 1,365 | | 1,368 |
| Selling, general, and administrative expense | 2,686 | | 2,617 | | 5,299 | | 5,184 |
| Amortization of intangible assets | 425 | | 421 | | 855 | | 844 |
| Restructuring charges, net | 40 | | 30 | | 94 | | 44 |
| Certain litigation charges | 65 | | — | | 105 | | — |
| Other operating income, net | (31) | | (97) | | (30) | | (62) |
| Operating profit | 1,340 | | 1,404 | | 2,608 | | 2,528 |
| Other non-operating income, net | (154) | | (109) | | (230) | | (192) |
| Interest expense, net | 180 | | 118 | | 329 | | 282 |
| Income before income taxes | 1,313 | | 1,395 | | 2,510 | | 2,438 |
| Income tax provision | 402 | | 959 | | 802 | | 1,072 |
| Net income | 911 | | 435 | | 1,708 | | 1,367 |
| Net income attributable to noncontrolling interests | (2) | | (8) | | (8) | | (10) |
| Net income attributable to Medtronic | $ 909 | | $ 427 | | $ 1,700 | | $ 1,356 |
| Basic earnings per share | $ 0.68 | | $ 0.32 | | $ 1.28 | | $ 1.02 |
| Diluted earnings per share | $ 0.68 | | $ 0.32 | | $ 1.28 | | $ 1.02 |
| Basic weighted average shares outstanding | 1,330.2 | | 1,329.4 | | 1,330.3 | | 1,329.4 |
| Diluted weighted average shares outstanding | 1,331.9 | | 1,332.0 | | 1,332.8 | | 1,333.3 |
| |
| The data in the schedule above has been intentionally rounded to the nearest million, and therefore, the quarterly amounts may not sum to the fiscal year-to-date amounts. |
| MEDTRONIC PLC | |||||||||||||||||
| GAAP TO NON-GAAP RECONCILIATIONS (1) | |||||||||||||||||
| (Unaudited) | |||||||||||||||||
| | |||||||||||||||||
| | Three months ended October 27, 2023 | ||||||||||||||||
| (in millions, except per share data) | Net | | Cost of | | Gross | | Operating | | Operating | | Income | | Net Income | | Diluted | | Effective |
| GAAP | $ 7,984 | | $ 2,761 | | 65.4 % | | $ 1,340 | | 16.8 % | | $ 1,313 | | $ 909 | | $ 0.68 | | 30.6 % |
| Non-GAAP Adjustments: | | | | | | | | | | | | | | | | | |
| Amortization of intangible assets | — | | — | | — | | 425 | | 5.3 | | 425 | | 360 | | 0.27 | | 15.3 |
| Restructuring and associated costs (2) | — | | (15) | | 0.2 | | 91 | | 1.1 | | 91 | | 76 | | 0.06 | | 17.6 |
| Acquisition and divestiture-related items (3) | — | | (6) | | 0.1 | | 58 | | 0.7 | | 58 | | 51 | | 0.04 | | 12.1 |
| Certain litigation charges | — | | — | | — | | 65 | | 0.8 | | 65 | | 50 | | 0.04 | | 23.1 |
| (Gain)/loss on minority investments (4) | — | | — | | — | | — | | — | | 25 | | 21 | | 0.02 | | 20.0 |
| Medical device regulations (5) | — | | (21) | | 0.3 | | 30 | | 0.4 | | 30 | | 24 | | 0.02 | | 20.0 |
| Certain tax adjustments, net (6) | — | | — | | — | | — | | — | | — | | 176 | | 0.13 | | — |
| Non-GAAP | $ 7,984 | | $ 2,720 | | 65.9 % | | $ 2,009 | | 25.2 % | | $ 2,008 | | $ 1,667 | | $ 1.25 | | 16.9 % |
| Currency impact | (85) | | (65) | | 0.5 | | 121 | | 1.8 | | | | | | 0.08 | | |
| Currency Adjusted | $ 7,899 | | $ 2,655 | | 66.4 % | | $ 2,130 | | 27.0 % | | | | | | $ 1.33 | | |
| | | | | | | | | | | | | | | | | | |
| | Three months ended October 28, 2022 | ||||||||||||||||
| (in millions, except per share data) | Net | | Cost of | | Gross | | Operating | | Operating | | Income | | Net Income | | Diluted | | Effective |
| GAAP | $ 7,585 | | $ 2,535 | | 66.6 % | | $ 1,404 | | 18.5 % | | $ 1,395 | | $ 427 | | $ 0.32 | | 68.7 % |
| Non-GAAP Adjustments: | | | | | | | | | | | | | | | | | |
| Amortization of intangible assets | — | | — | | — | | 421 | | 5.6 | | 421 | | 356 | | 0.27 | | 15.4 |
| Restructuring and associated costs (2) | — | | (21) | | 0.3 | | 95 | | 1.3 | | 95 | | 76 | | 0.06 | | 20.0 |
| Acquisition and divestiture-related items (3) | — | | (39) | | 0.5 | | 63 | | 0.8 | | 63 | | 55 | | 0.05 | | 404.2 |
| (Gain)/loss on minority investments (4) | — | | — | | — | | — | | — | | (11) | | (11) | | (0.01) | | — |
| Medical device regulations (5) | — | | (22) | | 0.3 | | 37 | | 0.5 | | 37 | | 30 | | 0.02 | | 18.9 |
| Certain tax adjustments, net (7) | — | | — | | — | | — | | — | | — | | 793 | | 0.60 | | — |
| Non-GAAP | $ 7,585 | | $ 2,454 | | 67.6 % | | $ 2,020 | | 26.6 % | | $ 1,999 | | $ 1,725 | | $ 1.30 | | 13.3 % |
| | |
| See description of non-GAAP financial measures contained in the press release dated November 21, 2023. | |
| (1) | The data in this schedule has been intentionally rounded to the nearest million or $0.01 for EPS figures, and, therefore, may not sum. |
| (2) | Associated costs include costs incurred as a direct result of the restructuring program, such as salaries for employees supporting the program, consulting expenses, and asset write-offs. |
| (3) | The charges primarily include business combination costs, changes in fair value of contingent consideration, and charges related to the impending separation of the Patient Monitoring and Respiratory Interventions businesses within our Medical Surgical Portfolio. |
| (4) | We exclude unrealized and realized gains and losses on our minority investments as we do not believe that these components of income or expense have a direct correlation to our ongoing or future business operations. |
| (5) | The charges represent incremental costs of complying with the new European Union (E.U.) medical device regulations for previously registered products and primarily include charges for contractors supporting the project and other direct third-party expenses. We consider these costs to be duplicative of previously incurred costs and/or one-time costs, which are limited to a specific time period. |
| (6) | The charge primarily relates to the establishment of a valuation allowance against certain net operating losses, and a withholding tax cost related to the impending separation of the Patient Monitoring and Respiratory Interventions businesses within our Medical Surgical Portfolio. |
| (7) | The charge primarily relates to a $764 million reserve adjustment that was a direct result of the U.S. Tax Court opinion, issued on August 18, 2022, on the previously disclosed litigation regarding the allocation of income between Medtronic, Inc. and its wholly owned subsidiary operating in Puerto Rico. |
| MEDTRONIC PLC | |||||||||||||||||
| GAAP TO NON-GAAP RECONCILIATIONS (1) | |||||||||||||||||
| (Unaudited) | |||||||||||||||||
| | |||||||||||||||||
| | Six months ended October 27, 2023 | ||||||||||||||||
| (in millions, except per share data) | Net | | Cost of | | Gross | | Operating | | Operating | | Income | | Net Income | | Diluted | | Effective |
| GAAP | $ 15,686 | | $ 5,390 | | 65.6 % | | $ 2,608 | | 16.6 % | | $ 2,510 | | $ 1,700 | | $ 1.28 | | 32.0 % |
| Non-GAAP Adjustments: | | | | | | | | | | | | | | | | | |
| Amortization of intangible assets | — | | — | | — | | 855 | | 5.5 | | 855 | | 724 | | 0.54 | | 15.2 |
| Restructuring and associated costs (2) | — | | (30) | | 0.2 | | 182 | | 1.2 | | 182 | | 152 | | 0.11 | | 16.5 |
| Acquisition and divestiture-related items (3) | — | | (12) | | — | | 107 | | — | | 107 | | 97 | | 0.07 | | 9.3 |
| Certain litigation charges | — | | — | | — | | 105 | | 0.7 | | 105 | | 81 | | 0.06 | | 22.9 |
| (Gain)/loss on minority investments (4) | — | | — | | — | | — | | — | | 89 | | 85 | | 0.06 | | 5.6 |
| Medical device regulations (5) | — | | (42) | | 0.3 | | 62 | | 0.4 | | 62 | | 49 | | 0.04 | | 21.0 |
| Certain tax adjustments, net (6) | — | | — | | — | | — | | — | | — | | 375 | | 0.28 | | — |
| Non-GAAP | $ 15,686 | | $ 5,306 | | 66.2 % | | $ 3,919 | | 25.0 % | | $ 3,910 | | $ 3,262 | | $ 2.45 | | 16.4 % |
| Currency impact | (38) | | (66) | | 0.3 | | 243 | | 1.6 | | | | | | 0.16 | | |
| Currency Adjusted | $ 15,648 | | $ 5,240 | | 66.5 % | | $ 4,162 | | 26.6 % | | | | | | $ 2.61 | | |
| | | | | | | | | | | | | | | | | | |
| | Six month ended October 28, 2022 | ||||||||||||||||
| (in millions, except per share data) | Net | | Cost of | | Gross | | Operating | | Operating | | Income | | Net Income | | Diluted | | Effective |
| GAAP | $ 14,955 | | $ 5,051 | | 66.2 % | | $ 2,528 | | 16.9 % | | $ 2,438 | | $ 1,356 | | $ 1.02 | | 44.0 % |
| Non-GAAP Adjustments: | | | | | | | | | | | | | | | | | |
| Amortization of intangible assets | — | | — | | — | | 844 | | 5.6 | | 844 | | 715 | | 0.54 | | 15.3 |
| Restructuring and associated costs (2) | — | | (41) | | 0.3 | | 171 | | 1.1 | | 171 | | 136 | | 0.10 | | 20.5 |
| Acquisition and divestiture-related items (3) | — | | (50) | | 0.3 | | 174 | | 1.2 | | 174 | | 157 | | 0.12 | | 38.8 |
| (Gain)/loss on minority investments (4) | — | | — | | — | | — | | — | | (15) | | (15) | | (0.01) | | — |
| Medical device regulations (5) | — | | (40) | | 0.3 | | 70 | | 0.5 | | 70 | | 56 | | 0.04 | | 20.0 |
| Debt redemption premium and other charges (7) | — | | — | | — | | — | | — | | 53 | | 42 | | 0.03 | | 20.8 |
| Certain tax adjustments, net (8) | — | | — | | — | | — | | — | | — | | 780 | | 0.59 | | — |
| Non-GAAP | $ 14,955 | | $ 4,921 | | 67.1 % | | $ 3,785 | | 25.3 % | | $ 3,733 | | $ 3,226 | | $ 2.42 | | 13.3 % |
| | |
| See description of non-GAAP financial measures contained in the press release dated November 21, 2023. | |
| (1) | The data in this schedule has been intentionally rounded to the nearest million or $0.01 for EPS figures, and, therefore, may not sum. |
| (2) | Associated costs include costs incurred as a direct result of the restructuring program, such as salaries for employees supporting the program, consulting expenses, and asset write-offs. |
| (3) | The charges primarily include business combination costs, changes in fair value of contingent consideration, and charges related to the impending separation of the Patient Monitoring and Respiratory Interventions businesses within our Medical Surgical Portfolio. The prior year included non-cash pre-tax impairments, primarily related to goodwill and other associated costs, as a result of the April 1, 2023, sale of half of the Company's Renal Care Solutions (RCS) business. |
| (4) | We exclude unrealized and realized gains and losses on our minority investments as we do not believe that these components of income or expense have a direct correlation to our ongoing or future business operations. |
| (5) | The charges represent incremental costs of complying with the new European Union medical device regulations for previously registered products and primarily include charges for contractors supporting the project and other direct third-party expenses. We consider these costs to be duplicative of previously incurred costs and/or one-time costs, which are limited to a specific period. |
| (6) | The charge relates to an income tax reserve adjustment associated with the June 1, 2023, Israeli Central-Lod District Court decision, the establishment of a valuation allowance against certain net operating losses, a withholding tax cost related to the impending separation of the Patient Monitoring and Respiratory Interventions businesses, and amortization of previously established deferred tax assets from intercompany intellectual property transactions. |
| (7) | The charges relate to the early redemption of approximately $2.3 billion of debt and were recorded within interest expense, net within the consolidated statements of income. |
| (8) | The charge primarily relates to a $764 million reserve adjustment that was a direct result of the U.S. Tax Court opinion, issued on August 18, 2022, on the previously disclosed litigation regarding the allocation of income between Medtronic, Inc. and its wholly owned subsidiary operating in Puerto Rico. |
| MEDTRONIC PLC | |||||||||||||||
| GAAP TO NON-GAAP RECONCILIATIONS (1) | |||||||||||||||
| (Unaudited) | |||||||||||||||
| | |||||||||||||||
| | Three months ended October 27, 2023 | ||||||||||||||
| (in millions) | Net Sales | | SG&A | | SG&A | | R&D | | R&D | | Other | | Other | | Other Non- |
| GAAP | $ 7,984 | | $ 2,686 | | 33.6 % | | $ 698 | | 8.7 % | | $ (31) | | (0.4) % | | $ (154) |
| Non-GAAP Adjustments: | | | | | | | | | | | | | | | |
| Restructuring and associated costs (2) | — | | (36) | | (0.5) | | — | | — | | — | | — | | — |
| Acquisition and divestiture-related items (3) | — | | (26) | | (0.3) | | — | | — | | (26) | | (0.3) | | — |
| Medical device regulations (4) | — | | — | | — | | (9) | | (0.1) | | — | | — | | — |
| (Gain)/loss on minority investments (5) | — | | — | | — | | — | | — | | — | | — | | (25) |
| Non-GAAP | $ 7,984 | | $ 2,623 | | 32.9 % | | $ 688 | | 8.6 % | | $ (57) | | (0.7) % | | $ (179) |
| Currency impact | (85) | | (36) | | (0.1) | | (1) | | 0.1 | | (104) | | (1.3) | | 4 |
| Currency Adjusted | $ 7,899 | | $ 2,587 | | 32.8 % | | $ 687 | | 8.7 % | | $ (161) | | (2.0) % | | $ (175) |
| | |||||||||||||||
| | Six months ended October 27, 2023 | ||||||||||||||
| (in millions) | Net Sales | | SG&A | | SG&A | | R&D | | R&D | | Other | | Other Operating | | Other Non- |
| GAAP | $ 15,686 | | $ 5,299 | | 33.8 % | | $ 1,365 | | 8.7 % | | $ (30) | | (0.2) % | | $ (230) |
| Non-GAAP Adjustments: | | | | | | | | | | | | | | | |
| Restructuring and associated costs (2) | — | | (57) | | (0.4) | | — | | — | | 1 | | — | | — |
| Acquisition and divestiture-related items (3) | — | | (42) | | (0.3) | | — | | — | | (53) | | (0.3) | | — |
| Medical device regulations (4) | — | | (1) | | — | | (19) | | (0.1) | | — | | — | | — |
| (Gain)/loss on minority investments (5) | — | | — | | — | | — | | — | | — | | — | | (89) |
| Non-GAAP | $ 15,686 | | $ 5,199 | | 33.1 % | | $ 1,346 | | 8.6 % | | $ (83) | | (0.5) % | | $ (320) |
| Currency impact | (38) | | (31) | | (0.1) | | 2 | | — | | (186) | | (1.2) | | 5 |
| Currency Adjusted | $ 15,648 | | $ 5,168 | | 33.0 % | | $ 1,348 | | 8.6 % | | $ (269) | | (1.7) % | | $ (315) |
| | |
| See description of non-GAAP financial measures contained in the press release dated November 21, 2023. | |
| (1) | The data in this schedule has been intentionally rounded to the nearest million, and, therefore, may not sum. |
| (2) | Associated costs include costs incurred as a direct result of the restructuring program, such as salaries for employees supporting the program, consulting expenses, and asset write-offs. |
| (3) | The charges primarily include business combination costs, changes in fair value of contingent consideration, and charges related to the impending separation of the Patient Monitoring and Respiratory Interventions businesses within our Medical Surgical Portfolio. |
| (4) | The charges represent incremental costs of complying with the new European Union medical device regulations for previously registered products and primarily include charges for contractors supporting the project and other direct third-party expenses. We consider these costs to be duplicative of previously incurred costs and/or one-time costs, which are limited to a specific time period. |
| (5) | We exclude unrealized and realized gains and losses on our minority investments as we do not believe that these components of income or expense have a direct correlation to our ongoing or future business operations. |
| MEDTRONIC PLC | |||
| GAAP TO NON-GAAP RECONCILIATIONS (1) | |||
| (Unaudited) | |||
| | |||
| | Six months ended | ||
| (in millions) | October 27, 2023 | | October 28, 2022 |
| Net cash provided by operating activities | $ 1,536 | | $ 2,005 |
| Additions to property, plant, and equipment | (815) | | (749) |
| Free Cash Flow (2) | $ 721 | | $ 1,256 |
| | |
| See description of non-GAAP financial measures contained in the press release dated November 21, 2023. | |
| (1) | The data in this schedule has been intentionally rounded to the nearest million, and, therefore, may not sum. |
| (2) | Free cash flow represents operating cash flows less property, plant, and equipment additions. |
| MEDTRONIC PLC | ||||
| CONSOLIDATED BALANCE SHEETS | ||||
| (Unaudited) | ||||
| | ||||
| (in millions) | | October 27, 2023 | | April 28, 2023 |
| ASSETS | | | | |
| Current assets: | | | | |
| Cash and cash equivalents | | $ 1,311 | | $ 1,543 |
| Investments | | 6,423 | | 6,416 |
| Accounts receivable, less allowances and credit losses of $177 and $176, respectively | | 5,934 | | 5,998 |
| Inventories, net | | 5,754 | | 5,293 |
| Other current assets | | 2,658 | | 2,425 |
| Total current assets | | 22,081 | | 21,675 |
| Property, plant, and equipment, net | | 5,735 | | 5,569 |
| Goodwill | | 40,821 | | 41,425 |
| Other intangible assets, net | | 14,060 | | 14,844 |
| Tax assets | | 3,428 | | 3,477 |
| Other assets | | 3,962 | | 3,959 |
| Total assets | | $ 90,087 | | $ 90,948 |
| LIABILITIES AND EQUITY | | | | |
| Current liabilities: | | | | |
| Current debt obligations | | $ 1,339 | | $ 20 |
| Accounts payable | | 2,174 | | 2,662 |
| Accrued compensation | | 1,758 | | 1,949 |
| Accrued income taxes | | 1,088 | | 840 |
| Other accrued expenses | | 3,299 | | 3,581 |
| Total current liabilities | | 9,659 | | 9,051 |
| Long-term debt | | 23,741 | | 24,344 |
| Accrued compensation and retirement benefits | | 1,020 | | 1,093 |
| Accrued income taxes | | 1,777 | | 2,360 |
| Deferred tax liabilities | | 686 | | 708 |
| Other liabilities | | 1,556 | | 1,727 |
| Total liabilities | | 38,440 | | 39,283 |
| Commitments and contingencies | | | | |
| Shareholders' equity: | | | | |
| Ordinary shares— par value $0.0001, 2.6 billion shares authorized, | | — | | — |
| Additional paid-in capital | | 24,580 | | 24,590 |
| Retained earnings | | 30,256 | | 30,392 |
| Accumulated other comprehensive loss | | (3,377) | | (3,499) |
| Total shareholders' equity | | 51,460 | | 51,483 |
| Noncontrolling interests | | 187 | | 182 |
| Total equity | | 51,647 | | 51,665 |
| Total liabilities and equity | | $ 90,087 | | $ 90,948 |
| |
| The data in this schedule has been intentionally rounded to the nearest million, and, therefore, may not sum. |
| MEDTRONIC PLC | |||
| CONSOLIDATED STATEMENTS OF CASH FLOWS | |||
| (Unaudited) | |||
| | |||
| | Six months ended | ||
| (in millions) | October 27, 2023 | | October 28, 2022 |
| Operating Activities: | | | |
| Net income | $ 1,708 | | $ 1,367 |
| Adjustments to reconcile net income to net cash provided by operating activities: | | | |
| Depreciation and amortization | 1,344 | | 1,339 |
| Provision for credit losses | 37 | | 41 |
| Deferred income taxes | (36) | | (92) |
| Stock-based compensation | 219 | | 199 |
| Loss on debt extinguishment | — | | 53 |
| Other, net | 182 | | 148 |
| Change in operating assets and liabilities, net of acquisitions and divestitures: | | | |
| Accounts receivable, net | (117) | | (346) |
| Inventories, net | (616) | | (784) |
| Accounts payable and accrued liabilities | (699) | | (14) |
| Other operating assets and liabilities | (486) | | 94 |
| Net cash provided by operating activities | 1,536 | | 2,005 |
| Investing Activities: | | | |
| Acquisitions, net of cash acquired | (22) | | (1,867) |
| Additions to property, plant, and equipment | (815) | | (749) |
| Purchases of investments | (3,403) | | (3,743) |
| Sales and maturities of investments | 3,336 | | 3,609 |
| Other investing activities, net | (59) | | 19 |
| Net cash used in investing activities | (963) | | (2,731) |
| Financing Activities: | | | |
| Change in current debt obligations, net | 1,321 | | 349 |
| Proceeds from short-term borrowings (maturities greater than 90 days) | — | | 2,284 |
| Issuance of long-term debt | — | | 3,430 |
| Payments on long-term debt | — | | (2,311) |
| Dividends to shareholders | (1,836) | | (1,807) |
| Issuance of ordinary shares | 149 | | 153 |
| Repurchase of ordinary shares | (378) | | (477) |
| Other financing activities | 153 | | 443 |
| Net cash (used in) provided by financing activities | (591) | | 2,064 |
| Effect of exchange rate changes on cash and cash equivalents | (214) | | (223) |
| Net change in cash and cash equivalents | (232) | | 1,114 |
| Cash and cash equivalents at beginning of period | 1,543 | | 3,714 |
| Cash and cash equivalents at end of period | $ 1,311 | | $ 4,828 |
| Supplemental Cash Flow Information | | | |
| Cash paid for: | | | |
| Income taxes | $ 1,110 | | $ 821 |
| Interest | 476 | | 234 |
| |
| The data in this schedule has been intentionally rounded to the nearest million, and, therefore, may not sum. |
About Medtronic
Bold thinking. Bolder actions. We are Medtronic. Medtronic plc, headquartered in Dublin, Ireland , is the leading global healthcare technology company that boldly attacks the most challenging health problems facing humanity by searching out and finding solutions. Our Mission — to alleviate pain, restore health, and extend life — unites a global team of 95,000+ passionate people across 150 countries. Our technologies and therapies treat 70 health conditions and include cardiac devices, surgical robotics, insulin pumps, surgical tools, patient monitoring systems, and more. Powered by our diverse knowledge, insatiable curiosity, and desire to help all those who need it, we deliver innovative technologies that transform the lives of two people every second, every hour, every day. Expect more from us as we empower insight-driven care, experiences that put people first, and better outcomes for our world. In everything we do, we are engineering the extraordinary. For more information on Medtronic (NYSE:MDT), visit www.Medtronic.com and follow @Medtronic on X (formerly Twitter) and LinkedIn .
FORWARD LOOKING STATEMENTS
This press release contains forward-looking statements within the meaning of the Private Securities Litigation Reform Act of 1995, which are subject to risks and uncertainties, including risks related to competitive factors, difficulties and delays inherent in the development, manufacturing, marketing and sale of medical products, government regulation, geopolitical conflicts, general economic conditions, and other risks and uncertainties described in the company's periodic reports on file with the U.S. Securities and Exchange Commission including the most recent Annual Report on Form 10-K of the company. In some cases, you can identify these statements by forward-looking words or expressions, such as "anticipate," "believe," "could," "estimate," "expect," "forecast," "intend," "looking ahead," "may," "plan," "possible," "potential," "project," "should," "going to," "will," and similar words or expressions, the negative or plural of such words or expressions and other comparable terminology. Actual results may differ materially from anticipated results. Medtronic does not undertake to update its forward-looking statements or any of the information contained in this press release, including to reflect future events or circumstances.
NON-GAAP FINANCIAL MEASURES
This press release contains financial measures, including adjusted net income, adjusted diluted EPS, and organic revenue, which are considered "non-GAAP" financial measures under applicable SEC rules and regulations. References to quarterly or annual figures increasing, decreasing or remaining flat are in comparison to fiscal year 2023.
Medtronic management believes that non-GAAP financial measures provide information useful to investors in understanding the company's underlying operational performance and trends and to facilitate comparisons with the performance of other companies in the med tech industry. Non-GAAP net income and diluted EPS exclude the effect of certain charges or gains that contribute to or reduce earnings but that result from transactions or events that management believes may or may not recur with similar materiality or impact to operations in future periods (Non-GAAP Adjustments). Medtronic generally uses non-GAAP financial measures to facilitate management's review of the operational performance of the company and as a basis for strategic planning. Non-GAAP financial measures should be considered supplemental to and not a substitute for financial information prepared in accordance with U.S. generally accepted accounting principles (GAAP), and investors are cautioned that Medtronic may calculate non-GAAP financial measures in a way that is different from other companies. Management strongly encourages investors to review the company's consolidated financial statements and publicly filed reports in their entirety. Reconciliations of the non-GAAP financial measures to the most directly comparable GAAP financial measures are included in the financial schedules accompanying this press release.
Medtronic calculates forward-looking non-GAAP financial measures based on internal forecasts that omit certain amounts that would be included in GAAP financial measures. For instance, forward-looking organic revenue growth guidance excludes the impact of foreign currency fluctuations, as well as significant acquisitions or divestitures. Forward-looking diluted non-GAAP EPS guidance also excludes other potential charges or gains that would be recorded as Non-GAAP Adjustments to earnings during the fiscal year. Medtronic does not attempt to provide reconciliations of forward-looking non-GAAP EPS guidance to projected GAAP EPS guidance because the combined impact and timing of recognition of these potential charges or gains is inherently uncertain and difficult to predict and is unavailable without unreasonable efforts. In addition, the company believes such reconciliations would imply a degree of precision and certainty that could be confusing to investors. Such items could have a substantial impact on GAAP measures of financial performance.
| Contacts: | |
| | |
| Erika Winkels | Ryan Weispfenning |
| Public Relations | Investor Relations |
| +1-763-526-8478 | +1-763-505-4626 |

![]()
![]() View original content to download multimedia: https://www.prnewswire.com/news-releases/medtronic-reports-second-quarter-fiscal-2024-financial-results-301994289.html
View original content to download multimedia: https://www.prnewswire.com/news-releases/medtronic-reports-second-quarter-fiscal-2024-financial-results-301994289.html
SOURCE Medtronic plc